. 2019 Jan 7;218(1):350-379.
doi: 10.1083/jcb.201711023. Epub 2018 Dec 6.

Automated profiling of growth cone heterogeneity defines relations between morphology and motility

Affiliations

Automated profiling of growth cone heterogeneity defines relations between morphology and motility

Maria M Bagonis et al. J Cell Biol. .

Abstract

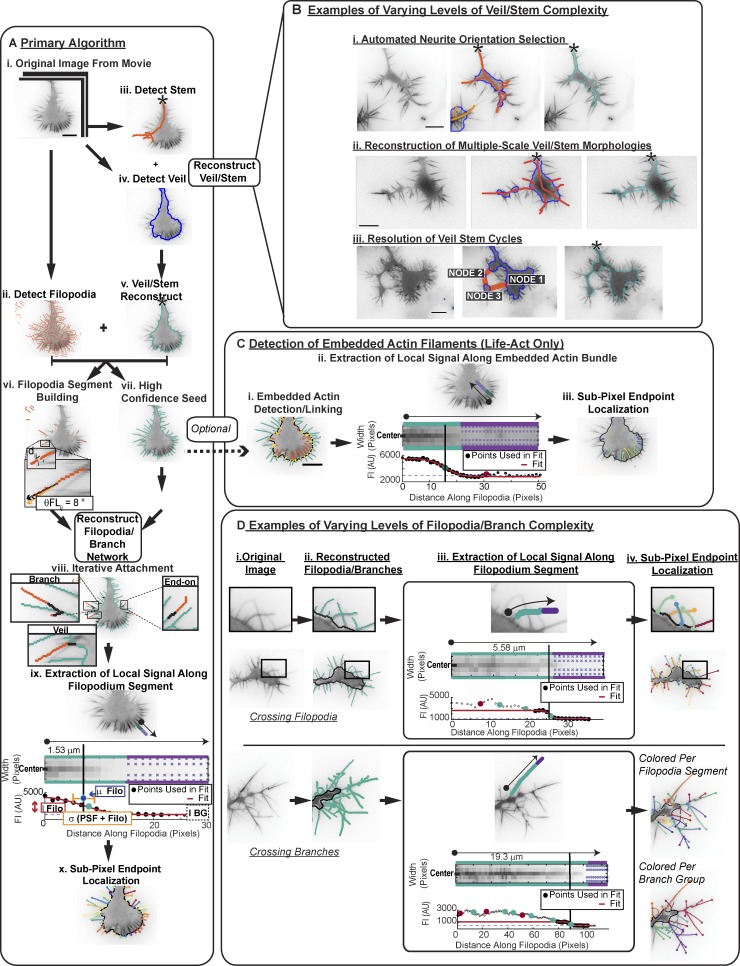
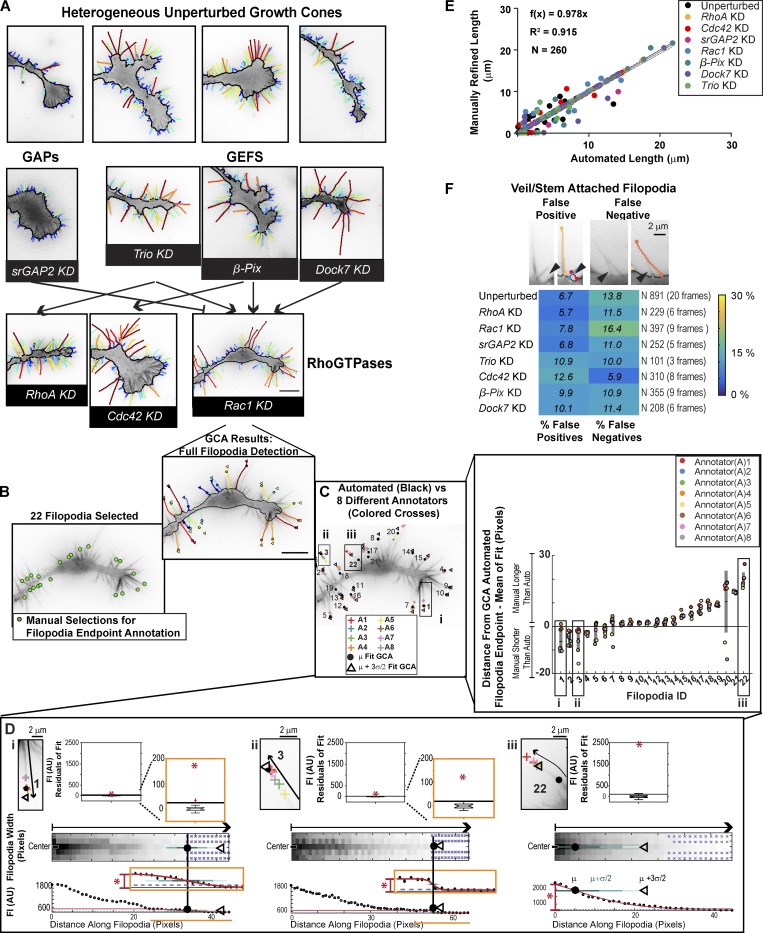
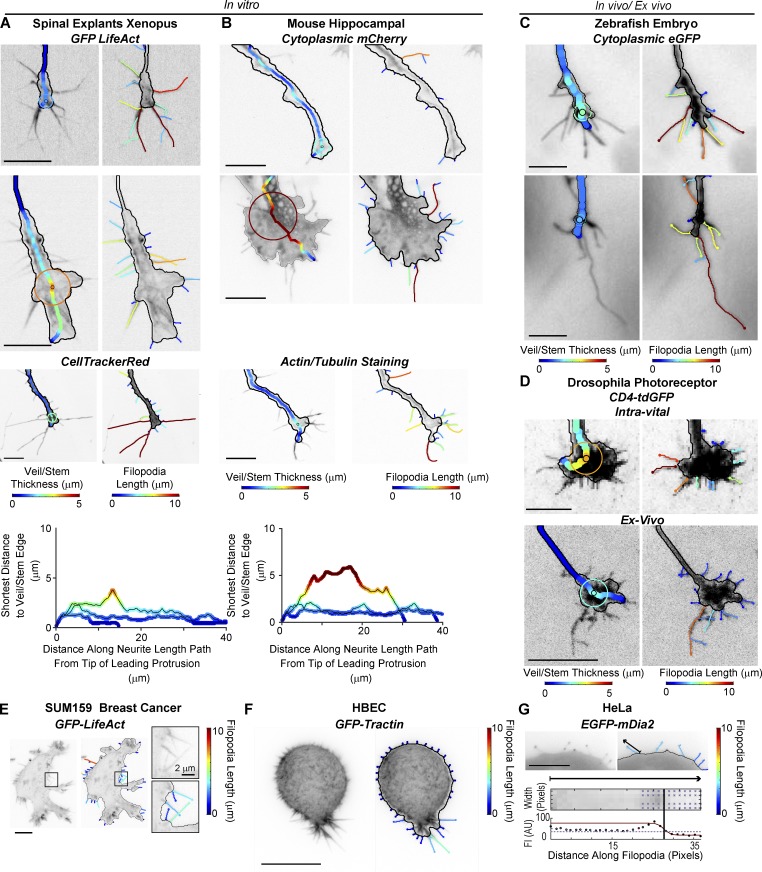
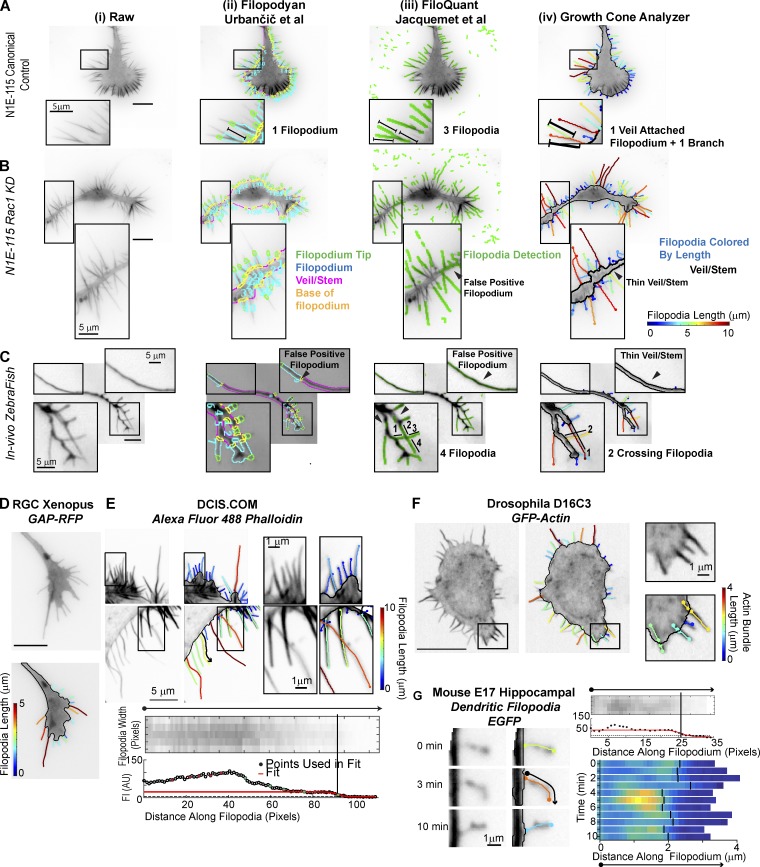
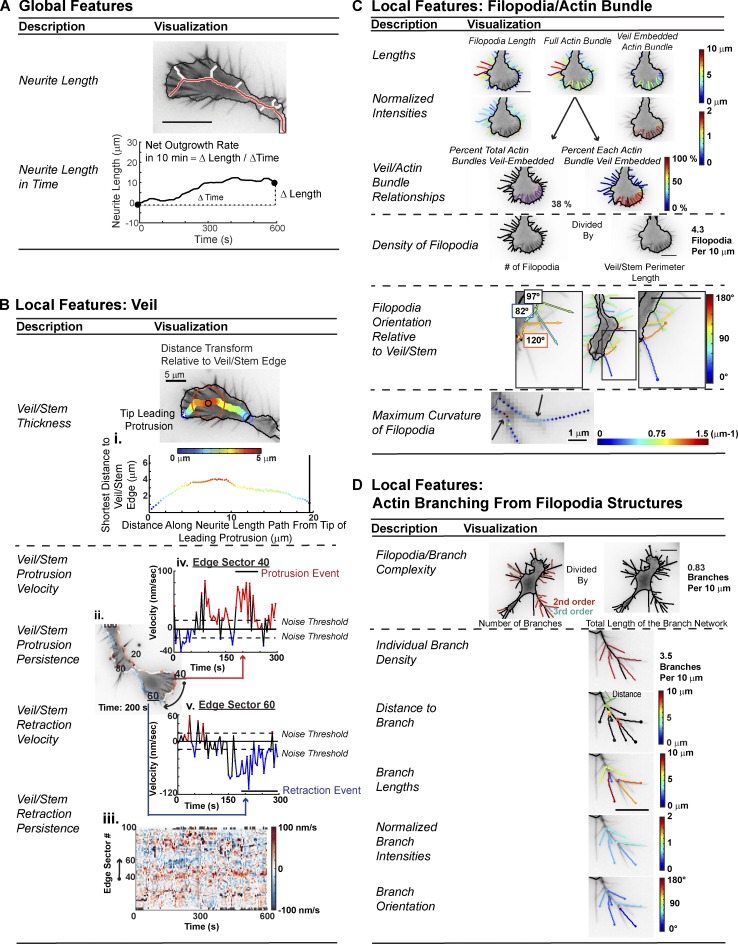
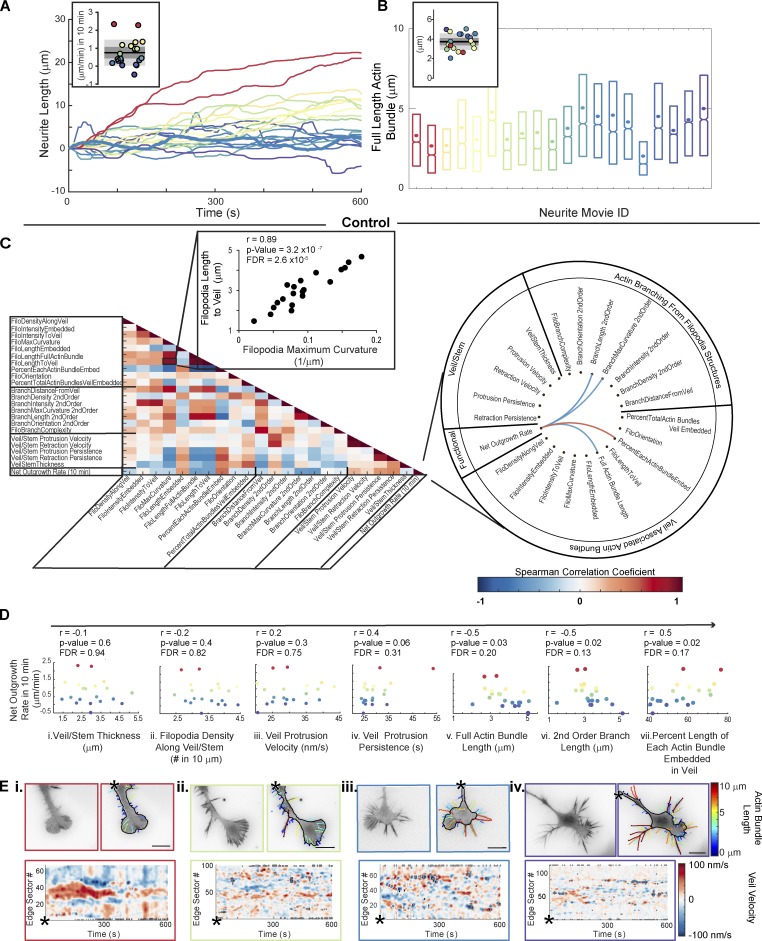
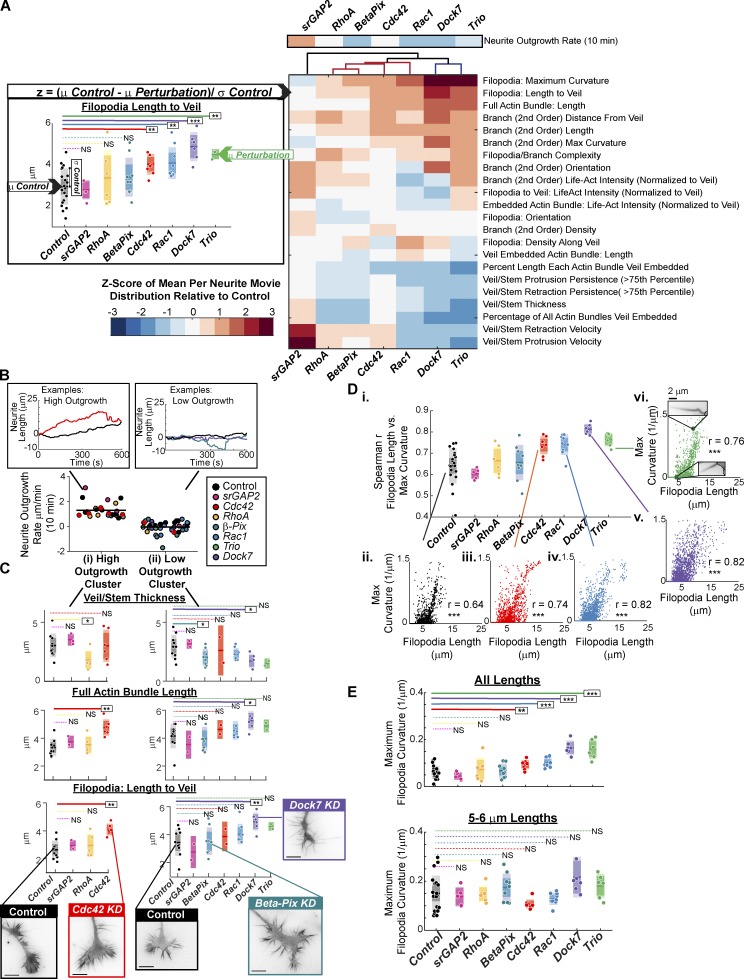
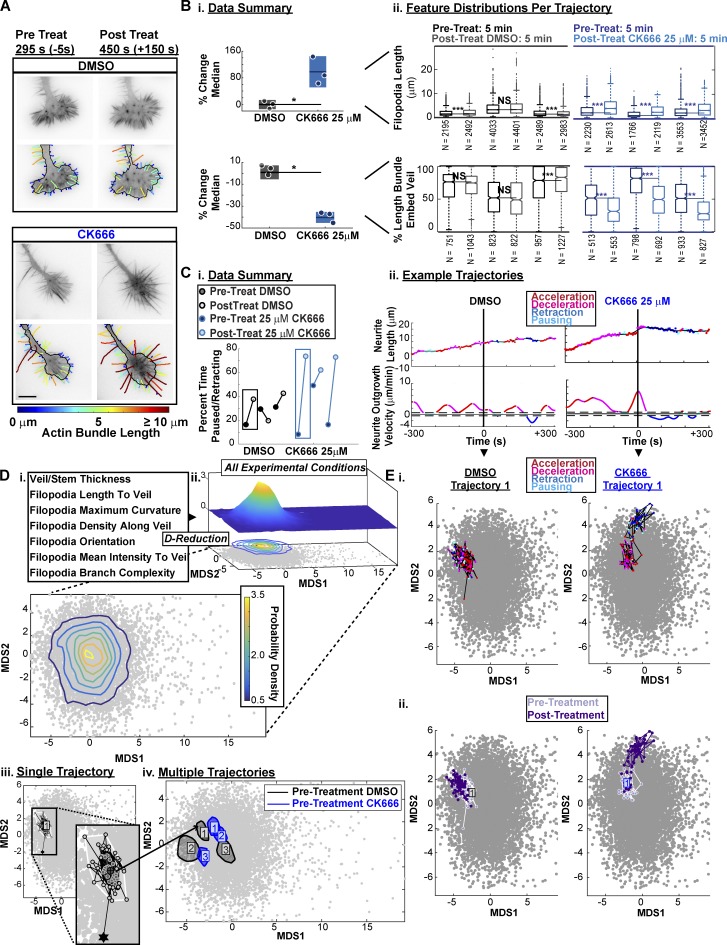
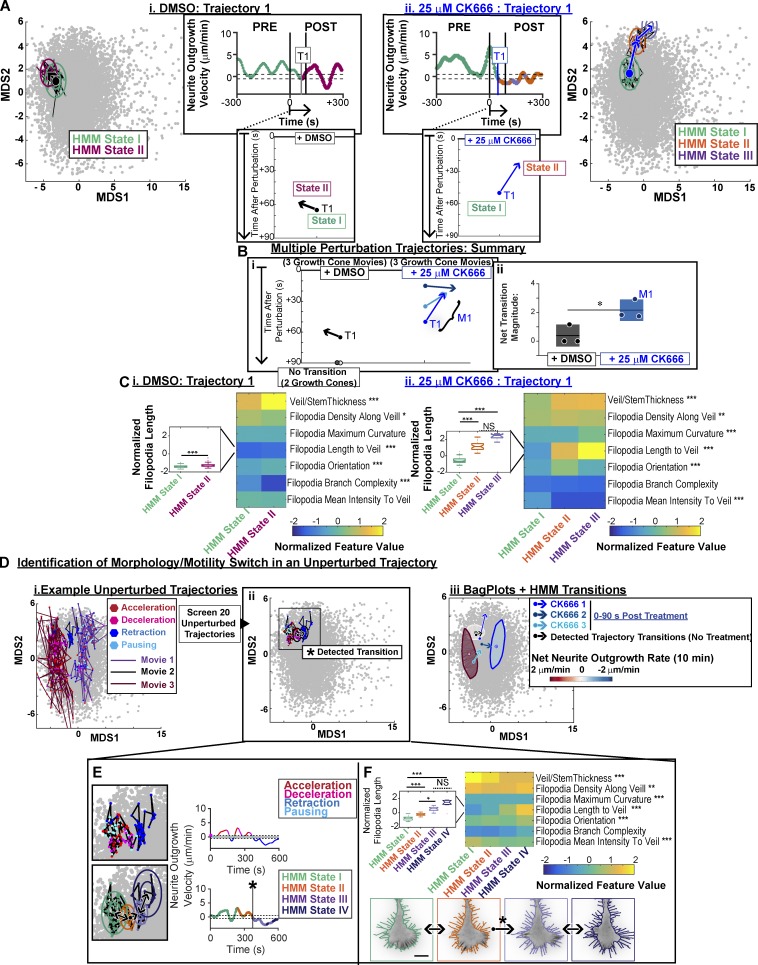
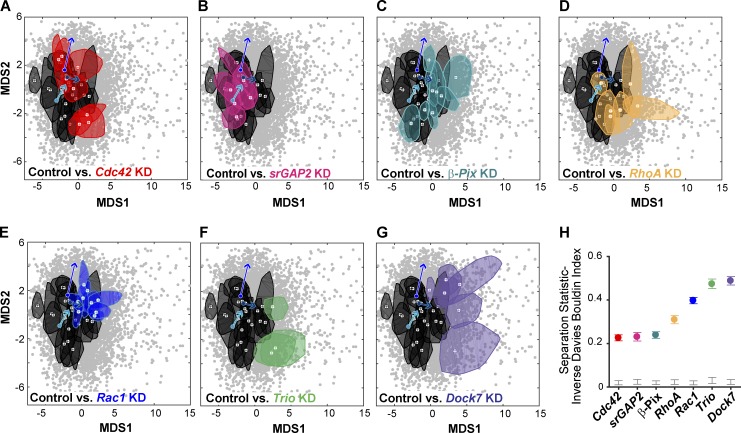
Growth cones are complex, motile structures at the tip of an outgrowing neurite. They often exhibit a high density of filopodia (thin actin bundles), which complicates the unbiased quantification of their morphologies by software. Contemporary image processing methods require extensive tuning of segmentation parameters, require significant manual curation, and are often not sufficiently adaptable to capture morphology changes associated with switches in regulatory signals. To overcome these limitations, we developed Growth Cone Analyzer (GCA). GCA is designed to quantify growth cone morphodynamics from time-lapse sequences imaged both in vitro and in vivo, but is sufficiently generic that it may be applied to nonneuronal cellular structures. We demonstrate the adaptability of GCA through the analysis of growth cone morphological variation and its relation to motility in both an unperturbed system and in the context of modified Rho GTPase signaling. We find that perturbations inducing similar changes in neurite length exhibit underappreciated phenotypic nuance at the scale of the growth cone.


Figures

Figure 1.
Figure 1.
Automated segmentation of heterogeneous morphologies by GCA. (A) GCA segmentation pipeline: Canonical N1E-115 GC expressing LifeAct GFP. See Video 1. (B) GCA segments GCs of varying veil/stem complexity. See Video 2. (C) Detection of veil-embedded actin bundles. (D) GCA segments GCs of varying filopodia/branch complexity. See Video 3 and Materials and methods. Bar, 10 µm.
Figure 2.
Figure 2.
Validation of GCA for segmentation of N1E-115 GCs. (A) GCA segmentation of N1E-115 GCs expressing GFP LifeAct on laminin. Embedded actin bundle detections not shown for clarity. (See Fig. S1, A and B, for raw images). GCs of KDs, as in Fig. S1 B, shown in context of their putative network interactions (see GC scale morphodynamic phenotypes section for references). See Videos 4, 5, and 6. Bar, 10 µm. (B–D) Variability in manual filopodia endpoint localization among annotators (see Materials and methods). (D) GCA filopodia linescan/fitting for example filopodia (i–iii). Boxplot insets (top): Distribution of the residuals for each fit compared with the fit amplitude (red star). Given the multiple scales of intensity decay in i and ii, fit regions, and the boxplots of the fit residuals, are magnified as indicated by orange insets. (E) Automated GCA versus manually refined filopodia lengths. See Fig. S4 A. Black line: Perfect correlation. Gray solid line: Linear fit to data. Gray dotted lines: CI of the fit. (F) GCA detection error for veil/stem attached filopodia. Top: Example overlays. Black arrowheads: Detection error. Bottom: Heat map of error rates.
Figure 3.
Figure 3.
GCA applied to a variety of cellular images. (A–D) GCA veil thickness (left) and filopodia (right) overlays for GCs of different size, type, and fluorescent label imaged in vitro (A and B) and in vivo/ex vivo (C and D). Xenopus spinal explants (A) and mice hippocampal neurons (B): unpublished data courtesy of Lowery Laboratory, Boston College, and Gupton Laboratory, University of North Carolina at Chapel Hill, respectively. (A and B) Bottom: Veil/stem size profiles comparing the GCs shown in the first three rows of A (left) and B (right). (C) Rohon–Beard GCs in a zebrafish embryo: previously published raw images in St John and Key (2012). (D) Intra-vital (top) and ex vivo images (bottom) of Drosophila photoreceptor GCs: maximum intensity projections as in Langen et al. (2015) and Özel et al. (2015), respectively. See Video 7. (E and F) GCA segmentation of 2D maximum intensity projections of SUM159 triple negative human breast cancer cell (E) and transformed human bronchial epithelial cell (HBEC) in a collagen I matrix imaged using meSPIM (F; Welf et al., 2016). (G) GCA segmentation of a HeLa cell expressing a filopodium-tip localizing marker. Bottom: Automated line scan along sparsely labeled filopodium marked by arrow. Bar, 10 µm, unless noted.
Figure 4.
Figure 4.
Comparison of GCA to contemporary filopodia detection software. (A–C) Segmentation overlays generated using Filopodyan (Urbančič et al., 2017; ii), FiloQuant (Jacquemet et al., 2017; iii), or GCA (iv). N1E-115 GCs expressing GFP-LifeAct (A and B) and a Rohon–Beard GC (C) in a zebrafish embryo (see Fig. 3 C). Visualization as in respective package. Zoomed regions highlight segmentation challenges. (D–G) GCA segmentation using previously published raw images available with contemporary software releases. (D and E) Filopodyan (Urbančič et al., 2017) and FiloQuant (Jacquemet et al., 2017). Bottom: Zoom and local intensity fit of filopodium marked by the black arrow in top image. (F and G) CellGeo (Tsygankov et al., 2014) and Dendritic Filopodia Motility Analyzer (Tárnok et al., 2015). Bar, 10 µm, unless noted.
Figure 5.
Figure 5.
GCA morphodynamic feature extraction. (A) Neurite length and net outgrowth rate definitions. (B) Features of veil/stem. (C) Features of filopodia/actin bundles. (D) Features of filopodia branching. See Materials and methods. Bar, 10 µm, unless noted.
Figure 6.
Figure 6.
Correlations between GC morphology and motility within an unperturbed, heterogeneous population. (A) Variation in neurite outgrowth rate across 20 control cells (inset, net outgrowth: 10 min. Bar, mean; dark gray regions, 95% CI of the mean; light gray regions, ±SD). (B) Distributions of actin bundle lengths for data in A, sorted by net outgrowth velocity (colors as in A; 3,047–8,213 actin bundles per movie). Boxplots: 25th, 50th, and 75th distribution quantiles. Circles: Mean per movie. Inset: Distribution of means. (C) Spearman correlation matrix of GCA features (left). Schema ball of strongest correlations between net outgrowth rate and GC features (P < 0.05 and false discovery rate (FDR) < 0.2; right). (D) Select morphology features versus net outgrowth rate (as in C). Each data point: single GC movie as in A. Spearman correlation coefficient, r. (E) GCA segmentation overlays (top) and veil-velocity maps (bottom) corresponding to key data points in the net neurite outgrowth rate distribution in A. See Video 4. Bar, 10 µm.
Figure 7.
Figure 7.
Morphodynamic analyses of select Rho GTPase pathway KDs. (See Fig. 2 A). (A) GC scale morphodynamic profiles extracted by GCA. Left: Example z-score calculation; scatter plots: mean filopodia length per 10-min GC movie (1,995–9,944 filopodia per movie). Midline bars: Mean of treatment distribution (3–20 GC movies per condition); dark colored regions: 95% CI of the mean; light colored regions: ±SD. *, P < 0.05; **, P < 0.01; ***, P < 0.001: two-sided permutation t test of the means. Right: Hierarchical clustering of siRNA z-score vectors. Above clustering: z-scores for 10-min neurite outgrowth rate (a global/functional feature). (B) N1E-115 Rho GTPase perturbation dataset (n = 66 GC movies) separated into high (i) and low (ii) net neurite outgrowth clusters for further analysis in C. Insets: Prototypical neurite length trajectories for high (right) and low (left) neurite outgrowth clusters. (C) Robustly elongating Cdc42 KD GCs exhibit enhanced filopodia lengths with no change in veil/stem thickness. Select GC features for high (3–10 GC movies per condition; 2,743–10,216 actin bundles per movie; i) and low (2–10 GC movies per condition; 2,146–8,280 actin bundles per movie; ii) outgrowth neurites. Scatter plots as defined in A. *, P < 0.05; **, P < 0.01; NS, P > 0.05: two-sided permutation t test of the means. Insets: Example images, respective cluster. (D) Positive correlation between filopodia length and maximum filopodia curvature. (i) Scatter points: Spearman r between the two features per GC movie; 5–20 GC movies per treatment; 1,299–7,060 filopodia per movie. (ii–vi) Example correlation plots. Scatter points: single filopodium. N filopodia: (ii) 4,952; (iii) 3,739; (iv) 4,647; (v) 3,740; (vi) 2,328. ***, P < 0.001: Benjamini–Hochberg adjusted. (E) Enhancement of filopodia curvature observed upon Rho GTPase perturbation (top) is primarily a secondary effect of increased filopodia length (bottom). 5–20 GC movies per treatment; 1,299–7,060 filopodia per movie (top); 25–519 filopodia per movie (bottom). *, P < 0.05; **, P < 0.01; ***, P < 0.001: two-sided permutation t test of the means. See Videos 5 and 6.
Figure 8.
Figure 8.
ARP2/3 inhibition via CK666 treatment induces GC morphological changes and stagnation of neurite outgrowth. (A) GCA segmentation of N1E-115 GCs on laminin before (left) and after (right) treatment with DMSO or 25 µM CK666. Bar, 10 µm. (B) CK666 treatment increases filopodia length (top) and decreases the percent length each actin bundle is embedded in veil (bottom). (i) Percent change in the median of the actin bundle distribution (scatter points) before and after treatment. n = 3 GC movies per treatment type. Lines, mean of distribution per treatment condition; dark shaded regions, 95% CIs about the means. *, P = 0.1: two-tailed permutation t test of the means. (ii) Distributions of actin bundle measurements. Boxplot: 25th, 50th, and 75th distribution quantiles. Whiskers, 1.5 × (Q75% − Q25%). ***, P < 0.001: two-tailed permutation test of the medians. (C) ARP2/3 inhibition via CK666 treatment induces functional transitions from neurite elongation to neurite pausing/retraction. (i) Summary of the percent time individual neurites were paused or retracting before and after treatment. n = 3 GC movies per condition. (ii) Neurite outgrowth lengths/velocities colored by neurite outgrowth state. Dashed line: threshold for pausing. (D) Visualization of morphological heterogeneity among individual GC movies. (i) GCA features calculated per frame for D-reduction. (ii) MDS plot of morphology features (72 GC movies: 8,454 frames). Probability density isocontours for entire dataset visualized in 3D (top) and 2D (bottom). (iii) Example of full bagplot (i.e., 2D boxplot; Rousseeuw et al., 1999) for a single 5-min trajectory before acute perturbation. Dark shaded contour: bag; light shaded contour: fence; circles: individual data points. Black star: outlier data point. Cross: Tukey median. (iv) Bagplot “bags” for six GC movies before acute treatment with DMSO (black) or 25 µM CK666 (blue). (E) CK666 treatment induces a shift in morphology space, coupled to neurite outgrowth state. Two GC movies acutely treated with DMSO (left) or 25 µM CK666 (right). Per-frame coordinates in reduced morphology space colored by neurite outgrowth state (i) or timing relative to treatment (ii). Each movie: 10 min total, 5-s intervals.
Figure 9.
Figure 9.
Detection of significant transitions in GC morphology along a neurite outgrowth trajectory. (A) Time series modeling of a DMSO- (left and Video 9) and CK666 (right and Video 10)-treated GC movie in reduced morphology space. Colors: state ID inferred from the HMM/Bayesian model selection. Rings: 1× and 2× the SD of the state distribution centered on the mean. Bottom insets: Plot of detected transition within a 90-s window after respective treatment. (B) CK666 treatment induces reproducible GC morphology state transitions. (i) Plots of detected morphology transitions for six movies (as described in A, bottom inset) 90 s after treatment with DMSO (gray/black shaded vectors) or 25 µM CK666 (blue shaded vectors). (ii) Magnitude of the transition vectors in i. *, P < 0.05, two-tailed t test for equal means. (C) Median of feature distribution for each detected HMM morphology state detected in A (DMSO, left; CK666, right). *, P < 0.05; **, P < 0.01; ***, P <0.001: Kruskal–Wallis test. Insets: Boxplots of the distribution of filopodia lengths in each HMM state. *, P < 0.05; **, P < 0.01; ***, P < 0.001: Tukey–Kramer test. (D) Identification of morphology/motility switches in a heterogeneous population of unperturbed trajectories. (i) Three unperturbed GC movies overlaid on the morphological landscape, each frame colored by neurite outgrowth state as in Fig. 8 E, i. Identification of morphology/motility switch (starred black arrow) similar to that induced upon acute treatment with CK666 (A–C). Black rings: HMM states as defined in A. Colors as in D, i. (iii) “Bag” contours as defined in Fig. 8 D, iii, for GC movies in i. Arrows: Detected morphology state transitions from B and D, ii. Each movie: 10 min total, 5-s intervals. (E) Zoom (left) and neurite outgrowth velocity (right) of unperturbed GC movie identified in D, ii, frame colored by neurite outgrowth state (top) or HMM state ID as defined in A (bottom). (F) Feature/HMM state heat maps (as defined in C) for unperturbed movie identified in D, ii (top). Example GCA segmentations for each HMM morphology state (bottom).
Figure 10.
Figure 10.
Rho GTPase pathway perturbed GCs in the context of the morphology landscape. (A–G) “Bag” contours as defined in Fig. 8 D, iii, for control (black) and siRNA (colored) movies. 3–20 GC movies per condition. (H) Separation statistics: control versus KD. Colored bars: 95th percentile bootstrapped CIs. Gray bars: CI between 5th and 95th quartile of the randomized, null distribution. Gray scatter points: same as in Fig. 8, D and E, and Fig. 9. Arrows: Morphology transitions of three example GC trajectories within 90 s after CK666 treatment (25 µM) as identified in Fig. 9 B.

References

    1. Amano M., Chihara K., Nakamura N., Fukata Y., Yano T., Shibata M., Ikebe M., and Kaibuchi K.. 1998. Myosin II activation promotes neurite retraction during the action of Rho and Rho-kinase. Genes Cells. 3:177–188. 10.1046/j.1365-2443.1998.00181.x - DOI - PubMed
    1. Avis D. 1983. A survey of heuristics for the weighted matching problem. Networks. 13:475–493. 10.1002/net.3230130404 - DOI
    1. Barry D.J., Durkin C.H., Abella J.V., and Way M.. 2015. Open source software for quantification of cell migration, protrusions, and fluorescence intensities. J. Cell Biol. 209:163–180 10.1083/jcb.201501081. 10.1083/jcb.201501081 - DOI - PMC - PubMed
    1. Benjamini Y., and Hochberg Y.. 1995. Controlling the False Discovery Rate: A Practical and Powerful Approach to Multiple Testing. J. R. Stat. Soc. Series B Stat. Methodol. 57:289–300.
    1. Borg I. 1997. Modern Multidimensional Scaling: Theory and Applications. Springer-Verlag, New York: 614 pp.

Publication types

MeSH terms