. 2019 Jan 30;39(5):900-917.
doi: 10.1523/JNEUROSCI.0183-18.2018. Epub 2018 Dec 6.

Lateralized Suppression of Alpha-Band EEG Activity As a Mechanism of Target Processing

Affiliations

Lateralized Suppression of Alpha-Band EEG Activity As a Mechanism of Target Processing

Felix Bacigalupo et al. J Neurosci. .

Abstract

Alpha-band (8-12 Hz) EEG activity has been linked to visual attention since the earliest EEG studies. More recent studies using spatial cuing paradigms have shown that alpha is suppressed over the hemisphere contralateral to a to-be-attended location, suggesting that alpha serves as a mechanism of preparatory attention. Here, we demonstrate that alpha also plays a role in active target processing. EEG activity was recorded from a group of healthy male and female human subjects in two visual search experiments. In addition to alpha activity, we also assessed the N2pc event-related potential component, a lateralized transient EEG response that has been tightly linked with the focusing of attention on visual targets. We found that the visual search targets triggered both an N2pc component and a suppression of alpha-band activity that was greatest over the hemisphere contralateral to the target (which we call "target-elicited lateralized alpha suppression" or TELAS). In Experiment 1, both N2pc and TELAS were observed for targets presented in the lower visual field but were absent for upper-field targets. However, these two lateralized effects had different time courses and they responded differently to manipulations of crowding in Experiment 2. These results indicate that lateralized alpha-band activity is involved in active target processing and is not solely a preparatory mechanism and also that TELAS and N2pc reflect a related but separable neural mechanism of visuospatial attention.SIGNIFICANCE STATEMENT The very first EEG studies demonstrated that alpha-band (8-12 Hz) EEG oscillations are suppressed when people attend to visual information and more recent research has shown that cuing an individual to expect a target at a specific location produces lateralized suppression in the contralateral hemisphere. Therefore, lateralized alpha may serve as a preparatory mechanism. In the present study, we found that a similar lateralized alpha effect is triggered by the appearance of a visual target even though the location could not be anticipated, demonstrating that alpha also serves as an active mechanism of target processing. Moreover, we found that alpha lateralization can be dissociated from other lateralized measures of target selection, indicating that it reflects a distinct mechanism of attention.

Keywords: EEG; N2pc; alpha-band; attention; lateralization.


Figures

Figure 1.
Figure 1.
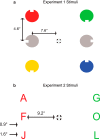
Example stimuli from the two experiments. a, Experiment 1 task. One color was designated the target color at the beginning of each block and participants were instructed to report whether the target-colored circle had a gap on the top or on the bottom. Target location varied unpredictably from trial to trial. b, Experiment 2 task. One color was designated as the target color at the beginning of each block. Participants were instructed to report whether the middle letter in the set of letters of this color was a vowel or a consonant. The middle letter was always on the horizontal meridian and the flankers could be absent, 1.6° above and below the middle letter, or 0.9° above and below the middle letter. The side containing the target color varied unpredictably from trial to trial.
Figure 2.
Figure 2.
HEOG waveforms (after artifact rejection) for left-side and right-side targets in Experiments 1 (a) and 2 (b). The scale of ±16 μV reflects a horizontal eye deviation of ±1°. Therefore, on average, the residual eye movements were negligible (<0.1°).
Figure 3.
Figure 3.
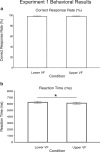
Mean correct response rate (a) and mean RT (b) for Experiment 1. *p < 0.05. Error bars indicate the within-subjects SEM.
Figure 4.
Figure 4.
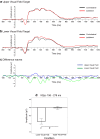
Grand average ERPs from Experiment 1. Contralateral and ipsilateral ERP waveforms are shown for targets in the upper VF (a) and lower VF (b). c, Contralateral-minus-ipsilateral difference waves. d, Mean N2pc amplitude measured from the difference waves. Error bars indicate the within-subjects SEM. #p < 0.05 for difference from zero. *p < 0.05 for comparison of upper and lower VFs.
Figure 5.
Figure 5.
Topographic plots of the averaged ERP during the N2pc window for left and right targets and for the contralateral-minus-ipsilateral difference for upper VF (a) and lower VF (b) targets. Given the way the data are combined to derive the N2pc component, the left and right hemispheres are necessarily mirror images. The typical occipitotemporal N2pc scalp distribution was observed for the lower VF (b, right), but little or no contralaterality was observed for the upper VF target condition (a, right).
Figure 6.
Figure 6.
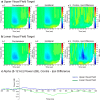
Grand average TF plots from Experiment 1. a, Upper VF targets that elicited approximately equivalent suppression of alpha-band power for both contralateral and ipsilateral electrodes relative to the target location (a.3). b, Lower-field targets, which elicited greater alpha-band suppression over the contralateral hemisphere (b.3). The white region at the bottom right corner of the plots indicates values that are undefined given the epoch length and wavelet duration. c, Time course of the contralateral-minus-ipsilateral difference in alpha-band power.
Figure 7.
Figure 7.
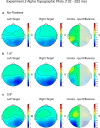
Topographic plots of induced alpha band (8–12 Hz) activity during the N2pc time window for left and right targets and for the contralateral-minus-ipsilateral difference for upper VF (a) and lower VF (b) targets. A lateralization effect was observed for lower VF targets (b, right), but not for upper VF targets (a, right).
Figure 8.
Figure 8.
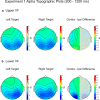
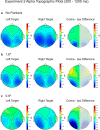
Topographic plots of induced alpha band (8–12 Hz) activity during a longer time window (200–1200 ms) for left and right targets and for the contralateral-minus-ipsilateral difference for upper VF (a) and lower VF (b) targets. A lateralization effect was observed for lower VF targets (b, right) but not for upper VF targets (a, right).
Figure 9.
Figure 9.
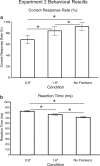
Mean correct response rate (a) and RT (b) for Experiment 2. This is a typical pattern showing decreased accuracy and longer RT for the most crowded conditions. Error bars indicate the within-subjects SEM. *p < 0.05 for pairwise comparison.
Figure 10.
Figure 10.
Experiment 2 grand-averaged ERPs. Contralateral and ipsilateral ERP waveforms are shown for the no-flankers condition (a), 1.6° condition (b), and 0.9° condition (c). d, Contralateral-minus-ipsilateral difference waves. e, Bar plots for the N2pc time window. Error bars indicate the within-subjects SEM. #p < 0.05 for one-sample t test against zero. *p < 0.05 for pairwise comparison. There was a significant N2pc effect only for the 1.6° condition.
Figure 11.
Figure 11.
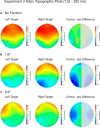
Topographic plots of the averaged ERP during the N2pc time window for left and right targets and for the contralateral-minus-ipsilateral difference for the no-flankers condition (a), 1.6° condition (b), and 0.9° condition (c). The N2pc showed a typical occipitotemporal distribution for the 1.6° condition.
Figure 12.
Figure 12.
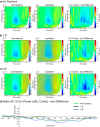
Grand-average TF plots from Experiment 2. Shown are contralateral, ipsilateral, and contralateral-minus-ipsilateral differences for the no-flankers condition (a), 1.6° condition (b), and 0.9° conditions (c). Target processing elicited greater alpha-band suppression over the contralateral hemisphere (right panels). The white region at the bottom right corner of the plots indicates values that are undefined given the epoch length and wavelet duration. d, Time course of the contralateral-minus-ipsilateral difference in alpha-band power.
Figure 13.
Figure 13.
Topographic plots of induced alpha band (8–12 Hz) activity during the N2pc time window for left and right targets and for the contralateral-minus-ipsilateral difference for the no-flankers condition (a), 1.6° condition (b), and 0.9° condition (c). Unlike the N2pc component, greater contralaterality was observed for the most crowded condition (c, right).
Figure 14.
Figure 14.
Topographic plots of induced alpha band (8–12 Hz) activity during a longer time window (200–1200 ms) for left and right targets and for the contralateral-minus-ipsilateral difference for the no-flankers condition (a), 1.6° condition (b), and 0.9° condition (c). Unlike the N2pc component, greater contralaterality was observed for the most crowded condition (c, right).

References

    1. Adrian ED, Matthews BH (1934) The Berger rhythm: potential changes from the occipital lobes in man. Brain 57:355–385. 10.1093/brain/57.4.355 - DOI - PubMed
    1. Bacigalupo F, Luck SJ (2015) The allocation of attention and working memory in visual crowding. J Cogn Neurosci 27:1180–1193. 10.1162/jocn_a_00771 - DOI - PMC - PubMed
    1. Berger H. (1929) Uber das elektrenkephalogramm des menschen. Archiv fur Psychiatrie 87:527–570. 10.1007/BF01797193 - DOI
    1. Bollimunta A, Chen Y, Schroeder CE, Ding M (2008) Neuronal mechanisms of cortical alpha oscillations in awake-behaving macaques. J Neurosci 28:9976–9988. 10.1523/JNEUROSCI.2699-08.2008 - DOI - PMC - PubMed
    1. Chelazzi L, Miller EK, Duncan J, Desimone R (1993) A neural basis for visual search in inferior temporal cortex. Nature 363:345–347. 10.1038/363345a0 - DOI - PubMed

Publication types