. 2019 Jan 4;363(6422):eaat6280.
doi: 10.1126/science.aat6280. Epub 2018 Dec 6.

Commensal-specific T cell plasticity promotes rapid tissue adaptation to injury

Affiliations

Commensal-specific T cell plasticity promotes rapid tissue adaptation to injury

Oliver J Harrison et al. Science. .

Abstract

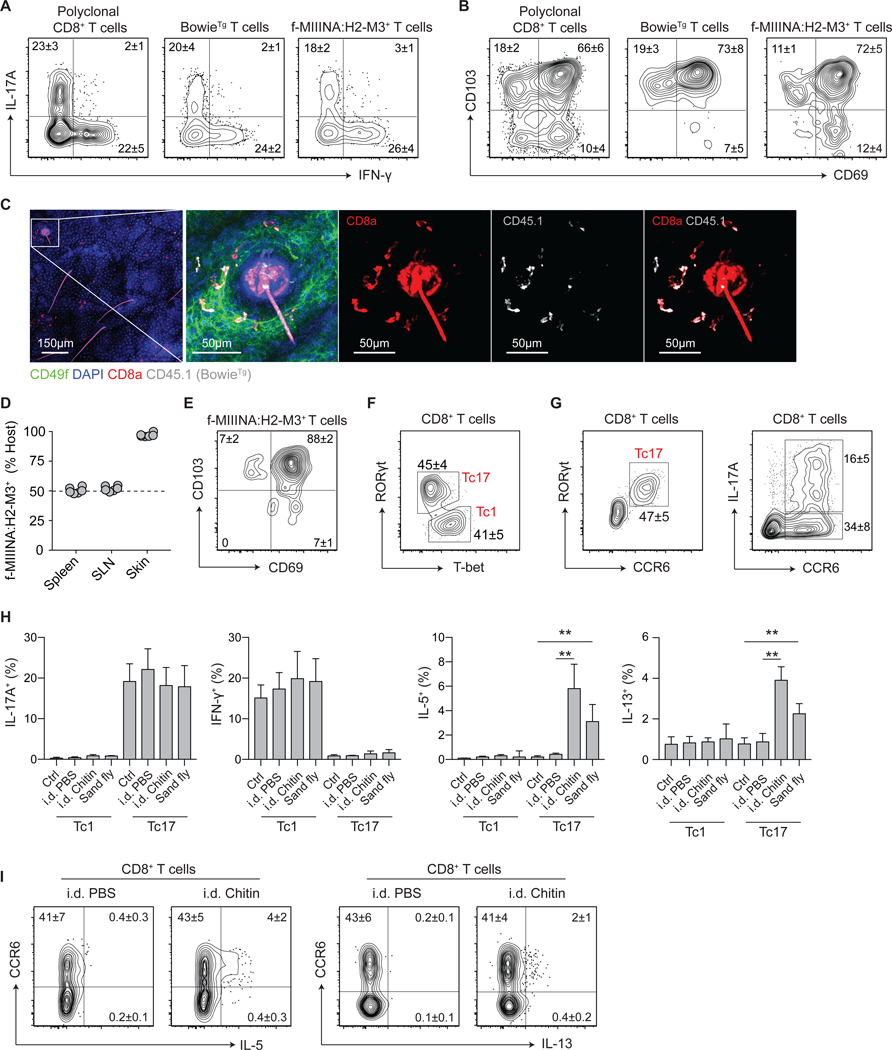
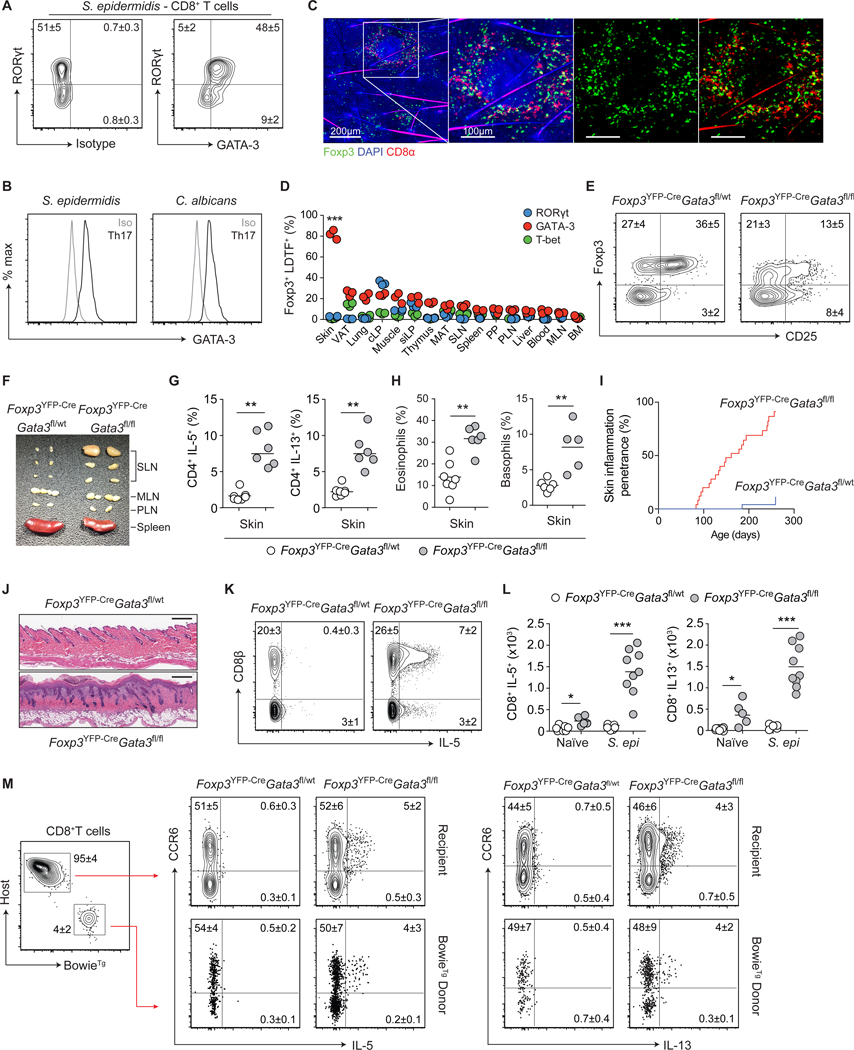
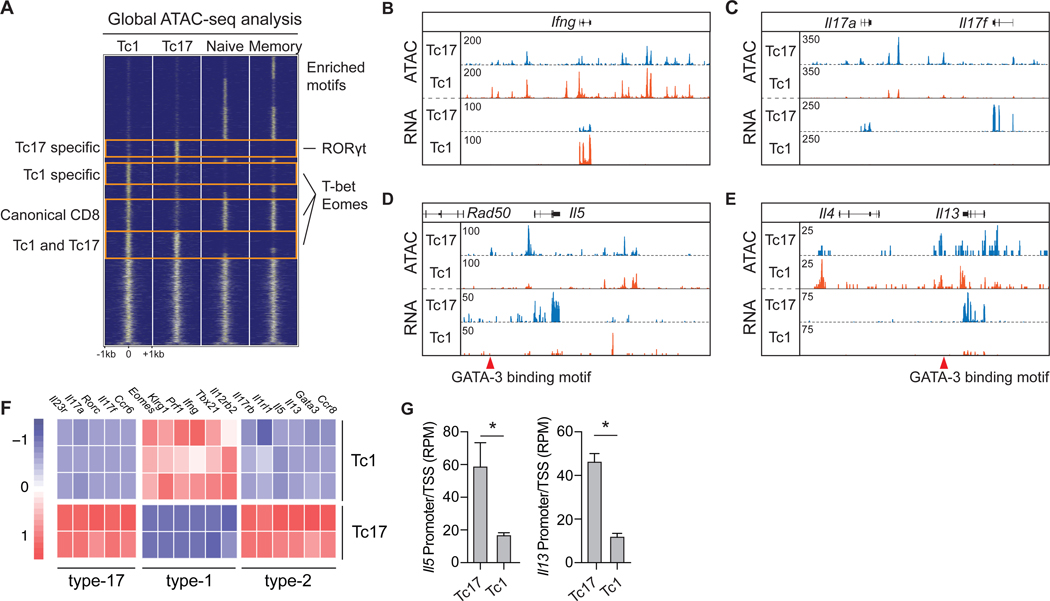
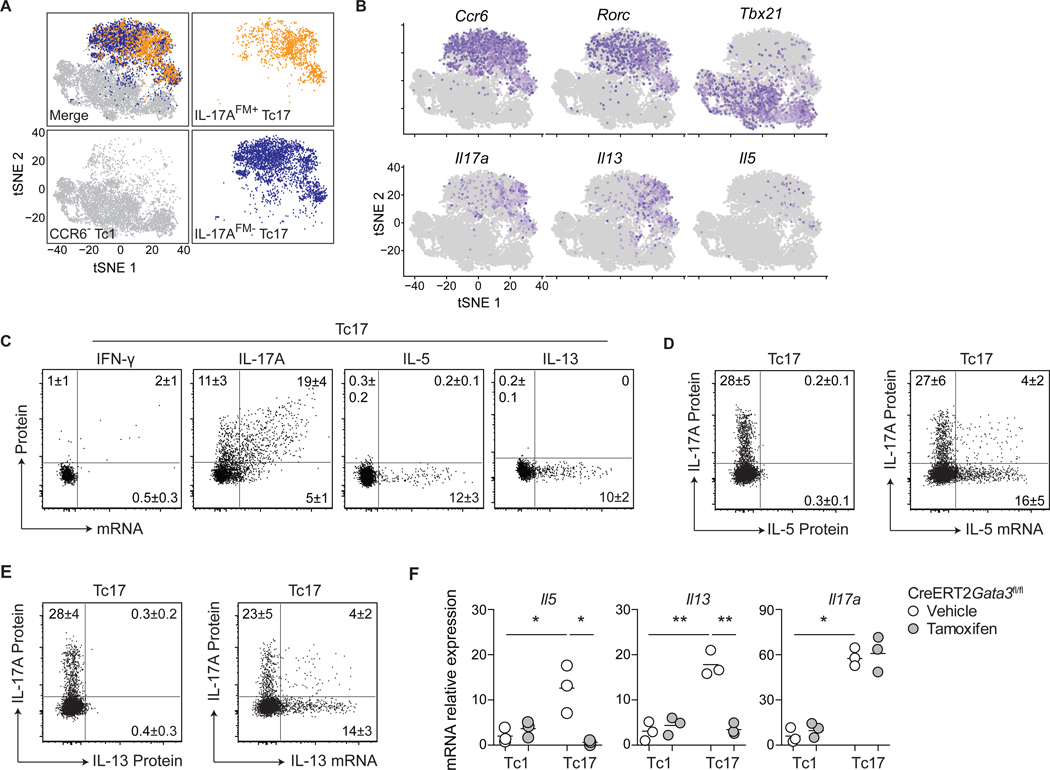
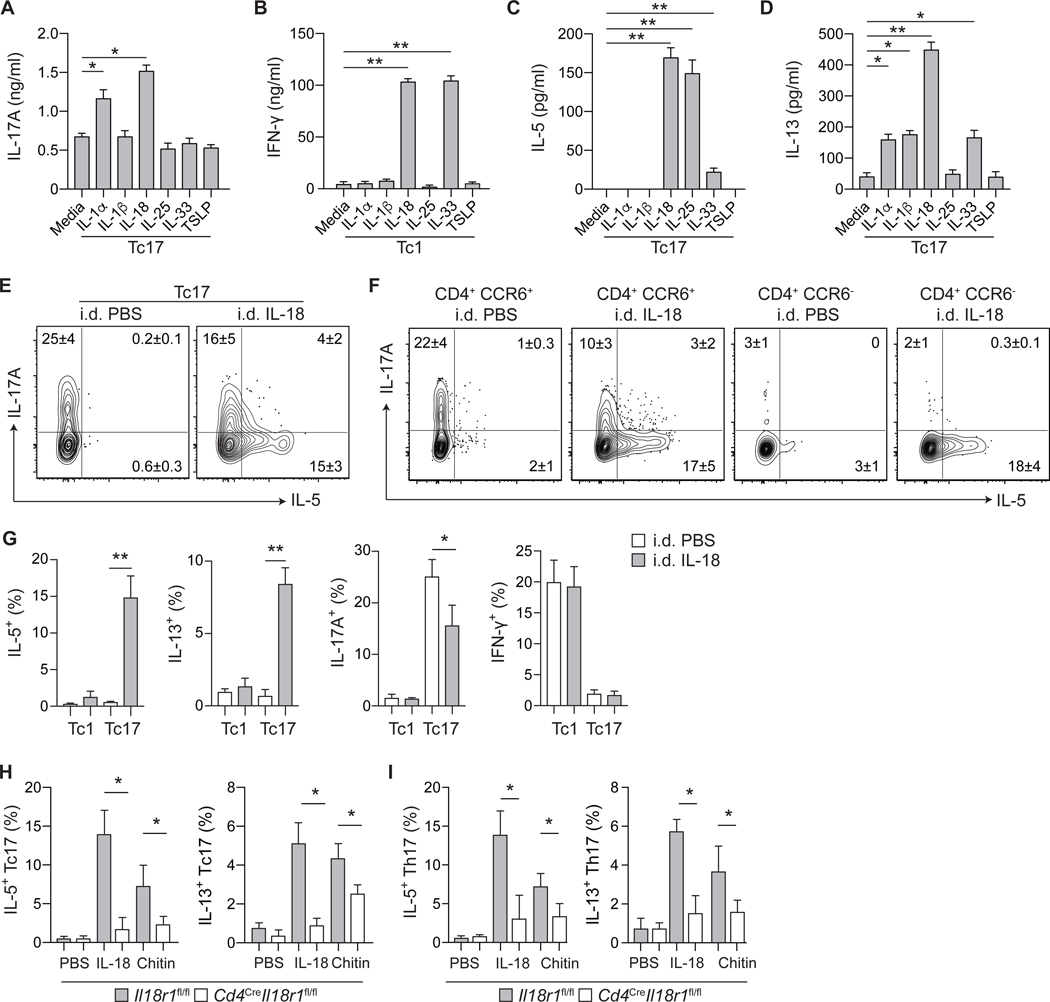
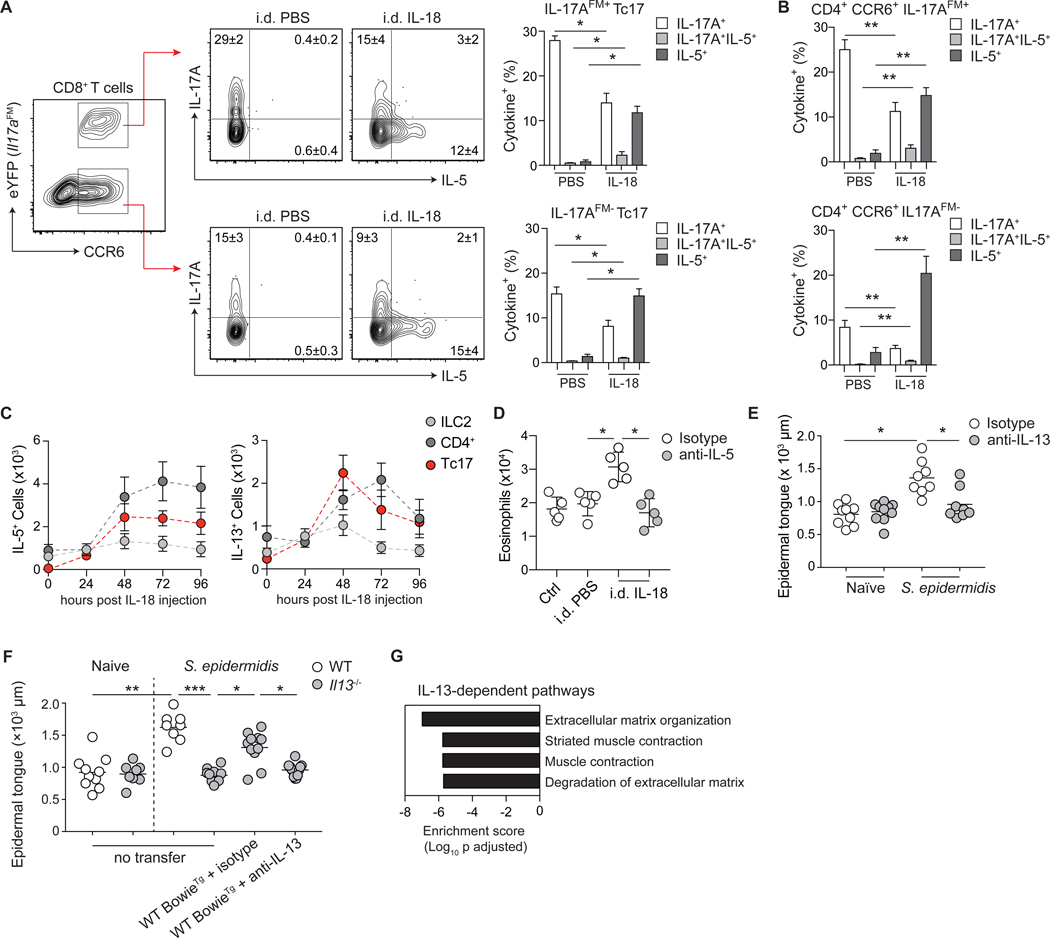
Barrier tissues are primary targets of environmental stressors and are home to the largest number of antigen-experienced lymphocytes in the body, including commensal-specific T cells. We found that skin-resident commensal-specific T cells harbor a paradoxical program characterized by a type 17 program associated with a poised type 2 state. Thus, in the context of injury and exposure to inflammatory mediators such as interleukin-18, these cells rapidly release type 2 cytokines, thereby acquiring contextual functions. Such acquisition of a type 2 effector program promotes tissue repair. Aberrant type 2 responses can also be unleashed in the context of local defects in immunoregulation. Thus, commensal-specific T cells co-opt tissue residency and cell-intrinsic flexibility as a means to promote both local immunity and tissue adaptation to injury.


Figures

Figure 1:
Figure 1:. Acute injury licenses type-2 cytokine production from commensal-specific type-17 cells.
(A-C) S. epidermidis-specific T cell receptor (TCR)-transgenic CD8+ T cells (BowieTg) were adoptively transferred to WT mice prior to colonization with S. epidermidis. (A) Representative contour plots of IL-17A and IFN-γ production potential and (B) expression of tissue residency markers CD69 and CD103 by indicated CD8+ T cell populations. (C) Representative confocal imaging volume projected along the z-axis of epidermal skin from S. epidermidis-colonized mice. (D-E) Conjoined pairs of S. epidermidis-colonized CD45.1 and CD45.2 mice were analyzed 90 days after parabiosis surgery for cellular origin and phenotype. (D) Frequency of host-derived f-MIIINA:H2-M3+ CD8+ T cells in indicated tissues; skin-draining lymph nodes (SLN). (E) Representative contour plot of CD69 and CD103 expression by skin f-MIIINA:H2-M3+ CD8+ T cells. (F) Representative contour plot of RORγt and T-bet expression by CD8+ T cells from the skin of S. epidermidis-colonized WT mice. (G) Representative contour plots of RORγt, CCR6, and IL-17A expression by CD8+ T cells from the skin of S. epidermidis-colonized WT mice. (H-I) S. epidermidis-colonized WT mice were exposed to bites from sand flies (L. longipalpis) or injected intradermally (i.d.) with PBS or chitin. (H) Frequencies of Tc1 and Tc17 cells with cytokine producing potential from the skin of S. epidermidis-colonized WT mice following skin injury. (I) Representative contour plots of IL-5 and IL-13 production potential by CD8+ T cells from the skin of S. epidermidis-colonized WT mice following skin injury. Numbers in representative plots indicate mean ± SD. Bar graphs are represented as mean ± SD. Data represent at least two experiments with 4–6 mice per group. **p < 0.01 as calculated using one-way ANOVA with Holm–Šidák’s multiple comparison test.
Figure 2:
Figure 2:. Local defects in immunoregulation unleash type-2 immunity from commensal-specific T cells.
(A) Representative contour plots of RORγt and GATA-3 expression by skin CD8+ T cells from S. epidermidis-colonized WT mice. (B) Representative histogram plots of GATA-3 expression by RORγt+ CD4+ Th17 cells from the skin of commensal-colonized WT mice. (C) Representative confocal imaging volume-projected along the z-axis of epidermal skin from S. epidermidis-colonized Foxp3gfp mice. (D) Frequencies of Foxp3+ Treg cells co-expressing lineage-defining transcription factors (LDTFs) within indicated tissues of naïve WT mice. Visceral adipose tissue (VAT), colonic lamina propria (cLP), small intestinal lamina propria (siLP), mesenteric adipose tissue (MAT), skin-draining lymph nodes (SLN), Peyer’s patch (PP), para-aortic lymph nodes (PLN), mesenteric lymph nodes (MLN), and bone marrow (BM). (E) Representative contour plots of Foxp3 and CD25 expression by skin CD4+ T cells from naïve Foxp3YFP-CreGata3fl/wt and Foxp3YFP-CreGata3fl/fl mice. (F) Representative cutaneous lymphadenopathy in Foxp3YFP-CreGata3fl/fl compared to Foxp3YFP-CreGata3fl/wt control mice. (G) Frequencies of IL-5- and IL-13-producing skin CD4+ T cells from naïve Foxp3YFP-CreGata3fl/wt and Foxp3YFP-CreGata3fl/fl mice. (H) Frequencies of skin eosinophils and basophils from naïve Foxp3YFP-CreGata3fl/wt and Foxp3YFP-CreGata3fl/fl mice. (I) Cumulative incidence of skin inflammation among naïve Foxp3YFP-CreGata3fl/wt and Foxp3YFP-CreGata3fl/fl mice. (J) Representative histological micrograph of skin tissue from naive Foxp3YFP-CreGata3fl/wt and Foxp3YFP-CreGata3fl/fl mice. Scale bar: 250 μm. (K) Representative contour plots of CD8β expression and IL-5 production potential by TCRβ+ T cells from the skin of S. epidermidis-colonized Foxp3YFP-CreGata3fl/wt and Foxp3YFP-CreGata3fl/fl mice. (L) Total numbers of IL-5 and IL-13-producing CD8+ T cells from the skin of S. epidermidis-colonized Foxp3YFP-CreGata3fl/wt and Foxp3YFP-CreGata3fl/fl mice. (M) Representative contour plots of IL-5 and IL-13 production by CD8+ T cells in Foxp3YFP-CreGata3fl/wt and Foxp3YFP-CreGata3fl/fl mice adoptively transferred with BowieTg T cells prior to colonization with S. epidermidis. Numbers in representative plots indicate mean ± SD. Each dot represents an individual mouse. Data represent at least two experiments with 3–7 mice per group. Cumulative skin inflammation data (I) represent 25 mice per genotype. *p < 0.05, **p < 0.01 as calculated using Student’s t-test (G, H) or one-way ANOVA with Holm–Šidák’s multiple comparison test (D, L).
Figure 3:
Figure 3:. S. epidermidis-specific Tc17 cells express a broad type-2 signature.
(A-G) Tc17 (CD8+CCR6+) and Tc1(CD8+CCR6) cells were isolated by FACS from the skin of S. epidermidis-colonized WT mice for transcriptomic and epigenetic analysis by RNA-seq and ATAC-seq. ATAC-seq signals from canonical naïve and memory CD8+ T cells were from lymphoid tissue. (A) Global comparison of ATAC-seq signals in S. epidermidis-induced Tc17 and Tc1 and canonical naïve and memory CD8+ T cells. Representative transcription factor binding motifs enriched in indicated groups are listed on the right. (B-E) Genomic tracks of ATAC-seq and RNA-seq signal profiles in Tc17 and Tc1 cells across signature cytokine genes. Genomic location of Tc17-specific regulatory elements with GATA-3 binding motifs are denoted by red triangles. (F) Heatmap of lineage-specific signature genes expressed by Tc17 and Tc1 populations. (G) Chromatin accessibility at transcription start site (promoter ± 500 bp) of Il5 and Il13 in Tc17 and Tc1 cells. Bar graphs are represented as mean ± SD. Sequencing data represent 2–3 independent biological replicates. *p < 0.05 as calculated using Student’s t-test.
Figure 4:
Figure 4:. S. epidermidis-specific Tc17 cells harbor a poised type-2 transcriptome.
(A-B) Tc1 (CD8+CCR6), IL-17AFM+ Tc17 (CD8+CCR6+eYFP+) and IL-17AFM− Tc17 (CD8+CCR6+eYFP) cells were isolated by cell sorting from the skin of S. epidermidis-colonized Il17aCreR26ReYFP (IL-17AFM) mice and analyzed by scRNA-seq. (A) t-Distributed stochastic neighbor embedding (tSNE) plots of the scRNA-seq expression highlighting Tc1 (gray), IL-17AFM+ Tc17 (orange), and IL-17AFM− Tc17 (blue) populations. (B) Expression of LDTFs and cytokine genes projected onto a tSNE plot. (C) Representative dot plots of cytokine protein production potential and mRNA expression by Tc17 cells from the skin of S. epidermidis-colonized WT mice. (D-E) Representative dot plots of IL-17A and IL-5 or IL-13 production potential and Il5 or Il13 mRNA expression by Tc17 cells from the skin of S. epidermidis-colonized WT mice. (F) S. epidermidis-colonized CreERT2Gata3fl/fl mice received tamoxifen or vehicle control prior to cell sorting of skin Tc1 and Tc17 cells. Gene expression, in the indicated populations, was assessed by qRT-PCR. Numbers in representative plots indicate mean ± SD. Flow cytometric data represent at least two experiments with 4–6 mice per group. qRT-PCR data represent three biological replicates of eight pooled mice per group. *p < 0.05; **p < 0.01 as calculated using one-way ANOVA with Holm–Šidák’s multiple comparison test.
Figure 5:
Figure 5:. Tissue alarmins license type-2 cytokine production from commensal-specific T cells.
(A-D) Tc17 (CD8+CCR6+) and Tc1 (CD8+CCR6) cells were isolated from the skin of S. epidermidis-colonized WT mice and cultured in vitro with agonistic anti-CD3ε mAb and indicated cytokines. Cell culture supernatants were assayed for cytokine production after 24 hours of culture. (E) Representative contour plots of IL-5 and IL-17A production potential by S. epidermidis-induced Tc17 cells, following i.d. injection with PBS or IL-18. (F) Representative contour plots of IL-5 and IL-17A production potential by skin CD4+Foxp3 T cells from S. epidermidis-colonized WT mice, following i.d. injection with PBS or IL-18. (G) Frequencies of Tc17 and Tc1 cells with indicated cytokine production potential from the skin of S. epidermidis-colonized WT mice following i.d. injection of PBS or IL-18. (H-I) Frequencies of (H) Tc17 and (I) Th17 cells with indicated cytokine production potential from the skin of S. epidermidis-colonized Cd4CreIl18r1fl/fl and control mice following i.d. injection with PBS, IL-18 or chitin. Numbers in representative plots indicate mean ± SD. Bar graphs are represented as mean ± SD. Data represent at least two experiments with 3–6 mice per group. *p < 0.05; **p < 0.01 as calculated using one-way (A-D, G) or two-way (H, I) ANOVA with Holm–Šidák’s multiple comparison test.
Figure 6:
Figure 6:. Commensal-specific T cell plasticity and IL-13 production promote wound repair.
(A) Representative contour plots for gating strategy of CCR6 and eYFP expression by CD8+ T cells from the skin of S. epidermidis-colonized Il17aCreR26ReYFP (IL-17AFM) mice following i.d. injection of PBS or IL-18. Contour plots represent IL-5 and IL-17A production potential of IL-17AFM+ Tc17 (CD8+CCR6+eYFP+) or IL-17AFM− Tc17 (CD8+CCR6+eYFP) T cells following i.d. injection of PBS or IL-18. (B) Frequencies of Th17 cells with IL-17A or IL-5 producing potential from the skin of S. epidermidis-colonized IL-17AFM mice following i.d. injection of PBS or IL-18. (C) Absolute cell number of IL-5 and IL-13-producing lymphocyte subsets in the skin of S. epidermidis-colonized WT mice following i.d. injection of IL-18. Data represented as mean ± SD of five mice per group. (D) Absolute number of eosinophils from the skin of S. epidermidis-colonized WT mice following i.d. injection with PBS or IL-18, and i.p. injection with anti-IL-5 or isotype control. (E-F) Naïve and S. epidermidis-colonized WT and Il13−/− mice, with or without adoptive transfer of BowieTg CD8+ T cells prior to colonization and isotype or anti-IL-13 antibodies at the time of wounding, were subjected to back-skin punch biopsy. Quantification of epithelial tongue length of wound-bed-infiltrating keratinocytes 5 days post wounding. (G) Pathway analysis using differentially expressed genes between d3 isotype and d3 anti-IL-13 wounding groups was performed using Enrichr and graphed based on enrichment score for significant Reactome biological processes. Numbers in representative plots indicate mean ± SD. Bar graphs are represented as mean ± SD. Data represent at least two experiments with 3–7 mice per group. *p < 0.05; **p < 0.01; ***p < 0.001 as calculated using one-way (A, B, D) or two-way (C, E, F) ANOVA with Holm–Šidák’s multiple comparison test.

Comment in

References

    1. Cong Y, Feng T, Fujihashi K, Schoeb TR, Elson CO, A dominant, coordinated T regulatory cell-IgA response to the intestinal microbiota. Proc Natl Acad Sci U S A 106, 19256–19261 (2009). - PMC - PubMed
    1. Hand TW et al., Acute gastrointestinal infection induces long-lived microbiota-specific T cell responses. Science 337, 1553–1556 (2012). - PMC - PubMed
    1. Yang Y et al., Focused specificity of intestinal TH17 cells towards commensal bacterial antigens. Nature 510, 152–156 (2014). - PMC - PubMed
    1. Naik S et al., Commensal-dendritic-cell interaction specifies a unique protective skin immune signature. Nature 520, 104–108 (2015). - PMC - PubMed
    1. Belkaid Y, Harrison OJ, Homeostatic Immunity and the Microbiota. Immunity 46, 562–576 (2017). - PMC - PubMed

Publication types

MeSH terms