. 2018 Dec 6;9(1):5206.
doi: 10.1038/s41467-018-07548-5.

Engrafted parenchymal brain macrophages differ from microglia in transcriptome, chromatin landscape and response to challenge

Affiliations

Engrafted parenchymal brain macrophages differ from microglia in transcriptome, chromatin landscape and response to challenge

Anat Shemer et al. Nat Commun. .

Abstract

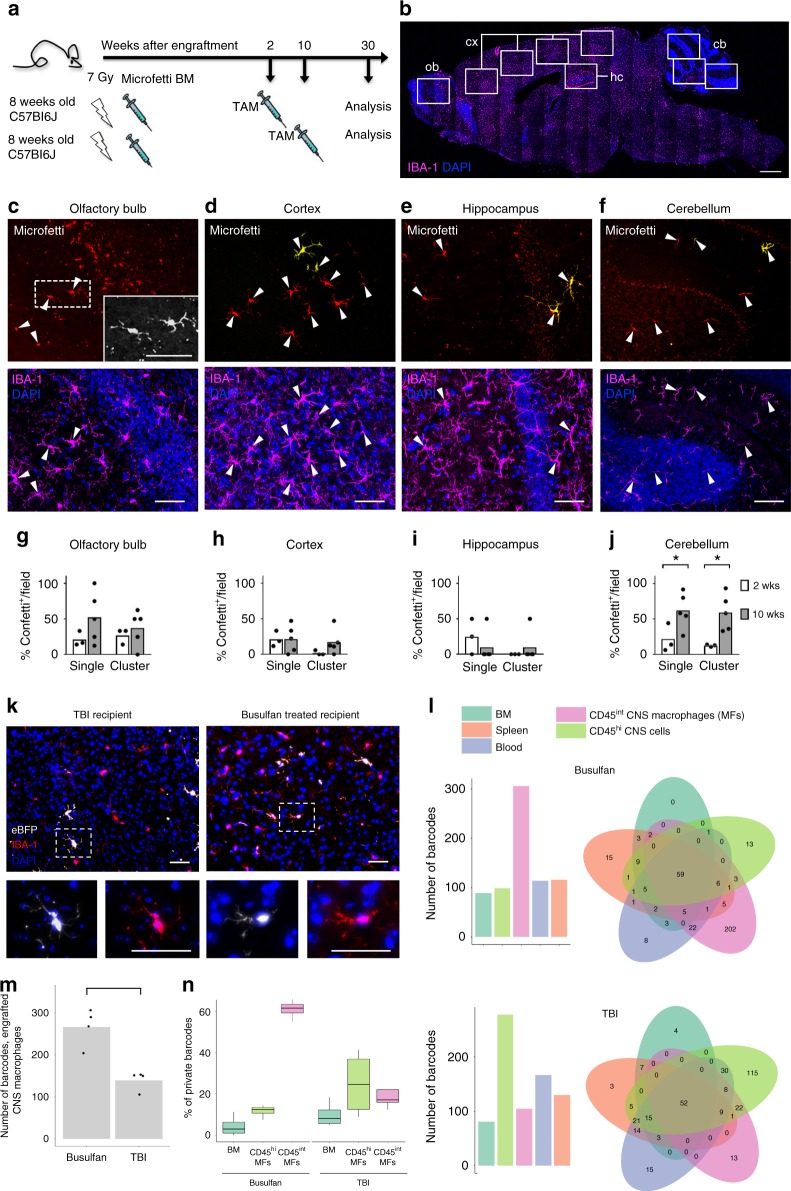
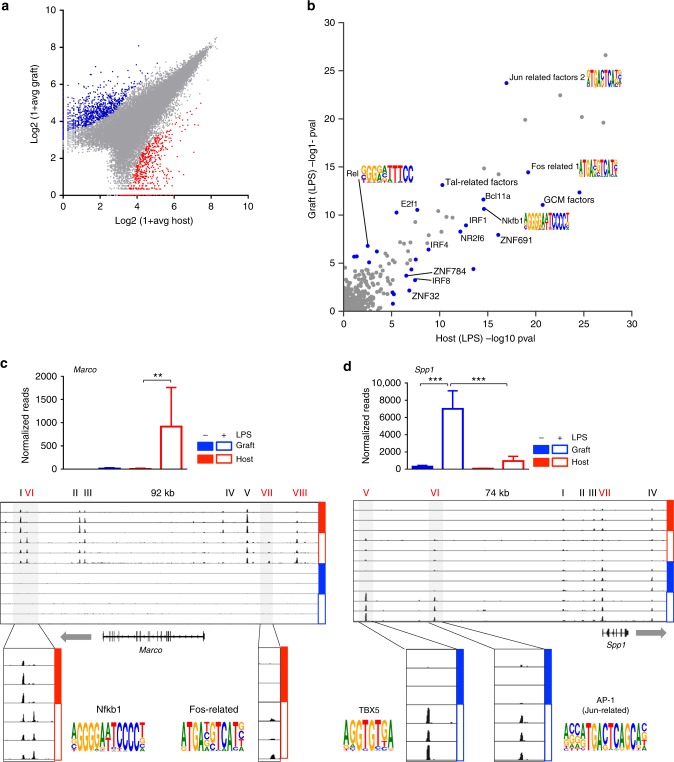
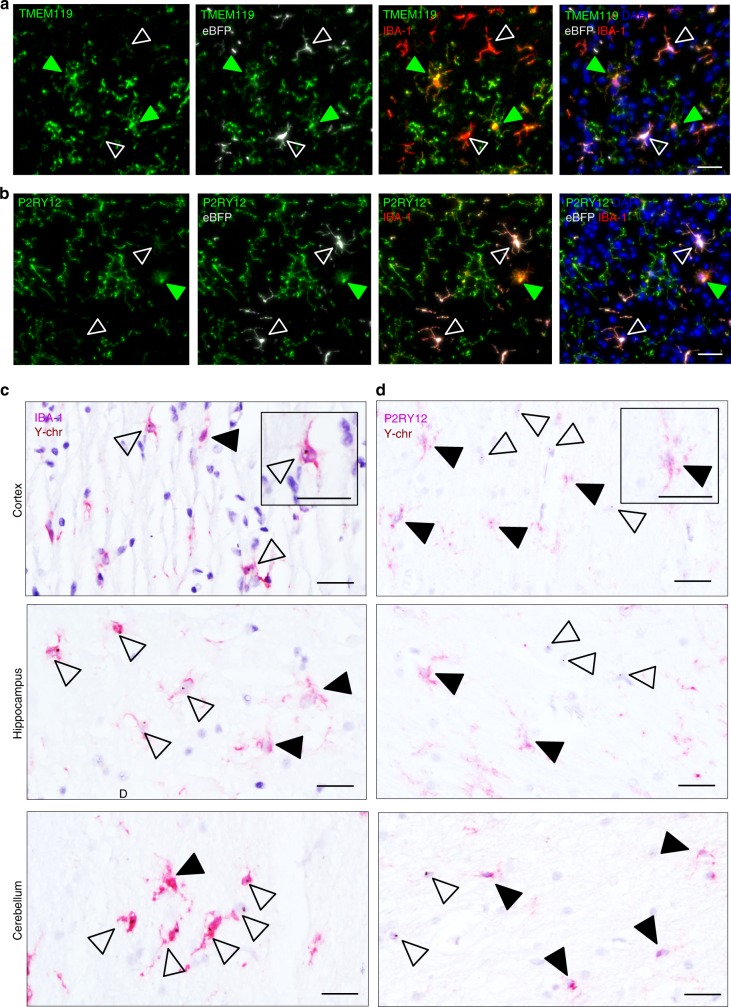
Microglia are yolk sac-derived macrophages residing in the parenchyma of brain and spinal cord, where they interact with neurons and other glial. After different conditioning paradigms and bone marrow (BM) or hematopoietic stem cell (HSC) transplantation, graft-derived cells seed the brain and persistently contribute to the parenchymal brain macrophage compartment. Here we establish that graft-derived macrophages acquire, over time, microglia characteristics, including ramified morphology, longevity, radio-resistance and clonal expansion. However, even after prolonged CNS residence, transcriptomes and chromatin accessibility landscapes of engrafted, BM-derived macrophages remain distinct from yolk sac-derived host microglia. Furthermore, engrafted BM-derived cells display discrete responses to peripheral endotoxin challenge, as compared to host microglia. In human HSC transplant recipients, engrafted cells also remain distinct from host microglia, extending our finding to clinical settings. Collectively, our data emphasize the molecular and functional heterogeneity of parenchymal brain macrophages and highlight potential clinical implications for HSC gene therapies aimed to ameliorate lysosomal storage disorders, microgliopathies or general monogenic immuno-deficiencies.


Conflict of interest statement

The authors declare no competing interests.

Figures

Fig. 1
Fig. 1
Engrafted brain macrophages accumulate over time and self-maintain. a Schematic of tandem BM transfer protocol. b Flow cytometric blood monocyte analysis of chimera 16 weeks post second transplantation. c Flow cytometric analysis of myeloid brain cells 16 weeks post second BMT revealing host microglia (CD45.1/2+, blue), cells derived from the first graft (CD45.1+ GFP+, red) and cells derived from the second graft (CD45.2+ RFP+, orange). d Distribution of host and graft-derived cells out of the total Ly6C/G (Gr1) CD45lo CD11b+ cells in brain and spinal cord at two time points. Data are a summary of six mice. e Histological analysis 7 weeks post second BMT revealing ramified GFP+ and RFP+ cells with microglia morphology (scale bar 20 μm). Representative picture
Fig. 2
Fig. 2
Engrafted brain macrophages display clonal expansion. a Fate-mapping scheme for donor “Microfetti” BM cells in lethally irradiated WT hosts. A single dose of TAM was applied at 2 or 10 weeks after BM reconstitution. BM chimeras were analyzed at 30 weeks after BM transplantation. b Representative sagittal brain section indicating the fields of view (rectangles) analyzed for IBA-1 (magenta) expressing graft microglia in the olfactory bulb (ob), cortex (cx), hippocampus (hc), and cerebellum (cb). DAPI (blue). Scale bar, 1 mm. cf Representative images of Confetti+ (yellow/ red) Iba-1+ (magenta) donor cells (arrowheads) in the (c) olfactory bulb (higher magnification in grayscale, inset), (d) cortex, (e) hippocampus, and (f) cerebellum. DAPI (blue). Scale bars, 50 µm (ce) and 100 µm (f). gj Frequency of Confetti+ IBA-1+ graft as single cells or clones in analyzed fields from TAM treatment groups of 2 (white) and 10 weeks (gray) after BM transplantation. Each dot represents the mean quantification of one animal. At least four sections per animal were analyzed. Mann–Whitney test, *P = 0.0357, 0.0179, respectively in (j). k Representative images of cortical eBFP+ (white) IBA-1+ (red) graft-derived cells in brains of TBI and busulfan-conditioned mice. DAPI (blue). Higher magnification in insets. Scale bars, 50 µm. l Representative barcode analysis on DNA extracted from peripheral blood, bone marrow, spleen, and sorted CD45int brain macrophages and CD45high cells of a busulfan- and a TBI-conditioned mouse. Barcode numbers for each sample are shown in the bar plot and the amount of shared barcodes per sample are displayed in the Venn diagrams. m Number of barcodes detected in engrafted macrophage samples of TBI- and busulfan- conditioned animals. Each dot represents one animal (n = 4 per group). n Bar graph showing percentages of barcodes private to grafted cells among CD45int and CD45hi CNS cells (i.e., parenchymal and non-parenchymal macrophages, respectively), as well as BM cells of TBI- and busulfan-conditioned animals (n = 4 per group)
Fig. 3
Fig. 3
Comparative transcriptome analysis of grafted cells and host microglia. a Gating strategy for isolation of CNS macrophages. Host microglia were defined as Ly6C/GCD11b+CD45.2lo cells; graft-derived cells were defined as Ly6C/GCD11b+CD45.1lo cells. b Principal component analysis of transcriptomes of engrafted cells and host microglia and transcriptomes of monocytes subsets. Source data are provided as a Source Data file. c Heatmap of RNA seq data of engrafted cells and host microglia compared to transcriptomes of Ly6C and Ly6C+ monocyte subsets. Analysis was restricted to genes, which showed a twofold difference and yielded p-value < 0.05 between at least two populations. Source data are provided as a Source Data file. d Heatmap showing differential TF expression profiles of engrafted cells and host microglia. Source data are provided as a Source Data file. e Examples of significantly differential (log2FC>1 and p-value < 0.05) gene expression enriched in engrafted cells. Graphs show normalized reads from RNA seq data of samples acquired in (a), n = 4. f Examples of genes expressed in similar levels in host and engrafted cells. Graphs show normalized reads from RNA seq data of samples acquired in (a), n = 4. None of the genes were differentially expressed (log2FC < 1). Tgfbr1 and Kcnk13 were of low significance (p-value < 0.05) but did not meet our FC threshold. g Examples of significantly differential (log2FC > −1, p-value < 0.05) gene expression enriched in host microglia. Graphs show normalized reads from RNA seq data of samples acquired in (a), n = 4. h Venn diagram showing overlap of genes differentially expressed by WT and Sall1-deficient microglia, and genes differentially expressed by host and engrafted brain macrophages. i Examples of gene expression of engrafted and host cells of genes expressed in non-CNS macrophages or Sall1-deficient microglia. Source data are provided as a Source Data file
Fig. 4
Fig. 4
Comparative epigenome analysis of grafted cells and host microglia. a IGV tracks of Sall1 and Klf2 loci showing ATAC signals in host (red) but not engrafted (blue) cells. N = 3. b IGV tracks of ApoE and Ms4a7 loci showing ATAC signals in engrafted cells (blue) but not host (red) microglia. N = 3. c ATAC-seq IGV tracks (left, n = 3) and normalized RNA seq reads (right, n = 4) of H2-ab1 and Dbi in host microglia (red) and engrafted cells (blue). +—p-value < 10−5, n.s.—p-value > 0.05. d Analysis of all 58,947 detected ATAC peaks, from which 1506 peaks and 2,176 peaks displayed >4-fold significant (p-value < 0.01) enrichment in host microglia and engrafted cells, respectively. Source data are provided as a Source Data file. e Comparison of motif significance in resting host and grafted cells. P-values were calculated using TBA models trained on intergenic peaks from host and grafted cells. Significant motifs that show a large difference (p < 10e−5, log-likelihood ratio > = 2) are indicated in blue points. Source data are provided as a Source Data file. f Heatmap of the significance of motifs in various myeloid cell types and host cells. The intensity of the color indicates greater significance (−log10 p-value) of each motif. Source data are provided as a Source Data file
Fig. 5
Fig. 5
Distinct LPS responses of engrafted macrophages and host microglia. a PC analysis of RNA seq data of graft and host microglia in steady state and 12 h post LPS. b Expression analysis of grafted cells and host microglia in steady state and 12 h post LPS by RNA seq. c Examples of genes expression of graft and host microglia in steady state and 12 h post LPS. Significance is indicated by the symbols (p-value < 0.05), or lack thereof (p-value>0.05). See Ccl6 plot (top right) for symbol to condition conversion. d Fold expression change of selected genes significantly different (absolute value of log2FC > 1, p-value < 0.05) following challenge in grafted cells (middle) or host microglia (right), as well as genes displaying comparable up- and downregulation in both engrafted cells and host microglia (left). Source data are provided as a Source Data file
Fig. 6
Fig. 6
Comparative epigenome analysis of graft and host microglia post LPS challenge. a Analysis of all 46,485 detected ATAC peaks, from which 552 peaks and 841 peaks displayed >4-fold significant (p-value < 0.01) enrichment in host microglia and engrafted cells isolated from challenged mice, respectively. b Comparison of motif significance in activated/challenged host and grafted cells. P-values were calculated using TBA models trained on intergenic ATAC-seq peaks from host and grafted cells. Significant motifs that show a large difference (p < 10e−5, log-likelihood ratio > = 2) are indicated in blue points. Motif logos visualizing the position frequency matrix of NF-kappaB and AP-1 motifs are annotated. c Challenge induced alterations in Marco locus. Normalized sequence reads of Marco mRNA in engrafted cells and host microglia isolated from LPS challenged and unchallenged BM chimeras (top); normalized ATACseq profiles of Marco locus (bottom), with enlarged areas highlighting induced ATACseq peaks and predicted motifs. d Challenge induced alterations in Spp1 locus. Normalized sequence reads of Spp1 mRNA in engrafted cells and host microglia isolated from LPS challenged and unchallenged BM chimeras (top); normalized ATACseq profiles of Spp1 locus (bottom), with enlarged areas highlighting induced ATACseq peaks and predicted motifs. Source data are provided as a Source Data file
Fig. 7
Fig. 7
Comparative protein expression analysis of graft and host microglia in mouse and human chimeras. a, b Expression of host microglia-specific markers TMEM119 (a) and P2RY12 (b) in the cortex of mice that received lineage-negative BM carrying the lentiviral construct conferring eBFP expression. Host microglia (green) and donor cells (white) are indicated with arrowheads. IBA-1 immunohistochemistry for microglia (red). DAPI nuclear counterstain (blue). Scale bars, 30 µm. c, d Representative images of cortical, hippocampal, and cerebellar sections from female patients that received male donor BM grafts carrying the Y-chromosome (Y-chr). Host microglia are indicated by solid arrowheads and donor cells are shown by open arrowheads. Immunohistochemistry (red) of IBA-1 (c) and P2RY12 (d) combined with in situ hybridization of Y-chr (brown). Insets show a single grafted cell at higher magnification. Scale bars, 30 µm

References

    1. Stremmel, C. et al. Yolk sac macrophage progenitors traffic to the embryo during defined stages of development. Nat. Commun.9, 75 (2018). - PMC - PubMed
    1. Ginhoux F, et al. Fate mapping analysis reveals that adult microglia derive from primitive macrophages. Science. 2010;330:841–845. doi: 10.1126/science.1194637. - DOI - PMC - PubMed
    1. Schulz C, et al. A lineage of myeloid cells independent of Myb and hematopoietic stem cells. Science. 2012;336:86–90. doi: 10.1126/science.1219179. - DOI - PubMed
    1. Varol C, Mildner A, Jung S. Macrophages: development and tissue specialization. Annu. Rev. Immunol. 2015;33:643–675. doi: 10.1146/annurev-immunol-032414-112220. - DOI - PubMed
    1. Guilliams M, Scott CL. Does niche competition determine the origin of tissue-resident macrophages? Nat. Publ. Group. 2017;17:451–460. - PubMed

Publication types

MeSH terms