. 2018 Dec 6;9(1):5214.
doi: 10.1038/s41467-018-07402-8.

An inflammatory-CCRK circuitry drives mTORC1-dependent metabolic and immunosuppressive reprogramming in obesity-associated hepatocellular carcinoma

Affiliations

An inflammatory-CCRK circuitry drives mTORC1-dependent metabolic and immunosuppressive reprogramming in obesity-associated hepatocellular carcinoma

Hanyong Sun et al. Nat Commun. .

Abstract

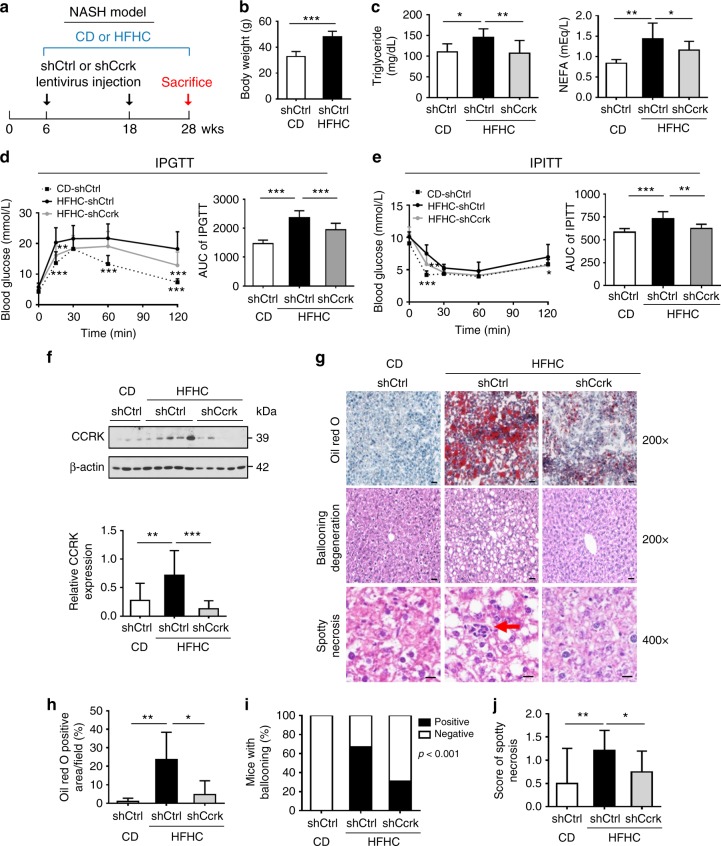
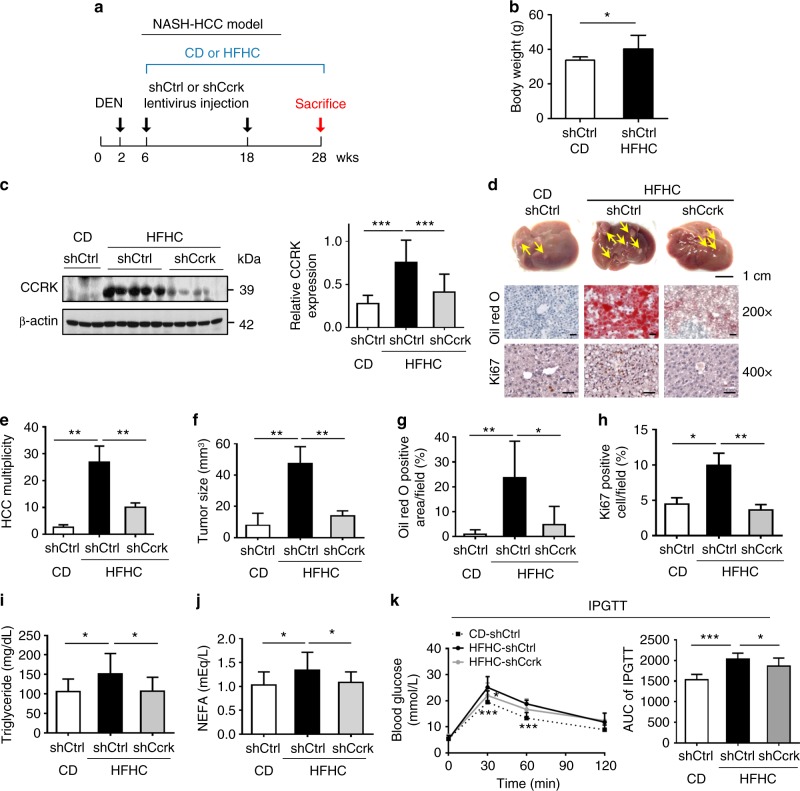
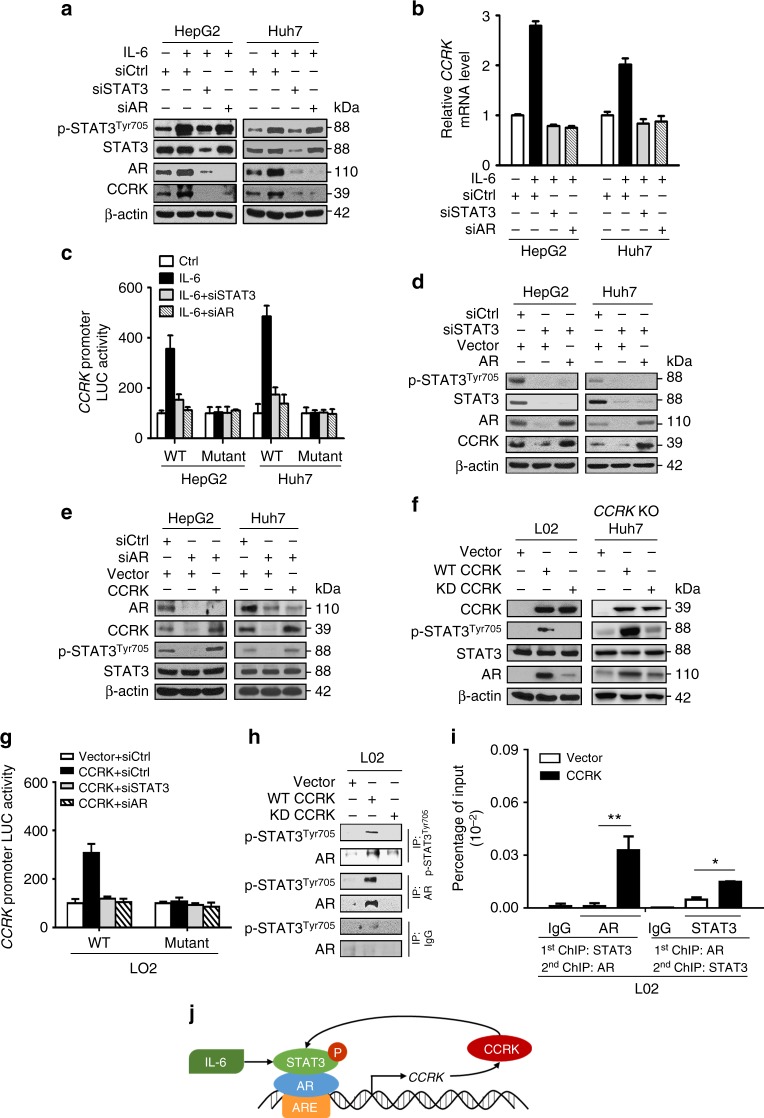
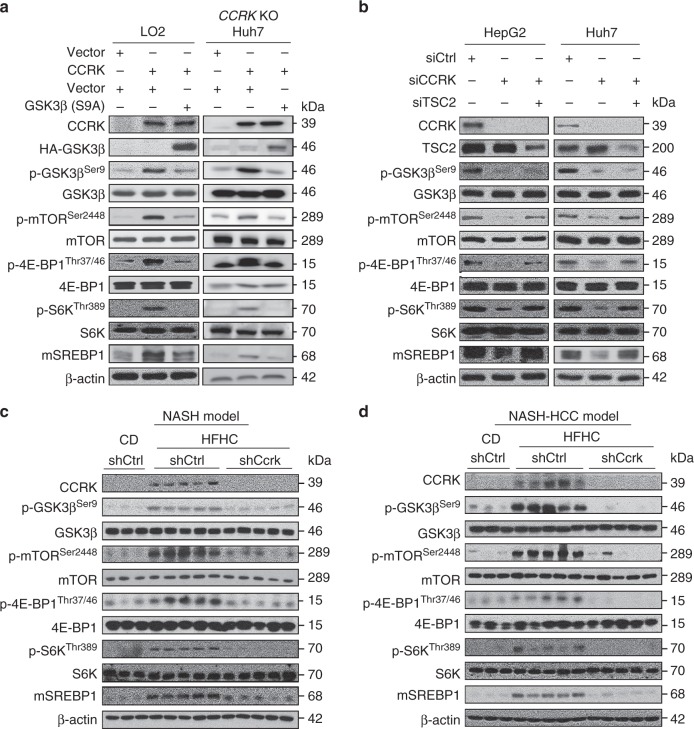
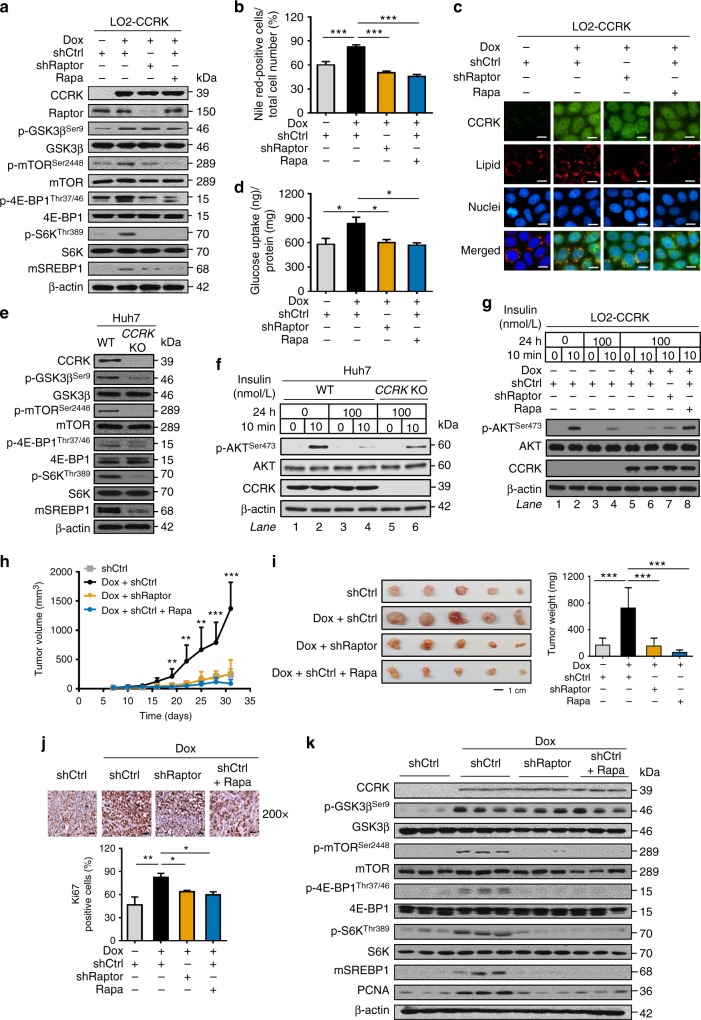
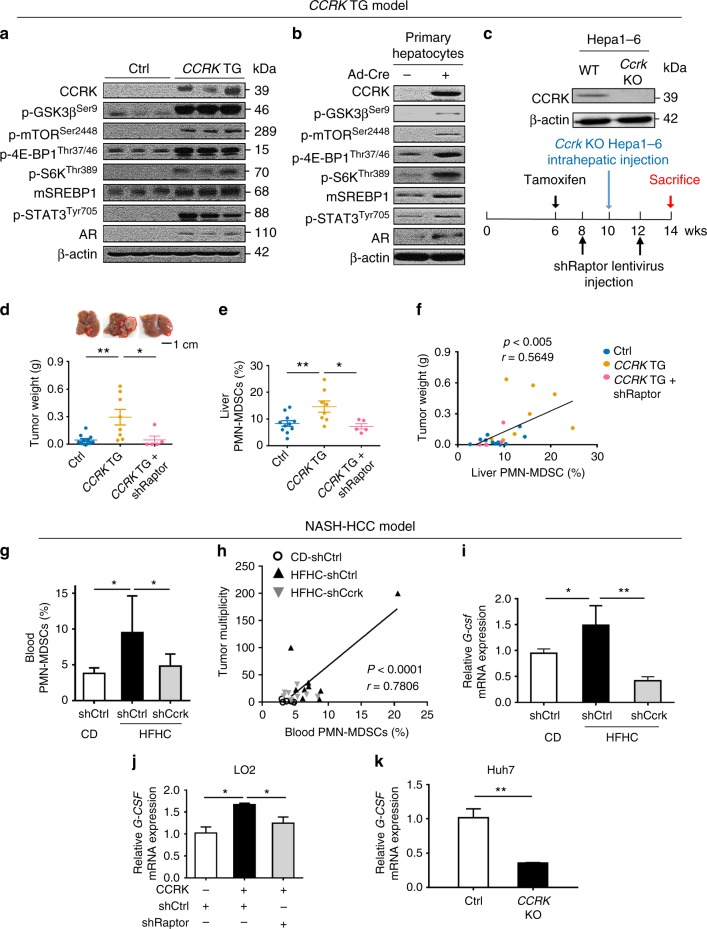
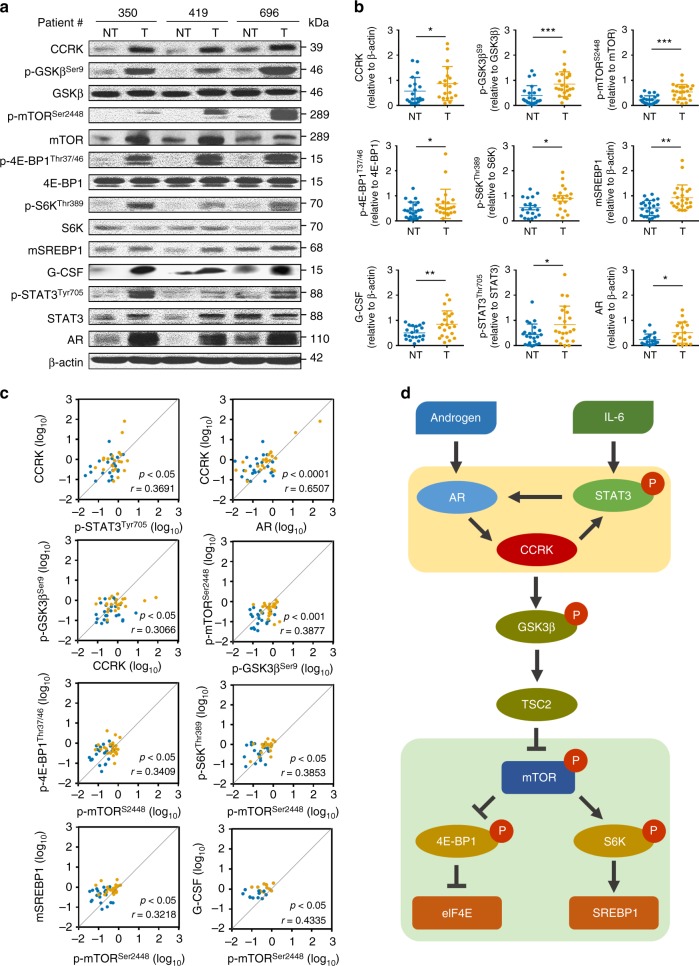
Obesity increases the risk of hepatocellular carcinoma (HCC) especially in men, but the molecular mechanism remains obscure. Here, we show that an androgen receptor (AR)-driven oncogene, cell cycle-related kinase (CCRK), collaborates with obesity-induced pro-inflammatory signaling to promote non-alcoholic steatohepatitis (NASH)-related hepatocarcinogenesis. Lentivirus-mediated Ccrk ablation in liver of male mice fed with high-fat high-carbohydrate diet abrogates not only obesity-associated lipid accumulation, glucose intolerance and insulin resistance, but also HCC development. Mechanistically, CCRK fuels a feedforward loop by inducing STAT3-AR promoter co-occupancy and transcriptional up-regulation, which in turn activates mTORC1/4E-BP1/S6K/SREBP1 cascades via GSK3β phosphorylation. Moreover, hepatic CCRK induction in transgenic mice stimulates mTORC1-dependent G-csf expression to enhance polymorphonuclear myeloid-derived suppressor cell recruitment and tumorigenicity. Finally, the STAT3-AR-CCRK-mTORC1 pathway components are concordantly over-expressed in human NASH-associated HCCs. These findings unveil the dual roles of an inflammatory-CCRK circuitry in driving metabolic and immunosuppressive reprogramming through mTORC1 activation, thereby establishing a pro-tumorigenic microenvironment for HCC development.


Conflict of interest statement

G.L.H.W. has served as an advisory committee member for Gilead Sciences, and as a speaker for Abbott, Abbvie, Bristol-Myers Squibb, Echosens, Furui, Gilead Sciences, Janssen and Roche. V.W.S.W. has served as an advisory board member for AbbVie, Allergan, Center for Outcomes Research in Liver Diseases, Gilead Sciences, Janssen, Perspectum Diagnostics and Pfizer; and received lecture fees from Bristol-Myers Squibb, Echosens, Gilead Sciences, and Merck. The remaining authors declare no competing interests.

Figures

Fig. 1
Fig. 1
Dietary obesity-induced CCRK over-expression promotes lipid accumulation, glucose intolerance, and liver damages in male mice. a Schematic diagram of NASH mouse model with different diets (CD chow diet, HFHC high-fat high-carbohydrate) and lentivirus-mediated Ccrk knockdown (CD+shCtrl, n=8; HFHC+shCtrl, n = 15; HFHC+shCcrk, n = 15). b Body weight, c blood triglyceride and non-esterified fatty acid (NEFA) levels in mice were increased by HFHC at 28 weeks, which could be reduced by Ccrk knockdown. d, e CCRK impaired insulin sensitivity in mice. d Intraperitoneal glucose tolerance test (IPGTT) and e intraperitoneal insulin tolerance test (IPITT) were performed on CD-fed and HFHC-fed mice, blood glucose was measured at indicated time points after glucose or insulin injection (left), and area under the curve (AUC) is shown in a bar chart (right). f CCRK protein expression was induced by HFHC in mouse livers, which could be reduced by shRNA-mediated knockdown. Quantification of CCRK protein levels (relative to β-actin) is shown in a bar chart (bottom). g Representative pictures of Oil Red O, ballooning degeneration, and spotty necrosis of liver tissues in different groups (image magnification = ×200 or ×400, scale bar = 20 μm). h, i Quantifications of Oil Red O, ballooning degeneration and j scoring of spotty necrosis showed increased lipid accumulation, ballooning and spotty necrosis in HFHC-fed mice, which were reduced by Ccrk knockdown. Data are presented as mean ± SD. *p < 0.05; **p < 0.01; and ***p < 0.001 as calculated by unpaired two-tailed Student’s t-test (b), one-way ANOVA followed by Bonferroni post-hoc test (cf, h, j), two-way ANOVA followed by Bonferroni post-hoc tests (d, e), and Chi-square test (i)
Fig. 2
Fig. 2
Knockdown of Ccrk improves glucose sensitivity, and reduces hepatic lipid accumulation and hepatocarcinogenesis. a Schematic diagram of NASH-HCC mouse model with carcinogen induction (DEN diethylnitrosamine), different diets, and lentivirus-mediated Ccrk knockdown (CD+shCtrl, n = 8; HFHC+shCtrl, n = 15; HFHC+shCcrk, n = 15). b Body weight of mice at 28 weeks. c CCRK protein expression in mouse livers were increased by HFHC at 28 weeks, which could be reduced by shRNA-mediated knockdown. Quantification of CCRK protein levels (relative to β-actin) is shown in a bar chart (right). d Representative pictures of dissected livers (scale bar = 1 cm), and Oil Red O and Ki67 staining of liver tissues in different groups (image magnification = ×200 or ×400, scale bar = 20 μm). e Tumor multiplicity and f tumor sizes were higher in the livers of HFHC-fed mice, which could be reduced by Ccrk knockdown. g, h Dietary obesity-induced CCRK increased lipid accumulation and cell proliferation, which could be abrogated by Ccrk knockdown as shown by Oil Red O staining and Ki67 staining in the livers. i, j Blood triglyceride and NEFA levels were elevated by dietary obesity-induced CCRK at 28 weeks, which could be reduced by Ccrk knockdown. k CCRK over-expression impaired insulin sensitivity in mice. IPGTT was performed on CD-fed and HFHC-fed mice, blood glucose was measured at indicated time points after glucose injection (left), and AUC is shown in a bar chart (right). Data are presented as mean ± SD. *p < 0.05; **p < 0.01; and ***p < 0.001 as calculated by unpaired two-tailed Student’s t-test (b), one-way ANOVA followed by Bonferroni post-hoc test (c, ek), and two-way ANOVA followed by Bonferroni post hoc test (k)
Fig. 3
Fig. 3
IL-6 activates STAT3 and AR signaling to stimulate CCRK expression. a Western blot and b qRT-PCR analysis of HepG2 and Huh7 cells treated with or without IL-6, combined with siRNA-mediated knockdown of STAT3 or AR. c Luciferase reporter assay was used to measure CCRK promotor activity in HepG2 and Huh7 cells expressing either WT or AR response element (ARE)-deleted mutant CCRK promoter, treated with or without IL-6, combined with siRNA-mediated knockdown of STAT3 or AR. d CCRK expression was blocked by knockdown of STAT3, but rescued by over-expression of AR. e STAT3 phosphorylation suppressed by AR knockdown could be rescued by over-expression of CCRK. f WT but not kinase-defective (KD) CCRK-induced STAT3 phosphorylation and AR expression. g CCRK induces its own promoter activity, which was abolished by deletion of ARE or knockdown of either STAT3 or AR in CCRK-expressing cells. h Co-immunoprecipitation of p-STAT3Tyr705 and AR in LO2 cells transfected with WT CCRK, but not in those transfected with empty vector or KD CCRK. IgG is a control for non-specific immunoprecipitation. i ChIP-re-ChIP assay demonstrated an increased co-occupancy of STAT3 and AR at the ARE of CCRK promotor in LO2 cells transfected with WT CCRK relative to those transfected with vector only. IgG is a control for non-specific immunoprecipitation. The antibodies used in the 1st and 2nd ChIP are as indicated. j Schematic representation of the IL-6/STAT3/AR/CCRK circuitry in hepatocarcinogenesis. Data are presented as mean ± SD. *p < 0.05 and **p < 0.01 as calculated by one-way ANOVA followed by Bonferroni post hoc test (i)
Fig. 4
Fig. 4
CCRK activates mTORC1 signaling through GSK3β/TSC2 cascade. a Ectopic CCRK expression in LO2 and CCRK KO Huh7 cells activates mTORC1 signaling, which was abrogated by suppression of GSK3β phosphorylation at Ser9 (p-GSK3βSer9) via over-expression of the constitutively-active S9A-GSK3β mutant. Western blot analysis was used to detect the protein expression of mTORC1 downstream molecules. b Knockdown of CCRK in HepG2 and Huh7 cells impaired the activation of mTORC1 signaling, which was rescued by the silencing of TSC2. c, d Dietary obesity-induced CCRK expression is responsible for the activation of mTORC1 signaling cascades in both c NASH and d NASH-HCC models, and such CCRK-dependent effects were abolished following knockdown of Ccrk. The establishment of NASH and NASH-HCC models are as described in Figs. 1a and 2a
Fig. 5
Fig. 5
Hepatic CCRK promotes lipid accumulation, glucose uptake, insulin resistance, and tumorigenicity through mTORC1 activation. a Doxycycline (Dox)-induced expression of CCRK-activated mTORC1 signaling pathway in LO2-CCRK cells, which was abolished by inhibition of mTOR via Raptor knockdown or treatment with Rapamycin (Rapa). b, c Lipid accumulation (image magnification =×400, scale bar = 20 μm) as well as d glucose uptake were increased by CCRK-mediated mTOR activation, but were reduced by mTORC1 inhibition. e mTORC1 signaling was suppressed in CCRK KO Huh7 cell line. f CCRK impaired insulin sensitivity in Huh7 cells, which was restored by CCRK KO. Insulin sensitivity was assessed by p-AktSer473 expression via Western blot analysis in cells treated with high dose of insulin followed by low dose of insulin stimulation. g The CCRK-induced insulin intolerance was restored by inhibition of mTORC1 using shRaptor or Rapamycin. h, i Mice injected with Dox-induced LO2-CCRK cells developed larger tumors (scale bar = 1 cm) compared to control mice and those treated with shRaptor or Rapamycin (n = 5 per group). j, k CCRK promoted tumorigenicity through mTORC1 activation. j The cell proliferation was assessed by Ki67 staining (scale bar = 20 μm). k The CCRK-activated mTORC1 signaling was detected by Western blot analysis. Data are presented as mean ± SD. *p < 0.05; **p < 0.01; and ***p < 0.001 as calculated by one-way ANOVA followed by Bonferroni post-hoc test (b, d, i, j), and two-way ANOVA followed by Bonferroni post-hoc test (h)
Fig. 6
Fig. 6
Hepatic CCRK-mTORC1 signaling recruits MDSCs to form a tumor-prone liver microenvironment. a mTORC1 signaling was activated in the livers of CCRK TG mice. The downstream molecules of mTORC1 signaling were detected by Western blot. b mTORC1 signaling components were activated in the primary hepatocytes isolated from CCRK TG mice. c Schematic diagram of CCRK TG mouse model with intrahepatic injection of Ccrk KO Hepa1–6 cells by CRISPR/Cas9, and lentiviral-mediated Raptor knockdown. d CCRK TG mice (n = 8) developed significantly larger tumors compared to controls (n = 11), which was abolished by down-regulation of Raptor (shRaptor; n = 5) (scale bar = 1 cm). e PMN-MDSCs were induced in CCRK TG mice, but were reduced after Raptor knockdown, and f PMN-MDSC levels positively correlated with tumor weight. g PMN-MDSCs were induced by HFHC diet, but were reduced by Ccrk knockdown in NASH-HCC model (CD+shCtrl, n = 8; HFHC+shCtrl, n = 15; HFHC+shCcrk, n = 15), wherein h PMN-MDSC levels positively correlated with tumor multiplicity. i G-csf mRNA levels were induced by HFHC diet, but were reduced by Ccrk knockdown in NASH-HCC model. j G-CSF mRNA level was augmented by CCRK over-expression in LO2 cells, which could be attenuated by Raptor knockdown. k G-CSF mRNA expression was down-regulated in CCRK KO Huh7 cells. Data are presented as mean ± SD. *p < 0.05 and **p < 0.01 as calculated by one-way ANOVA followed by Bonferroni post hoc test (d, e, g, i, j), Pearson correlation (f, h), and unpaired two-tailed Student’s t-test (k)
Fig. 7
Fig. 7
CCRK over-expression correlates with mTOR signaling activation in patients with NASH-associated HCCs. a Western blots showed the induced expressions of CCRK/mTOR signaling proteins in HCC tissues relative to matched non-tumor tissues (23 pairs), and representative results from three patients are shown. b The Western blot results of all patients from a were quantified and shown in dot plots, wherein the fold enrichments of target proteins relative to their corresponding controls are shown. c The positive correlations of STAT3/AR/CCRK/GSK3β/mTORC1 signaling components were confirmed in the patient specimens. d Schematic diagram showing the IL-6-triggered self-reinforcing circuitry of STAT3/AR/CCRK (highlighted in the yellow panel), which activates mTORC1 signaling (highlighted in the green panel) through GSK3β/TSC2 to promote NASH and HCC development. Data are presented as mean ± SD. *p < 0.05; **p < 0.01; ***p < 0.001 as calculated by unpaired two-tailed Student’s t-test (b), and Pearson correlation (c)

References

    1. Bhaskaran K, et al. Body-mass index and risk of 22 specific cancers: a population-based cohort study of 5.24 million UK adults. Lancet. 2014;384:755–765. doi: 10.1016/S0140-6736(14)60892-8. - DOI - PMC - PubMed
    1. Calle EE, Rodriguez C, Walker-Thurmond K, Thun MJ. Overweight, obesity, and mortality from cancer in a prospectively studied cohort of U.S. adults. N. Engl. J. Med. 2003;348:1625–1638. doi: 10.1056/NEJMoa021423. - DOI - PubMed
    1. Hagstrom H, Tynelius P, Rasmussen F. High BMI in late adolescence predicts future severe liver disease and hepatocellular carcinoma: a national, population-based cohort study in 1.2 million men. Gut. 2018;67:1536–1542. doi: 10.1136/gutjnl-2016-313622. - DOI - PubMed
    1. Starley BQ, Calcagno CJ, Harrison SA. Nonalcoholic fatty liver disease and hepatocellular carcinoma: a weighty connection. Hepatology. 2010;51:1820–1832. doi: 10.1002/hep.23594. - DOI - PubMed
    1. El-Serag HB. Epidemiology of viral hepatitis and hepatocellular carcinoma. Gastroenterology. 2012;142:1264–1273 e1261. doi: 10.1053/j.gastro.2011.12.061. - DOI - PMC - PubMed

Publication types

MeSH terms

Substances