. 2018 Dec 6;9(1):5217.
doi: 10.1038/s41467-018-07619-7.

Why rankings of biomedical image analysis competitions should be interpreted with care

Affiliations

Why rankings of biomedical image analysis competitions should be interpreted with care

Lena Maier-Hein et al. Nat Commun. .

Erratum in

  • Author Correction: Why rankings of biomedical image analysis competitions should be interpreted with care.
    Maier-Hein L, Eisenmann M, Reinke A, Onogur S, Stankovic M, Scholz P, Arbel T, Bogunovic H, Bradley AP, Carass A, Feldmann C, Frangi AF, Full PM, van Ginneken B, Hanbury A, Honauer K, Kozubek M, Landman BA, März K, Maier O, Maier-Hein K, Menze BH, Müller H, Neher PF, Niessen W, Rajpoot N, Sharp GC, Sirinukunwattana K, Speidel S, Stock C, Stoyanov D, Taha AA, van der Sommen F, Wang CW, Weber MA, Zheng G, Jannin P, Kopp-Schneider A. Maier-Hein L, et al. Nat Commun. 2019 Jan 30;10(1):588. doi: 10.1038/s41467-019-08563-w. Nat Commun. 2019. PMID: 30700735 Free PMC article.

Abstract

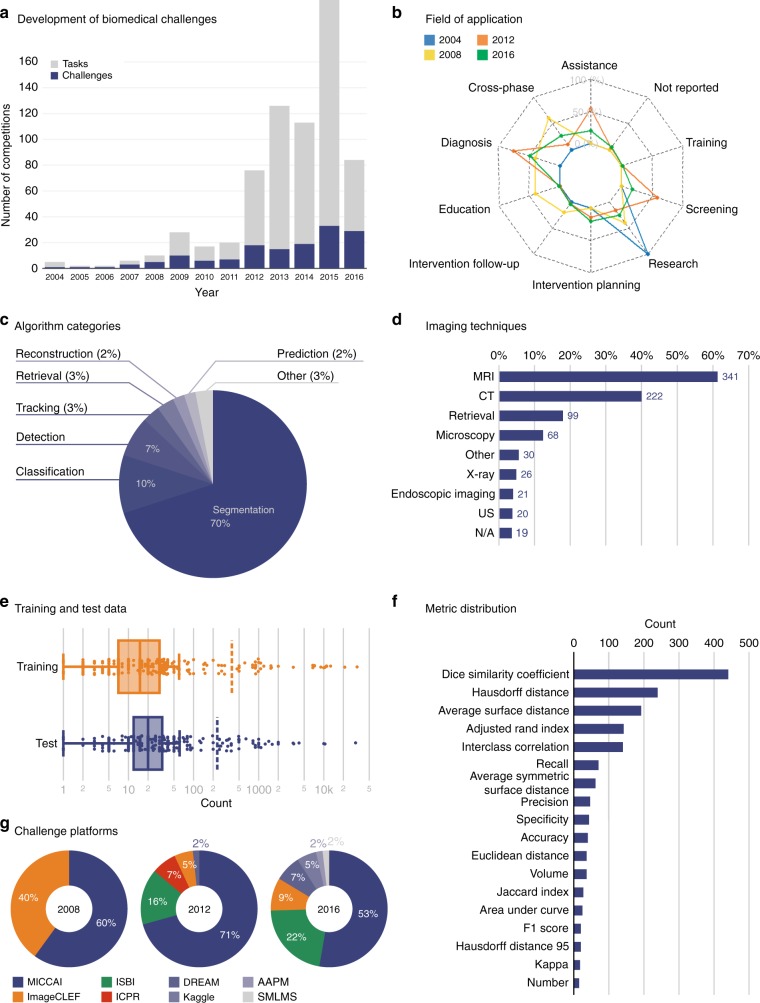
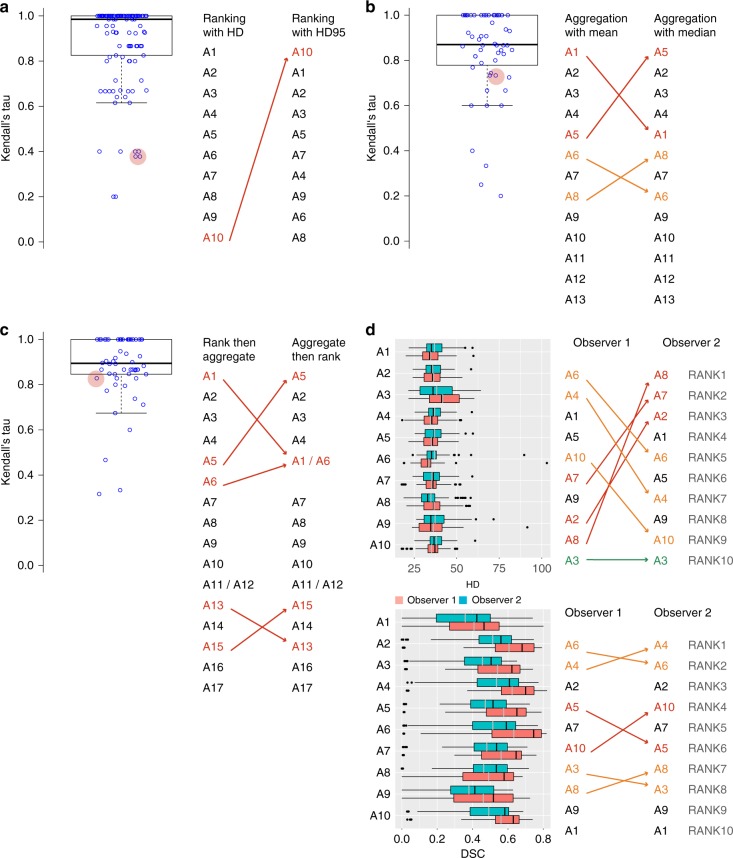
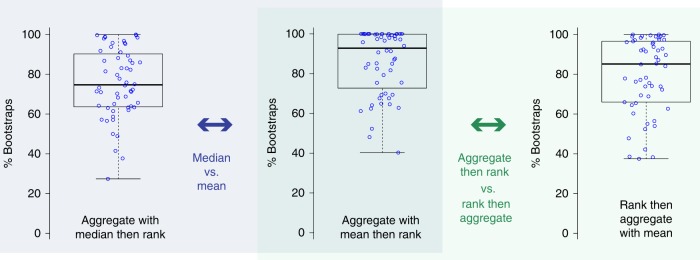
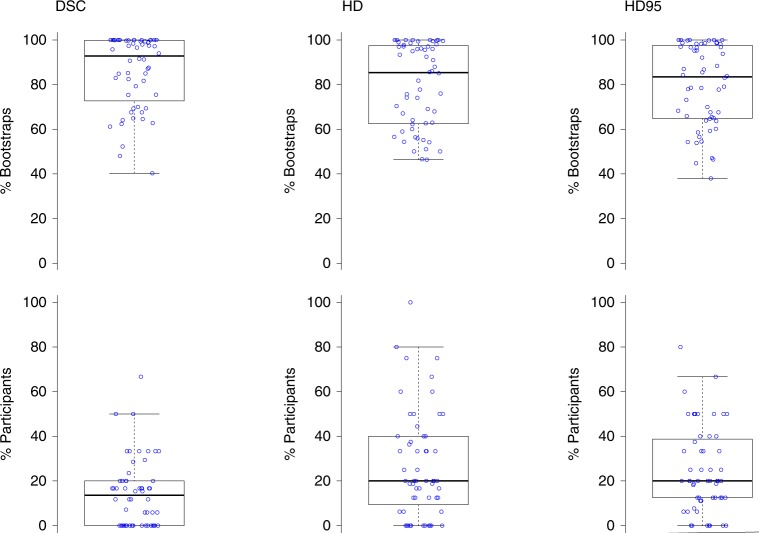
International challenges have become the standard for validation of biomedical image analysis methods. Given their scientific impact, it is surprising that a critical analysis of common practices related to the organization of challenges has not yet been performed. In this paper, we present a comprehensive analysis of biomedical image analysis challenges conducted up to now. We demonstrate the importance of challenges and show that the lack of quality control has critical consequences. First, reproducibility and interpretation of the results is often hampered as only a fraction of relevant information is typically provided. Second, the rank of an algorithm is generally not robust to a number of variables such as the test data used for validation, the ranking scheme applied and the observers that make the reference annotations. To overcome these problems, we recommend best practice guidelines and define open research questions to be addressed in the future.


Conflict of interest statement

Henning Müller is on the advisory board of “Zebra Medical Vision”. Danail Stoyanov is a paid part-time member of Touch Surgery, Kinosis Ltd. The remaining authors declare no competing interests.

Figures

Fig. 1
Fig. 1
Overview of biomedical image analysis challenges. a Number of competitions (challenges and tasks) organized per year, b fields of application, c algorithm categories assessed in the challenges, d imaging techniques applied, e number of training and test cases used, f most commonly applied metrics for performance assessment used in at least 5 tasks, and g platforms (e.g. conferences) used to organize the challenges for the years 2008, 2012, and 2016
Fig. 2
Fig. 2
Robustness of rankings with respect to several challenge design choices. One data point corresponds to one segmentation task organized in 2015 (n = 56). The center line in the boxplots shows the median, the lower, and upper border of the box represent the first and third quartile. The whiskers extend to the lowest value still within 1.5 interquartile range (IQR) of the first quartile, and the highest value still within 1.5 IQR of the third quartile. a Ranking (metric-based) with the standard Hausdorff Distance (HD) vs. its 95% variant (HD95). b Mean vs. median in metric-based ranking based on the HD. c Case-based (rank per case, then aggregate with mean) vs. metric-based (aggregate with mean, then rank) ranking in single-metric ranking based on the HD. d Metric values per algorithm and rankings for reference annotations performed by two different observers. In the box plots (ac), descriptive statistics for Kendall’s tau, which quantifies differences between rankings (1: identical ranking; −1: inverse ranking), is shown. Key examples (red circles) illustrate that slight changes in challenge design may lead to the worst algorithm (Ai: Algorithm i) becoming the winner (a) or to almost all teams changing their ranking position (d). Even for relatively high values of Kendall’s tau (b: tau = 0.74; c: tau = 0.85), critical changes in the ranking may occur
Fig. 3
Fig. 3
The ranking scheme is a deciding factor for the ranking robustness. The center line in the boxplots shows the median, the lower, and upper border of the box represent the first and third quartile. The whiskers extend to the lowest value still within 1.5 interquartile range (IQR) of the first quartile, and the highest value still within 1.5 IQR of the third quartile. According to bootstrapping experiments with 2015 segmentation challenge data, single-metric based rankings (those shown here are for the DSC) are significantly more robust when the mean rather than the median is used for aggregation (left) and when the ranking is performed after aggregation rather than before (right). One data point represents the robustness of one task, quantified by the percentage of simulations in bootstrapping experiments in which the winner remains the winner
Fig. 4
Fig. 4
Robustness of rankings with respect to the data used. Robustness of rankings with respect to the data used when a single-metric ranking scheme based on whether the Dice Similarity Coefficient (DSC) (left), the Hausdorff Distance (HD) (middle) or the 95% variant of the HD (right) is applied. One data point corresponds to one segmentation task organized in 2015 (n = 56). The center line in the boxplots shows the median, the lower, and upper border of the box represent the first and third quartile. The whiskers extend to the lowest value still within 1.5 interquartile range (IQR) of the first quartile, and the highest value still within 1.5 IQR of the third quartile. Metric-based aggregation with mean was performed in all experiments. Top: percentage of simulations in bootstrapping experiments in which the winner (according to the respective metric) remains the winner. Bottom: percentage of other participating teams that were ranked first in the simulations
Fig. 5
Fig. 5
Main results of the international questionnaire on biomedical challenges. Issues raised by the participants were related to the challenge data, the data annotation, the evaluation (including choice of metrics and ranking schemes) and the documentation of challenge results

References

    1. Ayache N, Duncan J. 20th anniversary of the medical image analysis journal (MedIA) Med. Image Anal. 2016;33:1–3. doi: 10.1016/j.media.2016.07.004. - DOI - PubMed
    1. Chen, W. Li, W. Dong, X. Pei, J. A review of biological image analysis. Curr. Bioinform. 13, 337–343 (2018).
    1. Price K. Anything you can do, I can do better (no you can’t) Comput. Gr. Image Process. 1986;36:387–391. doi: 10.1016/0734-189X(86)90083-6. - DOI
    1. West J, et al. Comparison and evaluation of retrospective intermodality brain image registration techniques. J. Comput. Assist. Tomogr. 1997;21:554–568. doi: 10.1097/00004728-199707000-00007. - DOI - PubMed
    1. Müller H, Rosset A, Vallée JP, Terrier F, Geissbuhler A. A reference data set for the evaluation of medical image retrieval systems. Comput. Med. Imaging Graph. 2004;28:295–305. doi: 10.1016/j.compmedimag.2004.04.005. - DOI - PubMed

Publication types

MeSH terms