. 2018 Dec 6;9(1):5229.
doi: 10.1038/s41467-018-07229-3.

Neural network analysis of sleep stages enables efficient diagnosis of narcolepsy

Affiliations

Neural network analysis of sleep stages enables efficient diagnosis of narcolepsy

Jens B Stephansen et al. Nat Commun. .

Abstract

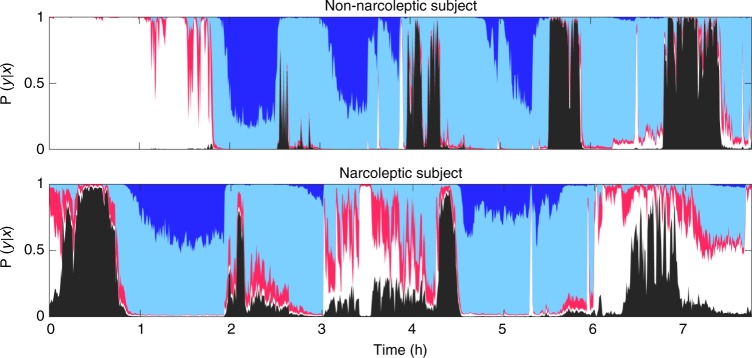
Analysis of sleep for the diagnosis of sleep disorders such as Type-1 Narcolepsy (T1N) currently requires visual inspection of polysomnography records by trained scoring technicians. Here, we used neural networks in approximately 3,000 normal and abnormal sleep recordings to automate sleep stage scoring, producing a hypnodensity graph-a probability distribution conveying more information than classical hypnograms. Accuracy of sleep stage scoring was validated in 70 subjects assessed by six scorers. The best model performed better than any individual scorer (87% versus consensus). It also reliably scores sleep down to 5 s instead of 30 s scoring epochs. A T1N marker based on unusual sleep stage overlaps achieved a specificity of 96% and a sensitivity of 91%, validated in independent datasets. Addition of HLA-DQB1*06:02 typing increased specificity to 99%. Our method can reduce time spent in sleep clinics and automates T1N diagnosis. It also opens the possibility of diagnosing T1N using home sleep studies.


Conflict of interest statement

E.M. has received Jazz Pharmaceuticals contract, clinical trial and gift funding as principal investigator at Stanford University. He also consulted for Idorsia and Merck, consulted or presented clinical trial results for Jazz Pharmaceuticals at congresses, this resulting in trip reimbursements and honoraria never exceeding 5000 dollars per year. G.P. has been on advisory boards for UCB, Jazz, Bioprojet and Idorsia. F.P. received a fee from UCB for speaking at a symposium, and a congress subscription from Bioprojet. The remaining authors declare no competing interests.

Figures

Fig. 1
Fig. 1
Accuracy per scorer and by time resolution. a The effect on scoring accuracy as golden standard is improved. Every combination of N scorers is evaluated in an unweighted manner and the mean is calculated. Accuracy is shown with mean (solid black line) and a 95% confidence interval (gray area). b Predictive performance of best model at different resolutions. Performance is shown as mean accuracy (solid black line) with a 95% confidence interval (gray area)
Fig. 2
Fig. 2
Hypnodensity example evaluated by multiple scorers and different predictive models. a The figure displays the hypnodensity graph. Displayed models are, in order: multiple scorer assessment (1); ensembles as described in Supplementary Table 8: All models, those with memory (LSTM) and those without memory (FF) (2–4); single models, as described in Supplementary Table 8 (5–7). OCT is octave encoding, Color codes: white, wake; red, N1; light blue, N2; dark blue, N3; black, REM. b The 150 epochs of a recording from the AASM ISR program are analyzed by 16 models with randomly varying parameters, using the CC/SH/LS/LSTM model as a template. These data were also evaluated by 5234 ± 14 different scorers. The distribution of these is shown on top, the average model predictions are shown in the middle, and the model variance is shown at the bottom
Fig. 3
Fig. 3
Examples of hypnodensity graph in subjects with and without narcolepsy. Hypnodensity, i.e., probability distribution per stage of sleep for a subject without narcolepsy (top) and a subject with narcolepsy (Bottom). Color codes: white, wake; red, N1; light blue, N2; dark blue, N3; black, REM
Fig. 4
Fig. 4
Diagnostic receiver operating characteristics curves. Diagnostic receiver operating characteristics (ROC) curves, displaying the trade-offs between sensitivity and specificity for our narcolepsy biomarker for a training sample, b testing sample, c replication sample and e high pretest sample. df Adding HLA to model vastly increases specificity. Cut-off thresholds are presented for models with (red dot) and without HLA (green dot)
Fig. 5
Fig. 5
Overall design of the study. a Pre-processing steps taken to achieve the format of data as it is used in the neural networks. One of the 5 channels is first high-pass filtered with a cut-off at 0.2 Hz, then low-pass filtered with a cut-off at 49 Hz followed by a re-sampling to 100 Hz to ensure data homogeneity. In the case of EEG signals, a channel selection is employed to choose the channel with the least noise. The data are then encoded using either the CC or the octave encoding. b Steps taken to produce and test the automatic scoring algorithm. A part of the SSC, and WSC, is randomly selected, as described in Supplementary Table 1. These data are then segmented in 5 min segments and scrambled with segments from other subjects to increase batch similarity during training. A neural network is then trained until convergence (evaluated using a separate validation sample). Once trained, the networks are tested on a separate part of the SSC and WSC along with data from the IS-RC and KHC, . c Steps taken to produce and test the narcolepsy detector. Hypnodensities are extracted from data, as described in Supplementary Table 1. These data are separated into a training (60%) and a testing (40%) split. From the training split, 481 potentially relevant features, as described in Supplementary Table 9, are extracted from each hypnodensity. The prominent features are maintained using a recursive selection algorithm, and from these features a GP classifier is created. From the testing split, the same relevant features are extracted, and the GP classifier is evaluated
Fig. 6
Fig. 6
Neural network strategy. a An example of the octave and the CC encoding on 10 s of EEG, EOG and EMG data. These processed data are fed into the neural networks in one of the two formats. The data in the octave encoding are offset for visualization purposes. Color scale is unitless. b Simplified network configuration, displaying how data are fed and processed through the networks. A more detailed description can be found in Supplementary Figure 3

References

    1. Krieger, A. C. Social and Economic Dimensions of Sleep Disorders, An Issue of Sleep Medicine Clinics (Elsevier, Philadelphia, PA, 2007).
    1. American Academy of Sleep Medicine. International Classification of Sleep Disorders, 3rd edn (American Academy of Sleep Medicine, Darien, IL, 2014).
    1. Peyron C, et al. A mutation in a case of early onset narcolepsy and a generalized absence of hypocretin peptides in human narcoleptic brains. Nat. Med. 2000;6:991–997. doi: 10.1038/79690. - DOI - PubMed
    1. Kornum BR, et al. Narcolepsy. Nat. Rev. Dis. Prim. 2017;3:16100. doi: 10.1038/nrdp.2016.100. - DOI - PubMed
    1. Han F, et al. HLA DQB1*06:02 negative narcolepsy with hypocretin/orexin deficiency. Sleep. 2014;37:1601–1608. doi: 10.5665/sleep.4066. - DOI - PMC - PubMed

Publication types