Multicenter Study
. 2018 Dec 6;9(1):5208.
doi: 10.1038/s41467-018-07635-7.

Metabolite changes in blood predict the onset of tuberculosis

Collaborators, Affiliations
Multicenter Study

Metabolite changes in blood predict the onset of tuberculosis

January Weiner 3rd et al. Nat Commun. .

Abstract

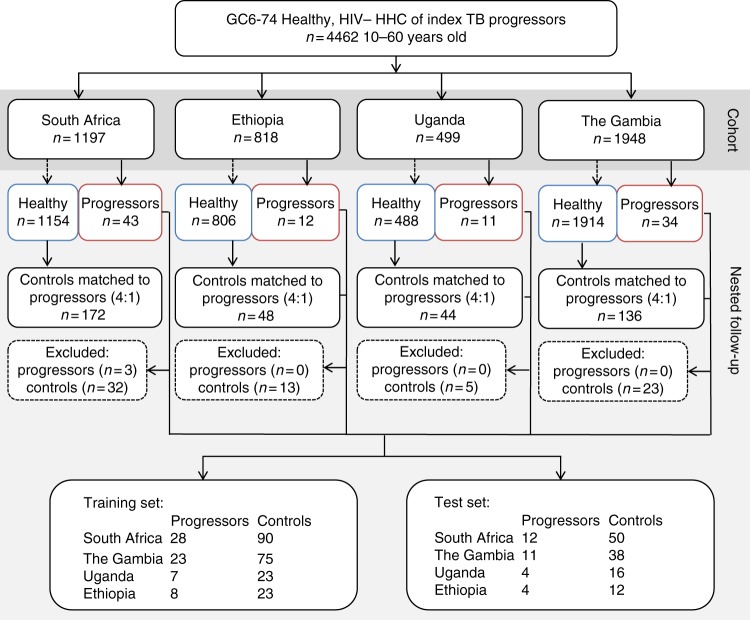
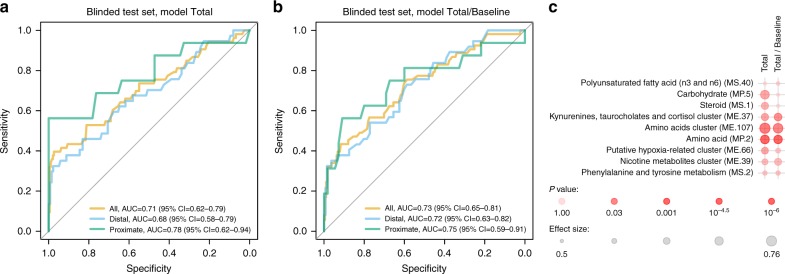
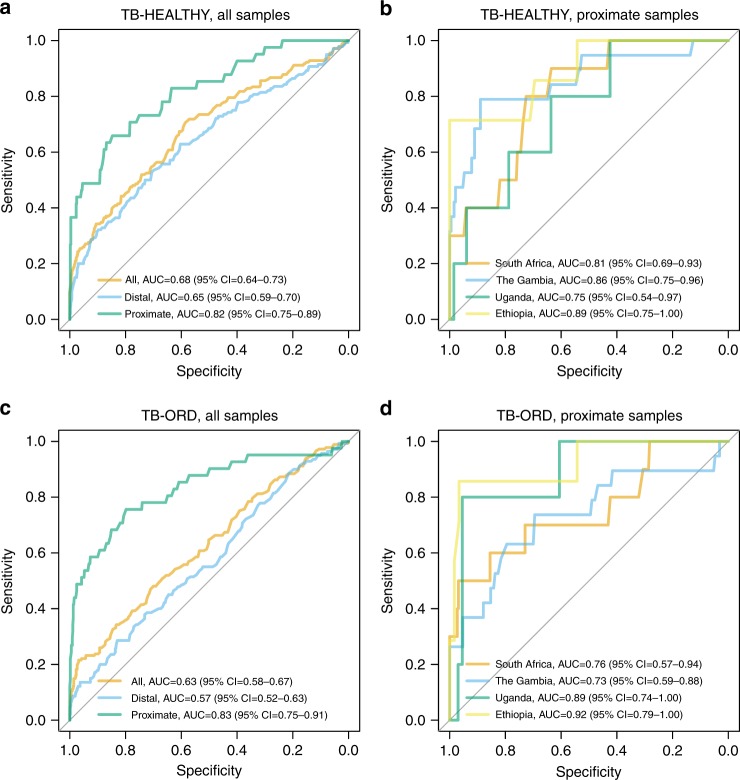
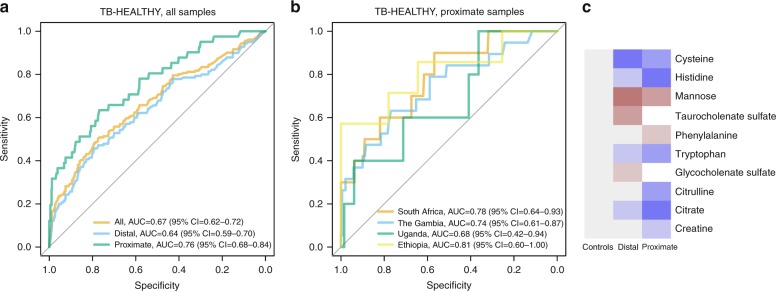
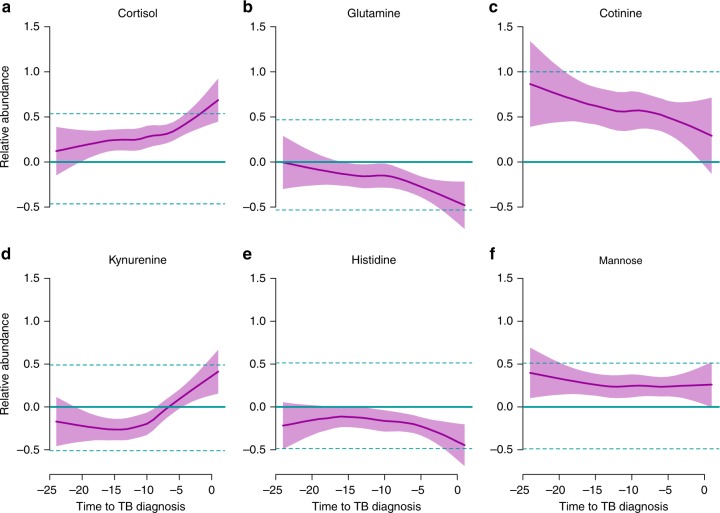
New biomarkers of tuberculosis (TB) risk and disease are critical for the urgently needed control of the ongoing TB pandemic. In a prospective multisite study across Subsaharan Africa, we analyzed metabolic profiles in serum and plasma from HIV-negative, TB-exposed individuals who either progressed to TB 3-24 months post-exposure (progressors) or remained healthy (controls). We generated a trans-African metabolic biosignature for TB, which identifies future progressors both on blinded test samples and in external data sets and shows a performance of 69% sensitivity at 75% specificity in samples within 5 months of diagnosis. These prognostic metabolic signatures are consistent with development of subclinical disease prior to manifestation of active TB. Metabolic changes associated with pre-symptomatic disease are observed as early as 12 months prior to TB diagnosis, thus enabling timely interventions to prevent disease progression and transmission.


Conflict of interest statement

The authors declare no competing interests.

Figures

Fig. 1
Fig. 1
Consort diagram for the study. The samples were collected at: SUN, Stellenbosch University, South Africa; MRC, Medical Research Council Unit, The Gambia; AHRI, Armauer Hansen Research Institute, Ethiopia; MAK, Makerere University, Uganda
Fig. 2
Fig. 2
Machine learning models (biosignatures) discriminating between progressors and controls. Panels show receiver–operator characteristic (ROC) curves. The three panels correspond to the three models tested: a, model Total which was generated using all training set samples; b, model Total/Baseline which was generated using only BL training set samples. Model evaluation was stratified by time to TB diagnosis: all, evaluation on all test set samples; proximate, evaluation on test set samples collected < 5 months before TB diagnosis; distal: ≥ 5 months. c Results of enrichment test on metabolites ordered by their importance in the Total and Total/Baseline models. The metabolite sets correspond to biochemical groups and clusters of metabolites identified previously in TB patients. Color intensity corresponds to p-value, and symbol size corresponds to the strength of the enrichment. P-values were corrected for multiple testing, and AUC was used as a measure of effect size
Fig. 3
Fig. 3
Predictive power of external metabolomic signature applied to the full GC6-74 data set. Panels a and b show the TB-HEALTHY model derived from the sera of TB patients and healthy individuals, while panels c and d show the TB-ORD (TB vs. other respiratory diseases) model derived from plasma samples of TB patients and from plasma samples of patients suffering from other respiratory diseases. Panels a and c show models applied either to all samples (all), or samples stratified by time to diagnosis (proximate and distal). Panels b and d show the results stratified by site
Fig. 4
Fig. 4
The trans-African signature based on TB-HEALTHY data set reduced to 10 metabolites. a performance of the model in the total, distal and proximate samples; b performance of the model for proximate samples at the four African sites; c list of metabolites included in the model and their relative abundance compared to controls. Colors correspond to scaled average abundances relative to the average in controls
Fig. 5
Fig. 5
Profiles of four selected metabolites revealing changes in abundances in progressors. a, b, d, e: disease-associated metabolites; c, f: risk-associated metabolites. Shaded area indicates 95% confidence intervals. Solid green line indicates median for controls and dashed green lines indicate first and third quartiles for controls

References

    1. World Health Organization. Global tuberculosis report 2018 (WHO, Geneva, 2018).
    1. Houben RM, Dodd PJ. The global burden of latent tuberculosis infection: a re-estimation using mathematical modelling. PLoS. Med. 2016;13:e1002152. doi: 10.1371/journal.pmed.1002152. - DOI - PMC - PubMed
    1. Andrews JR, et al. Risk of progression to active tuberculosis following reinfection with Mycobacterium tuberculosis. Clin. Infect. Dis. 2012;54:784–791. doi: 10.1093/cid/cir951. - DOI - PMC - PubMed
    1. Andrews JR, et al. The dynamics of QuantiFERON-TB gold in-tube conversion and reversion in a cohort of South African adolescents. Am. J. Respir. Crit. Care. Med. 2015;191:584–591. doi: 10.1164/rccm.201409-1704OC. - DOI - PMC - PubMed
    1. Smieja, M., Marchetti, C., Cook, D. & Smaill, F. M. Isoniazid for preventing tuberculosis in non-HIV infected persons. Cochrane Database Syst. Rev., 2, CD001363 (2000). - PMC - PubMed

Publication types