

Improving Quality, Reproducibility, and Usability of FRET-Based Tension Sensors
- PMID: 30523675
- PMCID: PMC6375766
- DOI: 10.1002/cyto.a.23688
Improving Quality, Reproducibility, and Usability of FRET-Based Tension Sensors
Abstract
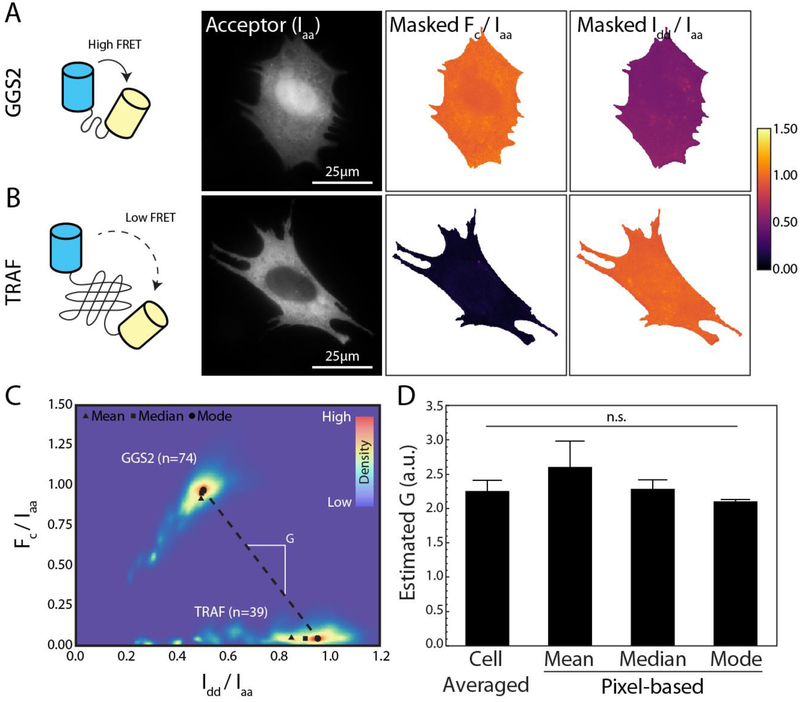
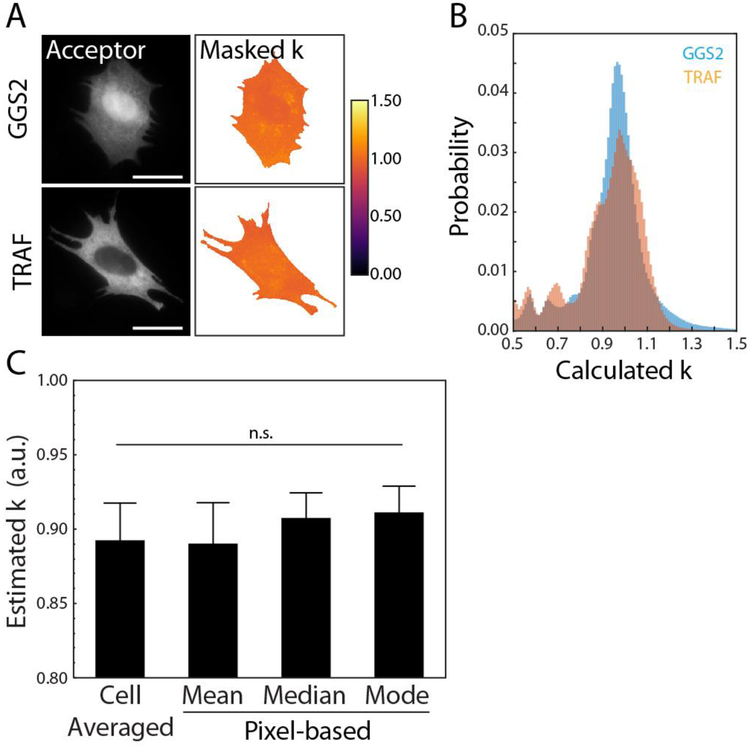
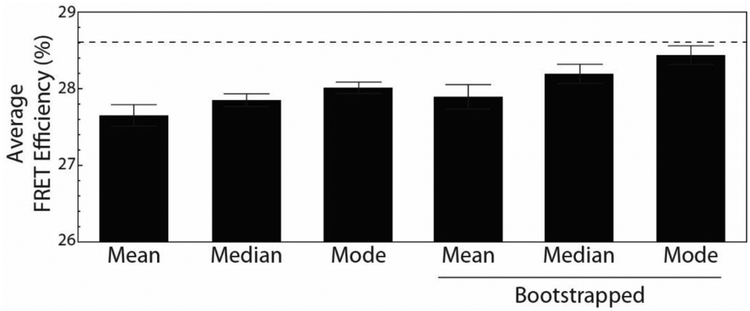
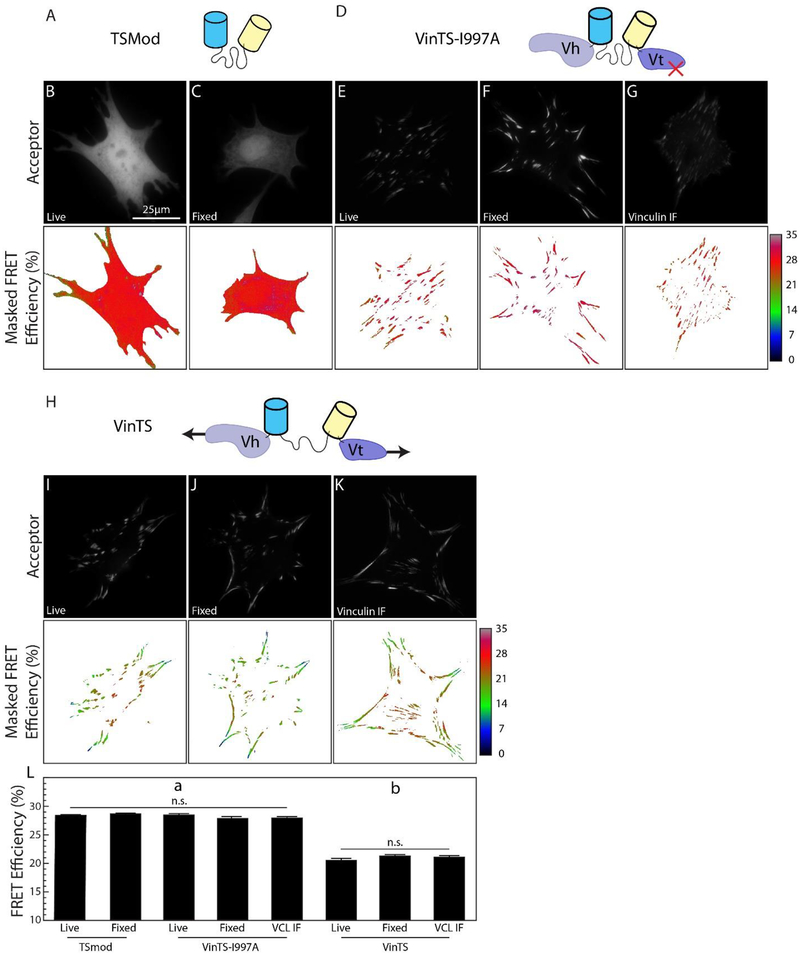
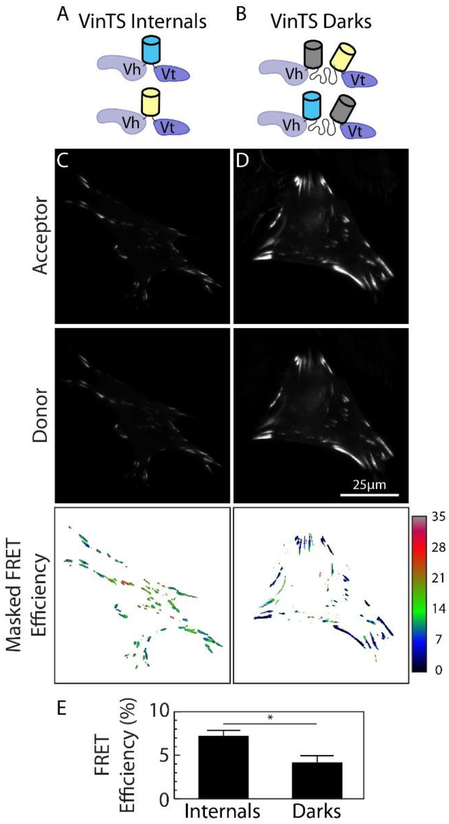
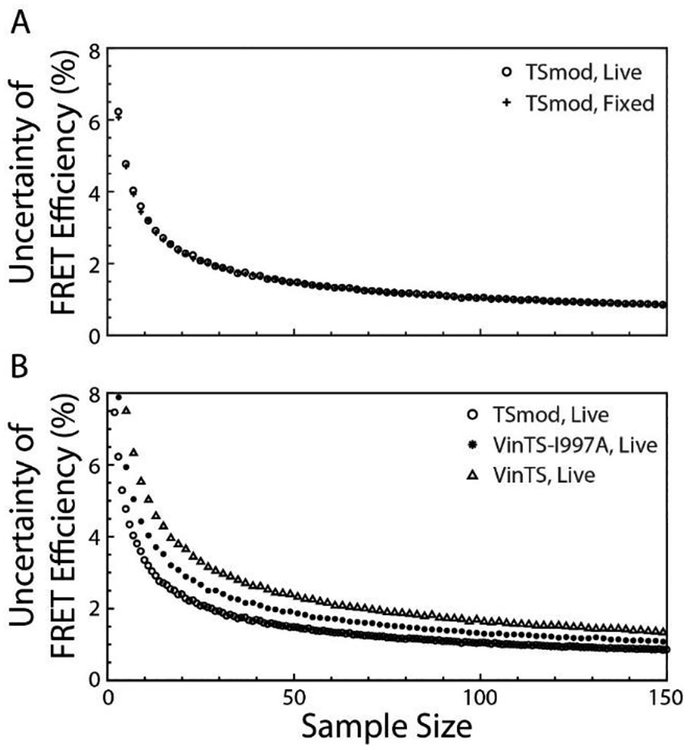
Mechanobiology, the study of how mechanical forces affect cellular behavior, is an emerging field of study that has garnered broad and significant interest. Researchers are currently seeking to better understand how mechanical signals are transmitted, detected, and integrated at a subcellular level. One tool for addressing these questions is a Förster resonance energy transfer (FRET)-based tension sensor, which enables the measurement of molecular-scale forces across proteins based on changes in emitted light. However, the reliability and reproducibility of measurements made with these sensors has not been thoroughly examined. To address these concerns, we developed numerical methods that improve the accuracy of measurements made using sensitized emission-based imaging. To establish that FRET-based tension sensors are versatile tools that provide consistent measurements, we used these methods, and demonstrated that a vinculin tension sensor is unperturbed by cell fixation, permeabilization, and immunolabeling. This suggests FRET-based tension sensors could be coupled with a variety of immuno-fluorescent labeling techniques. Additionally, as tension sensors are frequently employed in complex biological samples where large experimental repeats may be challenging, we examined how sample size affects the uncertainty of FRET measurements. In total, this work establishes guidelines to improve FRET-based tension sensor measurements, validate novel implementations of these sensors, and ensure that results are precise and reproducible. © 2018 International Society for Advancement of Cytometry.
Keywords: FRET efficiency; FRET-based biosensor; mechanotransduction; sensitized emission.
© 2018 International Society for Advancement of Cytometry.
Conflict of interest statement
Conflict of Interest:
The authors have no conflict of interest to declare.
Figures
Similar articles
-
Construction, imaging, and analysis of FRET-based tension sensors in living cells.Methods Cell Biol. 2015;125:161-86. doi: 10.1016/bs.mcb.2014.10.033. Epub 2015 Jan 8. Methods Cell Biol. 2015. PMID: 25640429 Free PMC article.
-
Genetically Encoded FRET-Based Tension Sensors.Curr Protoc Cell Biol. 2019 Jun;83(1):e85. doi: 10.1002/cpcb.85. Epub 2019 Mar 13. Curr Protoc Cell Biol. 2019. PMID: 30865383
-
Förster resonance energy transfer efficiency measurements on vinculin tension sensors at focal adhesions using a simple and cost-effective setup.J Biomed Opt. 2023 Aug;28(8):082808. doi: 10.1117/1.JBO.28.8.082808. Epub 2023 Jul 11. J Biomed Opt. 2023. PMID: 37441563 Free PMC article.
-
Recent Advances in Development of Genetically Encoded Fluorescent Sensors.Methods Enzymol. 2017;589:1-49. doi: 10.1016/bs.mie.2017.01.019. Epub 2017 Mar 9. Methods Enzymol. 2017. PMID: 28336060 Review.
-
Role of green fluorescent proteins and their variants in development of FRET-based sensors.J Biosci. 2018 Sep;43(4):763-784. J Biosci. 2018. PMID: 30207321 Review.
Cited by
-
FRET efficiency measurement in a molecular tension probe with a low-cost frequency-domain fluorescence lifetime imaging microscope.J Biomed Opt. 2019 Dec;24(12):1-11. doi: 10.1117/1.JBO.24.12.126501. J Biomed Opt. 2019. PMID: 31884745 Free PMC article.
-
Förster resonance energy transfer efficiency of the vinculin tension sensor in cultured primary cortical neuronal growth cones.Neurophotonics. 2022 Apr;9(2):025002. doi: 10.1117/1.NPh.9.2.025002. Epub 2022 May 30. Neurophotonics. 2022. PMID: 35651869 Free PMC article.
-
Contractile force assessment methods for in vitro skeletal muscle tissues.Elife. 2022 May 23;11:e77204. doi: 10.7554/eLife.77204. Elife. 2022. PMID: 35604384 Free PMC article. Review.
-
Visualizing the Invisible: Advanced Optical Microscopy as a Tool to Measure Biomechanical Forces.Front Cell Dev Biol. 2021 Sep 6;9:706126. doi: 10.3389/fcell.2021.706126. eCollection 2021. Front Cell Dev Biol. 2021. PMID: 34552926 Free PMC article. Review.
-
TRIP6 is required for tension at adherens junctions.J Cell Sci. 2021 Mar 11;134(6):jcs247866. doi: 10.1242/jcs.247866. J Cell Sci. 2021. PMID: 33558314 Free PMC article.
References
-
- Han MKL & de Rooij J (2016) Converging and Unique Mechanisms of Mechanotransduction At Adhesion Sites. Trends Cell Biol 26(8):612–623. - PubMed
Publication types
MeSH terms
Substances
Grants and funding
LinkOut - more resources
Full Text Sources
Research Materials
