. 2019 Jan 20;37(3):202-212.
doi: 10.1200/JCO.18.01314. Epub 2018 Dec 3.

Molecular High-Grade B-Cell Lymphoma: Defining a Poor-Risk Group That Requires Different Approaches to Therapy

Affiliations

Molecular High-Grade B-Cell Lymphoma: Defining a Poor-Risk Group That Requires Different Approaches to Therapy

Chulin Sha et al. J Clin Oncol. .

Erratum in

  • Erratum.
    [No authors listed] [No authors listed] J Clin Oncol. 2019 Apr 20;37(12):1035. doi: 10.1200/JCO.19.00581. J Clin Oncol. 2019. PMID: 30995418 Free PMC article. No abstract available.

Abstract

Purpose: Biologic heterogeneity is a feature of diffuse large B-cell lymphoma (DLBCL), and the existence of a subgroup with poor prognosis and phenotypic proximity to Burkitt lymphoma is well known. Conventional cytogenetics identifies some patients with rearrangements of MYC and BCL2 and/or BCL6 (double-hit lymphomas) who are increasingly treated with more intensive chemotherapy, but a more biologically coherent and clinically useful definition of this group is required.

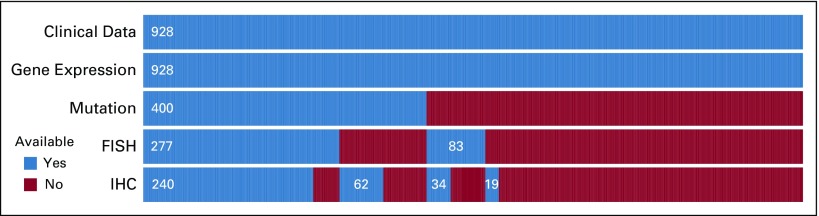
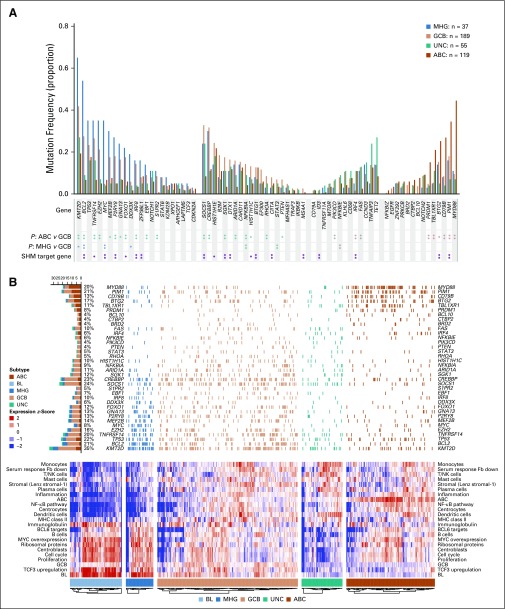
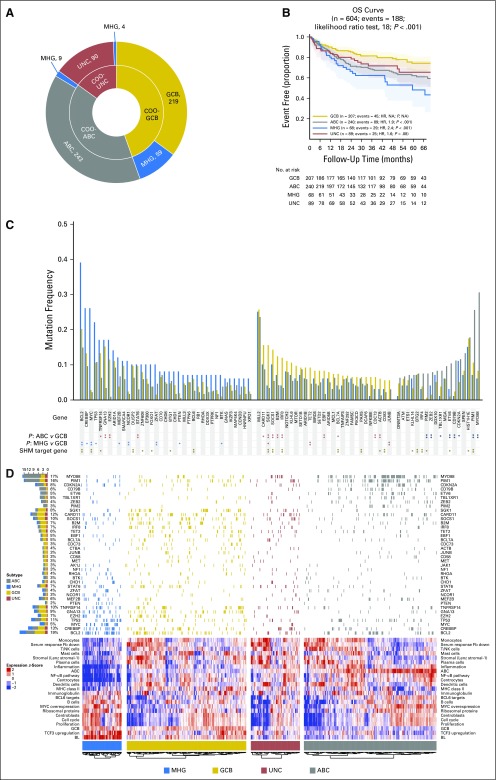
Patients and methods: We defined a molecular high-grade (MHG) group by applying a gene expression-based classifier to 928 patients with DLBCL from a clinical trial that investigated the addition of bortezomib to standard rituximab plus cyclophosphamide, doxorubicin, vincristine, and prednisone (R-CHOP) therapy. The prognostic significance of MHG was compared with existing biomarkers. We performed targeted sequencing of 70 genes in 400 patients and explored molecular pathology using gene expression signature databases. Findings were validated in an independent data set.

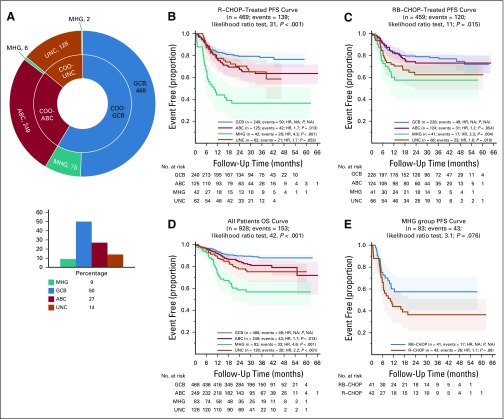
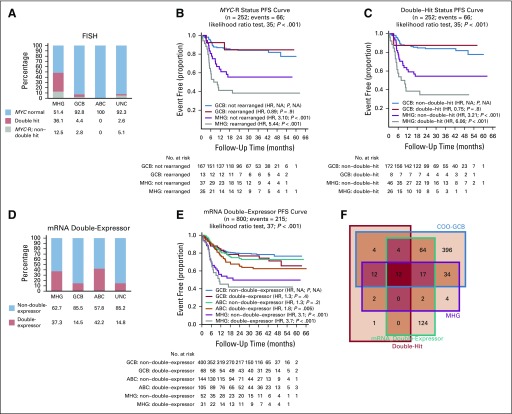
Results: The MHG group comprised 83 patients (9%), with 75 in the cell-of-origin germinal center B-cell-like group. MYC rearranged and double-hit groups were strongly over-represented in MHG but comprised only one half of the total. Gene expression analysis revealed a proliferative phenotype with a relationship to centroblasts. Progression-free survival rate at 36 months after R-CHOP in the MHG group was 37% (95% CI, 24% to 55%) compared with 72% (95% CI, 68% to 77%) for others, and an analysis of treatment effects suggested a possible positive effect of bortezomib. Double-hit lymphomas lacking the MHG signature showed no evidence of worse outcome than other germinal center B-cell-like cases.

Conclusion: MHG defines a biologically coherent high-grade B-cell lymphoma group with distinct molecular features and clinical outcomes that effectively doubles the size of the poor-prognosis, double-hit group. Patients with MHG may benefit from intensified chemotherapy or novel targeted therapies.


Figures

FIG 1.
FIG 1.
Data set summary. The analysis included 928 patients from the Randomized Evaluation of Molecular-Guided Therapy for Diffuse Large B-Cell Lymphoma With Bortezomib (REMoDL-B) clinical trial. All had full clinical data (diagnostic variables, treatment, treatment response, progression status, and follow-up time) and whole-genome expression profiling assayed by the DASL version 4 array (Illumina, San Diego, CA). A subset of 400 patients was analyzed for somatic mutations with a targeted 70-gene panel. In addition, 360 patients were tested for MYC, BCL2, and BCL6 rearrangements by fluorescent in situ hybridization (FISH), and 355 patients were tested for MYC and BCL2 protein expression with immunohistochemistry (IHC).
FIG 2.
FIG 2.
Retrospective Randomized Evaluation of Molecular-Guided Therapy for Diffuse Large B-Cell Lymphoma With Bortezomib (REMoDL-B) trial analysis with the molecular high-grade (MHG) group. (A) Number of REMoDL-B patients with standard cell-of-origin (COO) classification (inner circle) and with MHG patients separated into a new class (outer circle). For the latter, the overall distribution between classes is shown in the histogram. (B) Progression-free survival (PFS) curves for rituximab plus cyclophosphamide, doxorubicin, vincristine, and prednisone (R-CHOP)–treated patients by classification, with MHG as a separate class. (C) As in (B) but for patients treated with R-CHOP with the proteasome inhibitor bortezomib (RB-CHOP). (D) As in (B), but overall survival (OS) for all patients. (E) Progression-free survival for MHG patients separated by treatment. P values given for overall difference in survival are from the likelihood ratio test and for individual groups with reference to the best-surviving group from a Cox proportional hazards regression model. ABC, activated B-cell-like; GCB, germinal center B-cell-like; HR, hazard ratio; NA, not applicable; UNC, unclassified.
FIG 3.
FIG 3.
Molecular characteristics of the molecular high-grade (MHG) group. (A) Mutation frequencies for 400 Randomized Evaluation of Molecular-Guided Therapy for Diffuse Large B-Cell Lymphoma With Bortezomib (REMoDL-B) patients in MHG, germinal center B-cell-like (GCB), unclassified (UNC), and activated B-cell-like (ABC) subgroups for the 70-gene panel (statistical significance of differences at P < .05 [single asterisks]) and P < .01 [double asterisks] by Fisher’s exact test). Known (double asterisks) and predicted (single asterisks) aberrant somatic hypermutation (SHM) target genes from Schmitz et al. (B) Heat map of gene expression signatures (bottom) and associated mutations (top; limited to genes with mutation frequency > 5% in at least one group and significantly different [P < .05] between any two groups of MHG, GCB, and ABC). The heat map shows the mean gene expression level (red = high to blue = low) over genes in the chosen signature cluster representative and is augmented in 70 patients with Burkitt lymphoma (BL) for comparison of gene expression patterns. The left-side bar chart (top) recapitulates the incidence of the corresponding mutations and their distribution among subgroups. Fb, fibroblast; NA, not applicable; NF-κB, nuclear factor kappa-light-chain-enhancer of activated B cell; NK, natural killer cell.
FIG 4.
FIG 4.
Molecular high-grade (MHG) group in relation to MYC rearrangement (MYC-R), double-hit, and double-expressor biomarkers. (A) The proportion of MYC-R, double-hit (MYC-R as well as BCL2 and/or BCL6 rearranged), and normal in each class as a percentage of those for which fluorescent in situ hybridization (FISH) data were produced. (B) Progression-free survival (PFS) by dividing MHG and germinal center B-cell-like (GCB) classes according to MYC-R status. (C) as in (B) by dividing according to double-hit status. (D) The percentage of mRNA double-expressor and normal status in each class. (E) PFS by dividing MHG, GCB, and activated B-cell-like (ABC) classes by double-expressor (mRNA) status. (F) Venn diagram showing overlaps among GCB, MHG, double-hit, and double-expressor groups (note that here, cell of origin [COO]-GCB is the original classification that includes patients with MHG and that some outside the double-hit category have not been tested for double-hit status). P values given for overall difference in PFS are from the likelihood ratio test and for individual groups with reference to best-surviving (GCB) group from a Cox proportional hazards regression model. HR, hazard ratio; NA, not applicable; UNC, unclassified.
FIG 5.
FIG 5.
Validation of the molecular high-grade (MHG) group in an external data set. (A) Number of patients in each group, cell-of-origin (COO) classification (inner circle), and MHG classification of patients separated into a new group (outer circle). (B) Overall survival (OS) curves by group. (C) Mutation frequencies by group (statistical significance of differences at P < .05 [single asterisks] and P < 0.01 [double asterisks] by Fisher’s exact test). Known (double asterisks) and predicted (single asterisks) aberrant somatic hypermutation (SMH) target genes from Schmitz et al. (D) Gene expression signature heat map (bottom using the same signatures as Fig 3B) and mutations (top; limited to genes with mutation frequency > 5% in at least one group and significantly different [P < .05] between any two groups of MHG, germinal center B-cell-like [GCB], and activated B-cell-like [ABC]) for the patients analyzed. The heat map shows the mean gene expression level (red = high to blue = low) over genes in the chosen signature cluster representative. The left-sidebar chart (top) recapitulates the incidence of the corresponding mutations and their distribution among subgroups. BL, Burkitt lymphoma; Fb, fibroblast; HR, hazard ratio; NF-κB, nuclear factor kappa-light-chain-enhancer of activated B cell; NK, natural killer; UNC, unclassified.

Comment in

References

    1. Smith A, Crouch S, Lax S, et al. Lymphoma incidence, survival and prevalence 2004-2014: Sub-type analyses from the UK’s Haematological Malignancy Research Network. Br J Cancer. 2015;112:1575–1584. - PMC - PubMed
    1. Alizadeh AA, Eisen MB, Davis RE, et al. Distinct types of diffuse large B-cell lymphoma identified by gene expression profiling. Nature. 2000;403:503–511. - PubMed
    1. Intlekofer AM, Younes A. Precision therapy for lymphoma--current state and future directions. Nat Rev Clin Oncol. 2014;11:585–596. - PubMed
    1. Reddy A, Zhang J, Davis NS, et al: Genetic and functional drivers of diffuse large B cell lymphoma. Cell 171:481-494.e15, 2017. - PMC - PubMed
    1. Chapuy B, Stewart C, Dunford AJ, et al. Molecular subtypes of diffuse large B cell lymphoma are associated with distinct pathogenic mechanisms and outcomes. Nat Med. 2018;24:679–690. - PMC - PubMed

Publication types

MeSH terms