. 2018 Dec 21;64(1):015011.
doi: 10.1088/1361-6560/aaf44b.

Tumor co-segmentation in PET/CT using multi-modality fully convolutional neural network

Affiliations

Tumor co-segmentation in PET/CT using multi-modality fully convolutional neural network

Xiangming Zhao et al. Phys Med Biol. .

Abstract

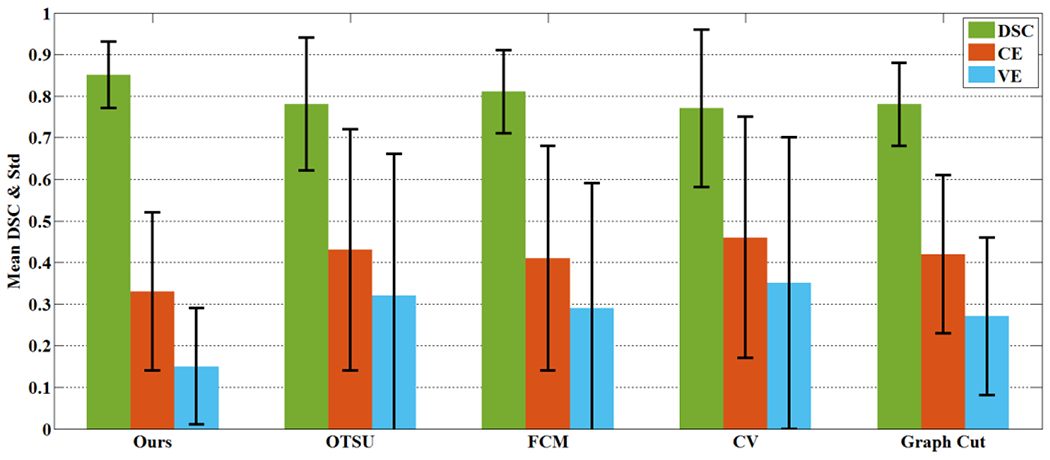
Automatic tumor segmentation from medical images is an important step for computer-aided cancer diagnosis and treatment. Recently, deep learning has been successfully applied to this task, leading to state-of-the-art performance. However, most of existing deep learning segmentation methods only work for a single imaging modality. PET/CT scanner is nowadays widely used in the clinic, and is able to provide both metabolic information and anatomical information through integrating PET and CT into the same utility. In this study, we proposed a novel multi-modality segmentation method based on a 3D fully convolutional neural network (FCN), which is capable of taking account of both PET and CT information simultaneously for tumor segmentation. The network started with a multi-task training module, in which two parallel sub-segmentation architectures constructed using deep convolutional neural networks (CNNs) were designed to automatically extract feature maps from PET and CT respectively. A feature fusion module was subsequently designed based on cascaded convolutional blocks, which re-extracted features from PET/CT feature maps using a weighted cross entropy minimization strategy. The tumor mask was obtained as the output at the end of the network using a softmax function. The effectiveness of the proposed method was validated on a clinic PET/CT dataset of 84 patients with lung cancer. The results demonstrated that the proposed network was effective, fast and robust and achieved significantly performance gain over CNN-based methods and traditional methods using PET or CT only, two V-net based co-segmentation methods, two variational co-segmentation methods based on fuzzy set theory and a deep learning co-segmentation method using W-net.


Figures

Fig. 1.
Fig. 1.
PET-CT image pairs. (a) CT image, and (b) its paired PET image, for one patient with lung cancer; (c) CT image, and (d) its paired PET image, for another patient with lung cancer. Both patients were imaged using an integrated PET/CT scanner (Reveal HD, CTI, Knoxville, TN, USA). The pink contours are the tumor boundaries.
Fig. 2.
Fig. 2.
Illustration of the multi-task learning: (a) the common form, and (b) the proposed form.
Fig. 3.
Fig. 3.
The architecture of the proposed co-segmentation network. Two parallel branches are used for feature extraction from the CT image and the PET image respectively, followed by the feature fusion part. The segmentation result is the output at the end of the network. x(1) and x(2) are the inputs of the two modalities (PET and CT), respectively. W, H and C are the sizes in the x, y and z directions of the input image, respectively. (1), (2) and fusion are the loss funcitons of the CT-segmentation branch, PET-segmentation branch, and the feature fusion part, respectively. These loss functions will be defined later.
Fig. 4.
Fig. 4.
V-Net style architecture which forms one branch in the first part. The 3D CT or PET images(x(1) or x(2)) of arbitrary sizes were fed into the net. Feature maps (h(1) or h(2)) which have the same spatial size as the input image are the outputs at the end of the network.
Fig. 5.
Fig. 5.
Fusion network of the proposed multi-modality FCN. Features extracted from the first part were fed to the stage, the tumor mask was the output at the end of the network.
Fig. 6.
Fig. 6.
Input patches. (a) A input patch which does not contain the whole tumor (pink contour), and (b) a input patch which contains the whole tumor (pink contour) and other tissues or organs near the tumor (green contour).
Fig. 7.
Fig. 7.
Feature visualization. (a) One slice of the feature map from the PET-segmentation branch. The part in the green contour has low feature values indicating a low probability for this part to be classified as part of the tumor; (b) one slice of the feature map from the CT-segmentation branch. The surrounding tissue in the green contour has high feature values indicating a high probability for this part to be classified as tumor incorrectly, and (c) one slice of the fused features re-extracted by the fusion network. The pink contour denotes the ground truth boundary of the tumor.
Fig. 8.
Fig. 8.
The mean and standard deviation of DSC, CE and VE, on the 36 testing samples, by the proposed method, the CNN-based methods using CT only or PET only.
Fig. 9.
Fig. 9.
Visual comparison of the segmentation results (blue contour) of different methods and the ground truth (pink contour) for three patients. (a)-(c) Segmentation results of the CNN-based method using CT only on the three patients, and (d)-(f) segmentation results of the CNN-based method using PET only on the three patients, and (g)-(i) segmentation reuslts of the proposed co-segmentation method on the three patients.
Fig. 10.
Fig. 10.
Performance comparison with the CNN-based methods using PET or CT only. (a) DSC, and (b) VE, all on the 36 testing samples. The proposed method (green) had a better performance and was more robust than the other two methods using CT (orange) or PET (blue) only. The two CNN-based methods using CT (orange) or PET (blue) only totally failed for several patients (e.g, patients 10, 17, 34), while the proposed had still decent performance for these patients.
Fig. 10.
Fig. 10.
Performance comparison with the CNN-based methods using PET or CT only. (a) DSC, and (b) VE, all on the 36 testing samples. The proposed method (green) had a better performance and was more robust than the other two methods using CT (orange) or PET (blue) only. The two CNN-based methods using CT (orange) or PET (blue) only totally failed for several patients (e.g, patients 10, 17, 34), while the proposed had still decent performance for these patients.
Fig. 11.
Fig. 11.
Performance comparison with the traditional methods using PET only. (a) DSC, and (b) VE, all on 36 testing samples. The proposed method (green) had a better performance and was more robust than the other four traditional methods solely using PET. The Otsu method (blue) and the CV method (pink) totally failed for several patients (e.g, patients 18, 27, 28, 35), while the proposed had still decent performance for these patients.
Fig. 12.
Fig. 12.
The mean and standard deviation of DSC, CE and VE on the 36 testing samples by the proposed method and the other four traditinal methods using PET only.
Fig. 13.
Fig. 13.
Visual comparison of the segmentation results (blue contour) of different methods and the ground truth (pink contour) for three patients (each row shows results for one patient). The results on the first patient by: (a) The proposed co-segmentation, and (b)-(e) traditional methods using PET only (OTSU, FCM, CV and Graph Cut); the result on the second patient by: (f) the proposed method, and (g)-(j) traditional methods using PET only (OTSU, FCM, CV and Graph Cut), The result on the third patient by: (k) the proposed method, and (l)-(o) traditional methods using PET only (OTSU, FCM, CV and Graph Cut).
Fig. 13.
Fig. 13.
Visual comparison of the segmentation results (blue contour) of different methods and the ground truth (pink contour) for three patients (each row shows results for one patient). The results on the first patient by: (a) The proposed co-segmentation, and (b)-(e) traditional methods using PET only (OTSU, FCM, CV and Graph Cut); the result on the second patient by: (f) the proposed method, and (g)-(j) traditional methods using PET only (OTSU, FCM, CV and Graph Cut), The result on the third patient by: (k) the proposed method, and (l)-(o) traditional methods using PET only (OTSU, FCM, CV and Graph Cut).
Fig. 14.
Fig. 14.
The mean and standard deviation of DSC, CE and VE on the 36 testing samples due to the proposed method and the other two variatinal co-segmentation methods.
Fig. 15.
Fig. 15.
Performance comparison with the traditional co-segmentation methods. (a) DSC, and (b) VE, all on 36 testing samples. The proposed method (green) had a better performance and was more robust than both traditional co-segmentation methods. The FVM_CO_1 method and FVM_CO_2 method totally failed for several patients (e,g, patients 12, 13, 17, 27), while the proposed still had decent performance for these patients.
Fig. 15.
Fig. 15.
Performance comparison with the traditional co-segmentation methods. (a) DSC, and (b) VE, all on 36 testing samples. The proposed method (green) had a better performance and was more robust than both traditional co-segmentation methods. The FVM_CO_1 method and FVM_CO_2 method totally failed for several patients (e,g, patients 12, 13, 17, 27), while the proposed still had decent performance for these patients.
Fig. 16.
Fig. 16.
Visual comparison of the segmentation results (blue contour) of different methods and the ground truth (pink contour) for three patients (each arrow shows results for one patient). The result on the first patient by: a) the proposed method, (b) FVM_CO_1, (c) FVM_CO_2 on PET, and (d) FVM_CO_2 on CT, respectively. The result on the second patient by: (e) the proposed method, (f) FVM_CO_1, (g) FVM_CO_2 on PET, and (h) FVM_CO_2 on CT, respectively. The result on the third patient by: (i) the proposed method, (j) FVM_CO_1, (k) FVM_CO_2 on PET, and (l) FVM_CO_2 on CT, respectively.
Fig. 16.
Fig. 16.
Visual comparison of the segmentation results (blue contour) of different methods and the ground truth (pink contour) for three patients (each arrow shows results for one patient). The result on the first patient by: a) the proposed method, (b) FVM_CO_1, (c) FVM_CO_2 on PET, and (d) FVM_CO_2 on CT, respectively. The result on the second patient by: (e) the proposed method, (f) FVM_CO_1, (g) FVM_CO_2 on PET, and (h) FVM_CO_2 on CT, respectively. The result on the third patient by: (i) the proposed method, (j) FVM_CO_1, (k) FVM_CO_2 on PET, and (l) FVM_CO_2 on CT, respectively.

References

    1. Lecun Y, Bengio Y, Hinton G, Deep learning, Nature, 521 (2015) 436–444. - PubMed
    1. Krizhevsky A, Sutskever I, Hinton GE, ImageNet classification with deep convolutional neural networks, in: International Conference on Neural Information Processing Systems, 2012, pp. 1097–1105.
    1. Simonyan K, Zisserman A, Very deep convolutional networks for large-scale image recognition, arXiv preprint arXiv:1409.1556, (2014).
    1. Szegedy C, Liu W, Jia Y, Sermanet P, Reed S, Anguelov D, Erhan D, Vanhoucke V, Rabinovich A, Going deeper with convolutions, in: Computer Vision and Pattern Recognition, 2015, pp. 1–9.
    1. Gao XW, Hui R, Tian Z, Classification of CT brain images based on deep learning networks, Computer Methods & Programs in Biomedicine, 138 (2017) 49–56. - PubMed

Publication types

MeSH terms