

MRI-based attenuation correction for brain PET/MRI based on anatomic signature and machine learning
- PMID: 30524027
- PMCID: PMC7773209
- DOI: 10.1088/1361-6560/aaf5e0
MRI-based attenuation correction for brain PET/MRI based on anatomic signature and machine learning
Abstract
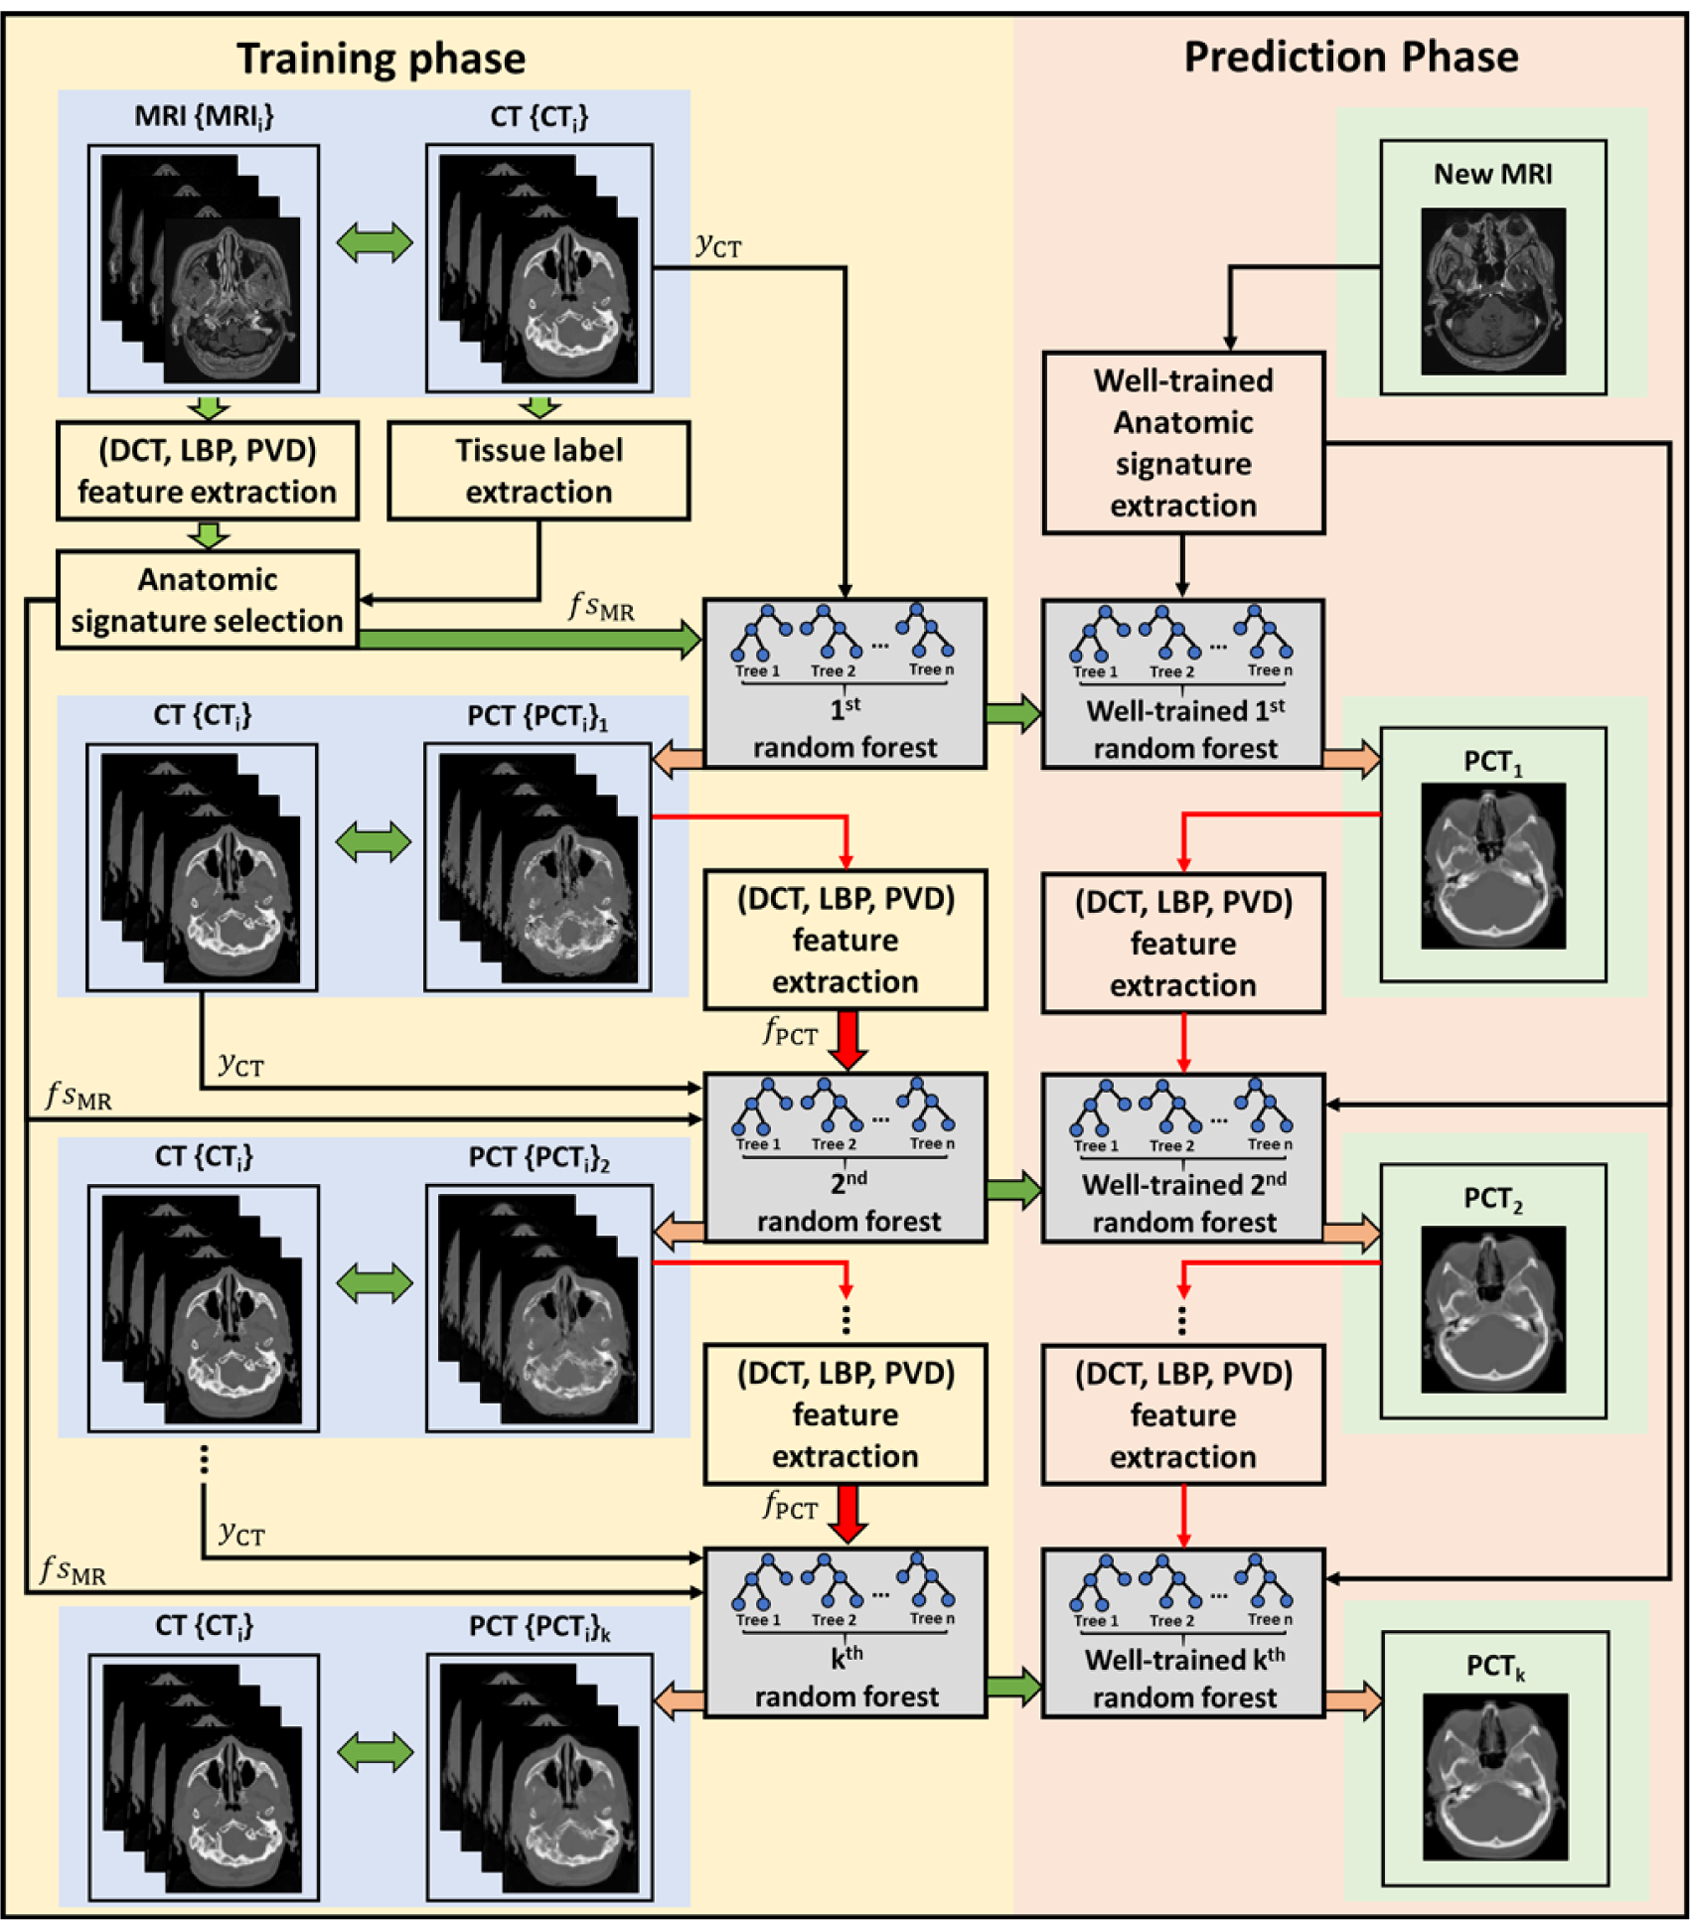
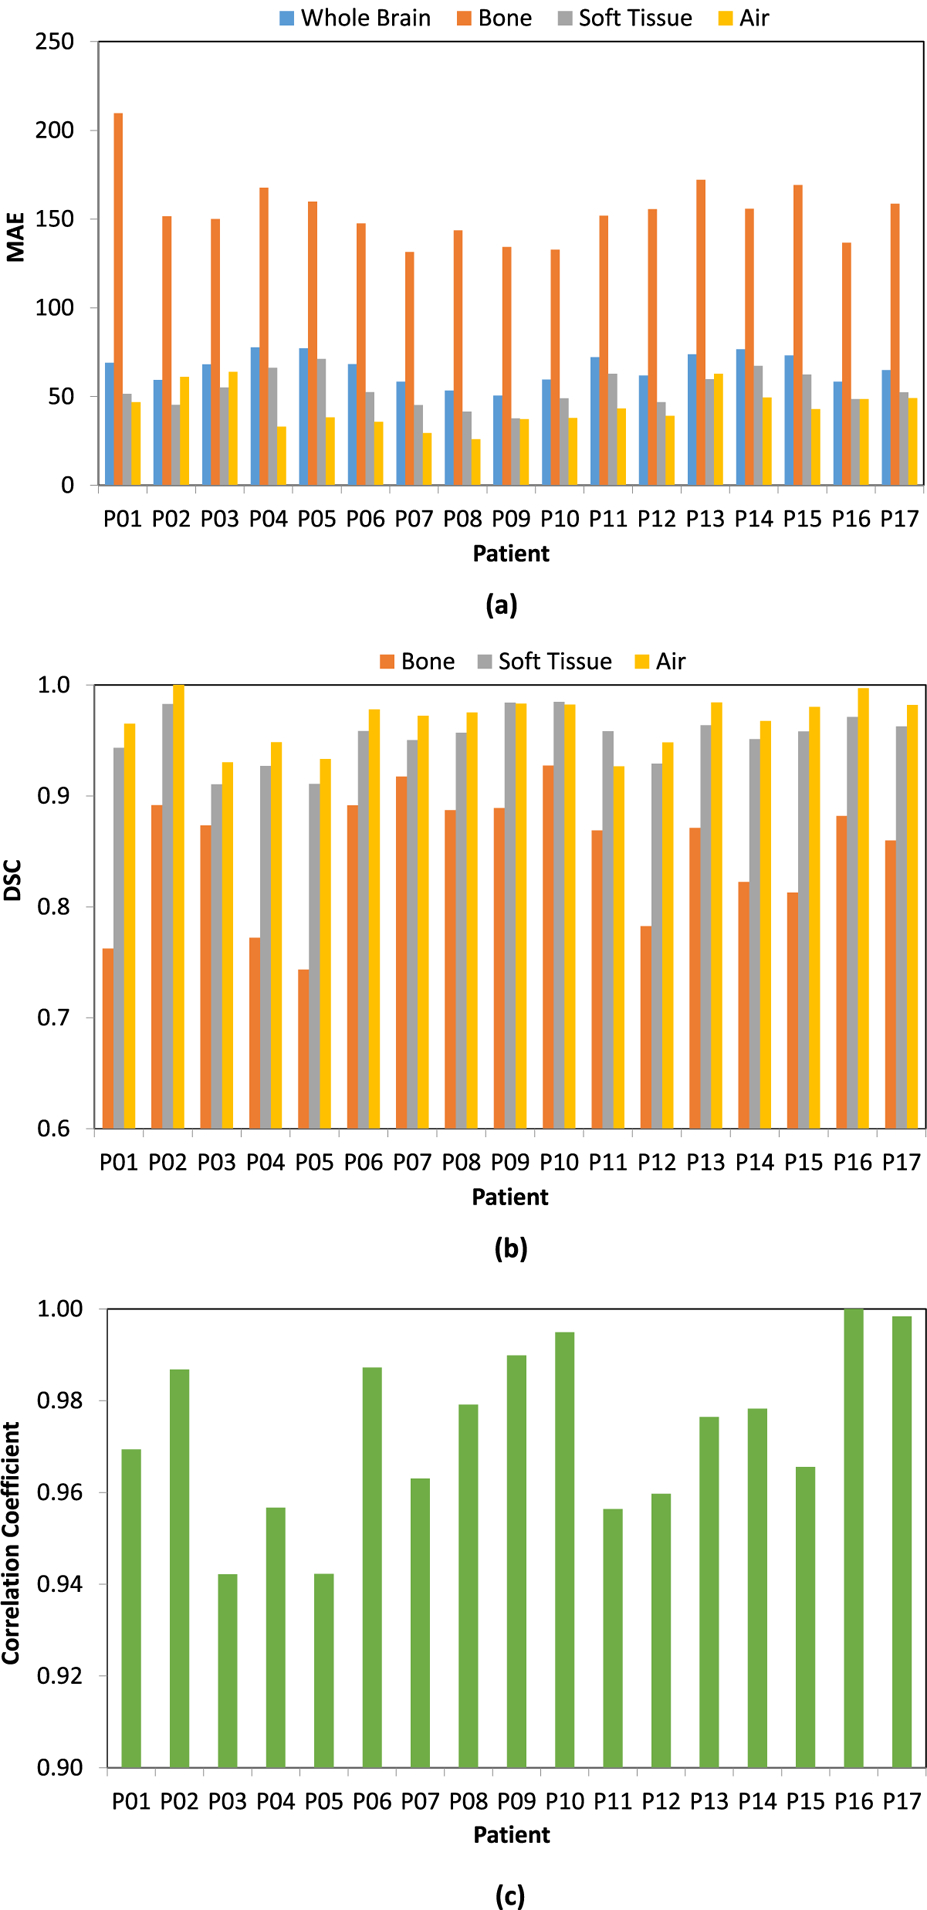
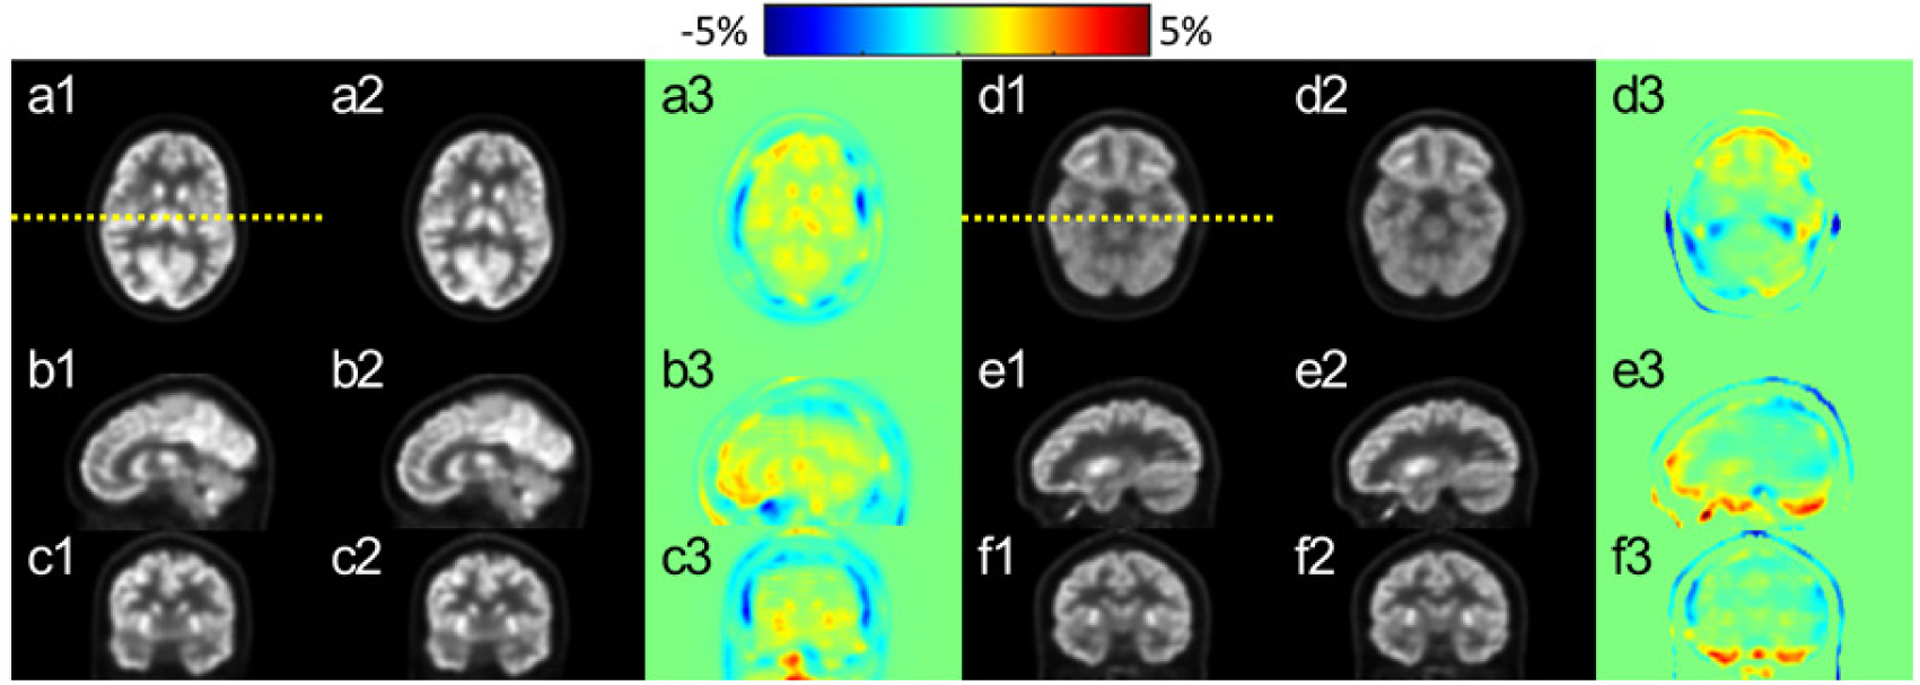
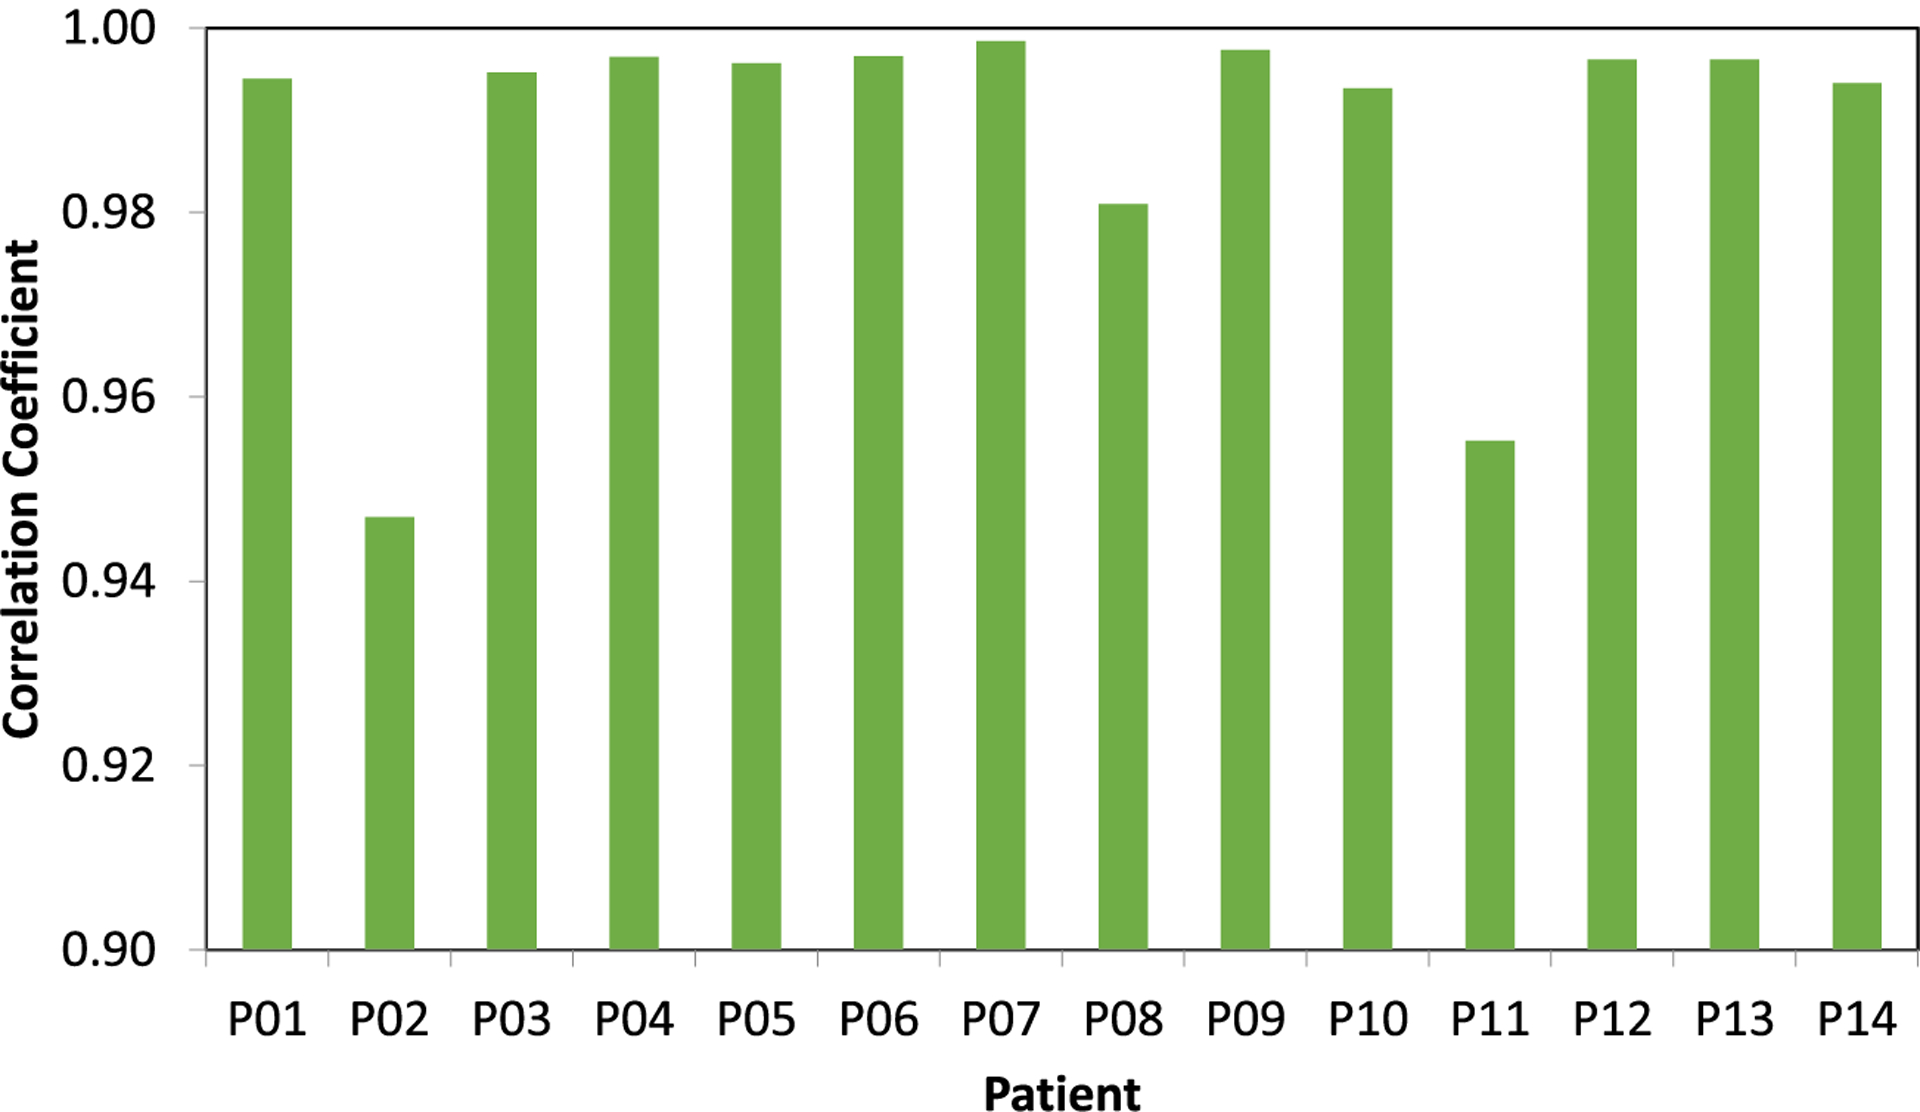
Deriving accurate attenuation maps for PET/MRI remains a challenging problem because MRI voxel intensities are not related to properties of photon attenuation and bone/air interfaces have similarly low signal. This work presents a learning-based method to derive patient-specific computed tomography (CT) maps from routine T1-weighted MRI in their native space for attenuation correction of brain PET. We developed a machine-learning-based method using a sequence of alternating random forests under the framework of an iterative refinement model. Anatomical feature selection is included in both training and predication stages to achieve optimal performance. To evaluate its accuracy, we retrospectively investigated 17 patients, each of which has been scanned by PET/CT and MR for brain. The PET images were corrected for attenuation on CT images as ground truth, as well as on pseudo CT (PCT) images generated from MR images. The PCT images showed mean average error of 66.1 ± 8.5 HU, average correlation coefficient of 0.974 ± 0.018 and average Dice similarity coefficient (DSC) larger than 0.85 for air, bone and soft tissue. The side-by-side image comparisons and joint histograms demonstrated very good agreement of PET images after correction by PCT and CT. The mean differences of voxel values in selected VOIs were less than 4%, the mean absolute difference of all active area is around 2.5%, and the mean linear correlation coefficient is 0.989 ± 0.017 between PET images corrected by CT and PCT. This work demonstrates a novel learning-based approach to automatically generate CT images from routine T1-weighted MR images based on a random forest regression with patch-based anatomical signatures to effectively capture the relationship between the CT and MR images. Reconstructed PET images using the PCT exhibit errors well below accepted test/retest reliability of PET/CT indicating high quantitative equivalence.
Conflict of interest statement
Disclosure
No potential conflicts of interest relevant to this article exist.
Figures


References
-
- Andreasen D, Edmund JM, Zografos V, Menze BH and Van Leemput K 2016a. Computed Tomography synthesis from Magnetic Resonance images in the pelvis using multiple random forests and auto-context features Proc. SPIE 9784 978417
-
- Andreasen D, Van Leemput K and Edmund JM 2016b. A patch-based pseudo-CT approach for MRI-only radiotherapy in the pelvis Med. Phys. 43 4742–52 - PubMed
-
- Andreasen D, Van Leemput K, Hansen RH, Andersen JAL and Edmund JM 2015. Patch-based generation of a pseudo CT from conventional MRI sequences for MRI-only radiotherapy of the brain Med. Phys 42 1596–605 - PubMed
-
- Aouadi S, Vasic A, Paloor S, Hammoud RW, Torfeh T, Petric P and Al-Hammadi N 2016. Sparse patch-based method applied to mri-only radiotherapy planning Phys. Med 32 309
-
- Blomqvist L, Bäck A, Ceberg C, Enbladh G, Frykholm G, Johansson M, Olsson L and Zackrisson B 2013. MR in radiotherapy—an important step towards personalized treatments Report from the SSM’s Scientific Council on Ionizing Radiation within Oncology SSM