. 2018 Nov 22:9:2697.
doi: 10.3389/fimmu.2018.02697. eCollection 2018.

Specific MHC-I Peptides Are Induced Using PROTACs

Affiliations

Specific MHC-I Peptides Are Induced Using PROTACs

Stephanie M Jensen et al. Front Immunol. .

Abstract

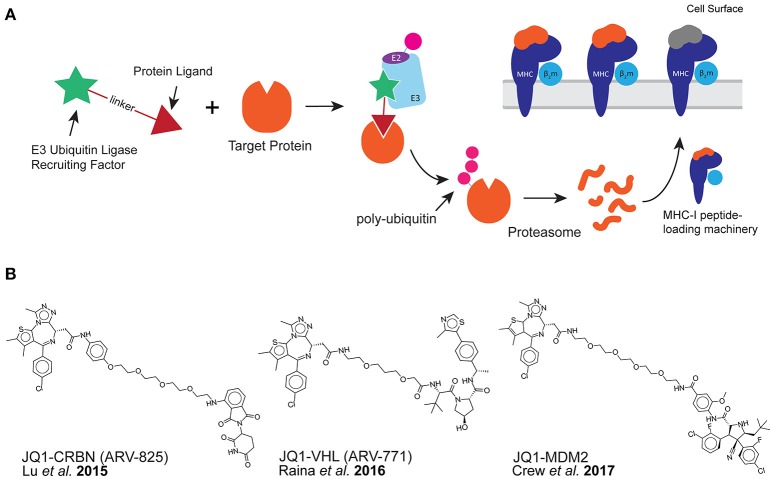
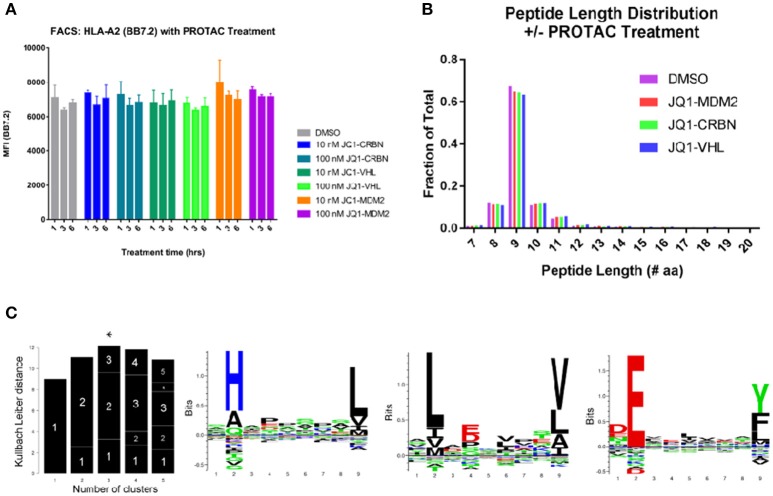
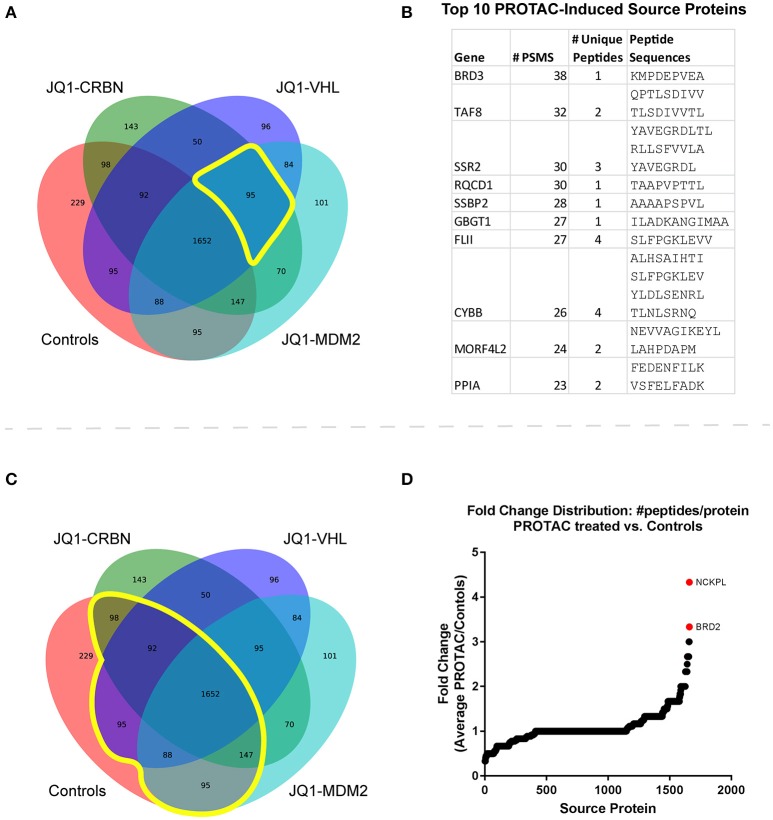
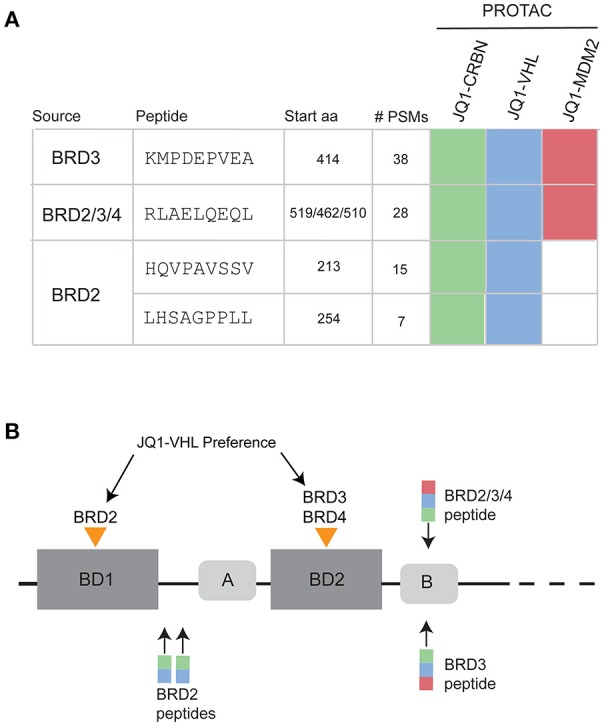
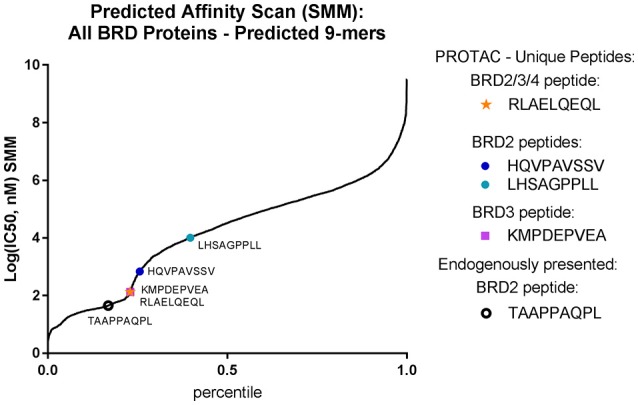
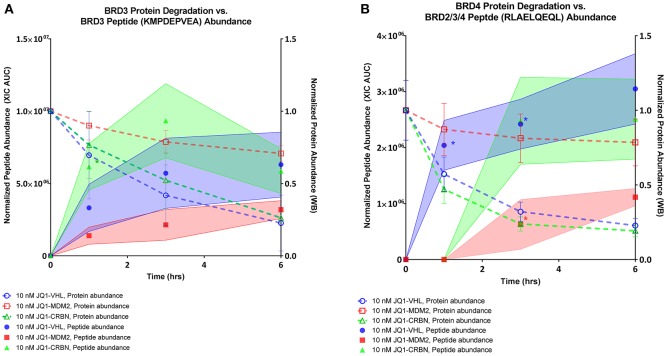
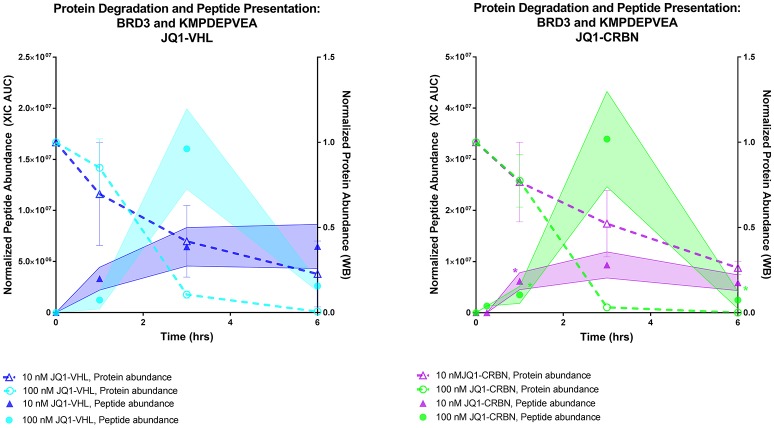
Peptides presented by the class-I major histocompatibility complex (MHC-I) are important targets for immunotherapy. The identification of these peptide targets greatly facilitates the generation of T-cell-based therapeutics. Herein, we report the capability of proteolysis targeting chimera (PROTAC) compounds to induce the presentation of specific MHC class-I peptides derived from endogenous cellular proteins. Using LC-MS/MS, we identified several BET-derived MHC-I peptides induced by treatment with three BET-directed PROTAC compounds. To understand our ability to tune this process, we measured the relative rate of presentation of these peptides under varying treatment conditions using label-free mass spectrometry quantification. We found that the rate of peptide presentation reflected the rate of protein degradation, indicating a direct relationship between PROTAC treatment and peptide presentation. We additionally analyzed the effect of PROTAC treatment on the entire immunopeptidome and found many new peptides that were displayed in a PROTAC-specific fashion: we determined that these identifications map to the BET pathway, as well as, potential off-target or unique-to-PROTAC pathways. This work represents the first evidence of the use of PROTAC compounds to induce the presentation of MHC-I peptides from endogenous cellular proteins, highlighting the capability of PROTAC compounds for the discovery and generation of new targets for immunotherapy.

Keywords: BET; HLA; MHC-I; PROTAC; immunopeptides.


Figures

Figure 1
Figure 1
PROTAC compounds induce the presentation of MHC-I peptides. (A) PROTAC compounds consist of a protein ligand (triangle) and an E3 ubiquitin-ligase recruiting factor (star). PROTAC compounds induce the proteolytic degradation of target cellular proteins through a ubiquitin-mediated (pink circle) pathway. This could result in the presentation of MHC-I peptides derived from target protein. (B) PROTAC compounds used in this study: all three target the BET family of proteins through the small molecule JQ1 while recruiting different E3 ubiquitin-ligases.
Figure 2
Figure 2
General effects of PROTAC treatment on BV173 cells. (A) PROTAC treatment does not alter the amount of MHC-I on the cell surface: analyzed by flow cytometry and HLA-A2 staining (BB7.2), as well as, W6/32 (pan MHC-I, Figure S3). (B) MHC-I peptide length distribution from PROTAC-treated and DMSO-treated cells: PROTAC treatment does not change the length distribution of identified MHC-I peptides as evaluated for each PROTAC across all treatment time points and concentrations (aggregate values represented for each condition, plotted as fraction of total). (C) Gibbs clustering analysis revealed three predominant motifs present within isolated and identified HLA peptides. HLA alleles present in our tested cell line: HLA-A*02:01, HLA-A*30:01, HLA-B*18:01, HLA-B*15:10, HLA-C*12:03, and HLA-C*03:04.
Figure 3
Figure 3
Immunopeptide source protein identification by treatment across all time points and concentrations. (A) Venn diagram of source protein identifications made across all samples (n = 166). Control treatments include JQ1, pomalidomide, and DMSO. There were 95 source proteins uniquely identified in all 3 PROTAC-treated samples. (B) The top ten identified PROTAC-specific proteins, ranked by number of observations (PSMs) with corresponding MHC-I peptide sequences. (C) Venn diagram of source protein identifications made across all samples. 1,652 source protein identifications were shared between treated and control samples. (D) Fold change was calculated for proteins present in both treated and control samples from the list of shared protein identifications. Changes in the number of unique peptides per protein were analyzed for each treatment vs. controls (DMSO, JQ1, and pomalidomide). Fold change = [peptides/protein]PROTAC/[peptides/protein]Controls. The average fold change across all PROTAC-treatments vs. controls was plotted and source proteins with the greatest increase in representation are highlighted. Fold change was calculated for proteins present in both treated and control samples.
Figure 4
Figure 4
PROTAC-induced BRD peptides across all time points and concentrations. (A) MHC-I peptides observed uniquely after PROTAC treatment. Sequences were verified with synthetic spectra (Figure S6). Map of specific PROTAC compounds that induced presentation of each peptide. (B) BRD protein family domain map, showing the relative locations of bromodomain 1 (BD1) and bromodomain 2 (BD2) as well as two conserved regions (A and B) within the protein sequence. JQ1 cooperatively binds and degrades BRD2 within BD1. JQ1-VHL cooperatively binds and degrades BRD3 and BRD4 within BD2. Observed peptides derived from BRD2, BRD3, and BRD2/3/4 are annotated over the BRD family protein structure, with colored boxes representing JQ1-CRBN (green), JQ1-VHL (blue), and JQ1-MDM2 (red) induced presentation.
Figure 5
Figure 5
PROTAC-induced BRD peptides have sub-optimal affinity for BV173 alleles. Identified PROTAC-induced BRD peptides, mapped over predicted affinity of all potential BRD2 and BRD3 9-mers (IC50, nM) predicted with the SMM algorithm.
Figure 6
Figure 6
BRD peptide presentation, 10 nM PROTAC compounds. (A) Relative abundance of BRD3 peptide KMPDEPVEA over a 6 h time course across all 3 PROTAC treatments overlaid with relative abundance of BRD3 protein as assessed by western blot. (B) Relative abundance of BRD2/3/4 peptide RLAELQEQL over a 6 h time course across all 3 PROTAC treatments overlaid with relative abundance of BRD4 protein as assessed by western blot. Shaded regions of peptide abundance curves are standard deviation over multiple replicates (2–6 replicates). Peptide abundance data (XIC AUC) and exact number of replicates is supplied in Table S5. Western blot data is plotted as the mean over three replicates, +/– SD. *indicates single observation, with average experimental error applied.
Figure 7
Figure 7
Comparing protein degradation and peptide presentation for BRD3 using different PROTAC concentrations. BRD3 protein degradation (Right Y axis, both plots) was measured by western blot.Protein degradation was measured using either 10 nM or 100 nM of either JQ1-VHL or JQ1-CRBN treatment over a 6 h time course. BRD3 peptide KMPDEPVEA presentation (Left Y axis) after treatment with10 or 100 nM JQ1-VHL or JQ1-CRBN treatment is shown. Peptide abundance data (XIC AUC) and number of replicates is supplied in Table S5. *indicates single observation, with average experimental error applied.

References

    1. Townsend AR, Rothbard J, Gotch FM, Bahadur G, Wraith D, McMichael AJ. The epitopes of influenza nucleoprotein recognized by cytotoxic T lymphocytes can be defined with short synthetic peptides. Cell (1986) 44:959–68. 10.1016/0092-8674(86)90019-X - DOI - PubMed
    1. Dutoit V, Herold-Mende C, Hilf N, Schoor O, Beckhove P, Bucher J, et al. Exploiting the glioblastoma peptidome to discover novel tumour-associated antigens for immunotherapy. Brain (2012) 135 (Pt 4):1042–54. 10.1093/brain/aws042 - DOI - PubMed
    1. Walseng E, Walchli S, Fallang LE, Yang W, Vefferstad A, Olweus J, et al. Soluble T-cell receptors produced in human cells for targeted delivery. PLoS ONE (2015) 10:e0119559 10.1371/journal.pone.0119559 - DOI - PMC - PubMed
    1. Bourdetsky D, Schmelzer CEH, Admon A. The nature and extent of contributions by defective ribosome products to the HLA peptidome. Proc Natl Acad Sci USA. (2014) 111:E1591–9. 10.1073/pnas.1321902111 - DOI - PMC - PubMed
    1. Anton LC, Yewdell JW. Translating DRiPs: MHC class I immunosurveillance of pathogens and tumors. J Leukoc Biol. (2014) 95:551–62. 10.1189/jlb.1113599 - DOI - PMC - PubMed

Publication types

Substances