. 2018 Nov 21:9:535.
doi: 10.3389/fgene.2018.00535. eCollection 2018.

Type 1 Diabetes Mellitus-Associated Genetic Variants Contribute to Overlapping Immune Regulatory Networks

Affiliations

Type 1 Diabetes Mellitus-Associated Genetic Variants Contribute to Overlapping Immune Regulatory Networks

Denis M Nyaga et al. Front Genet. .

Abstract

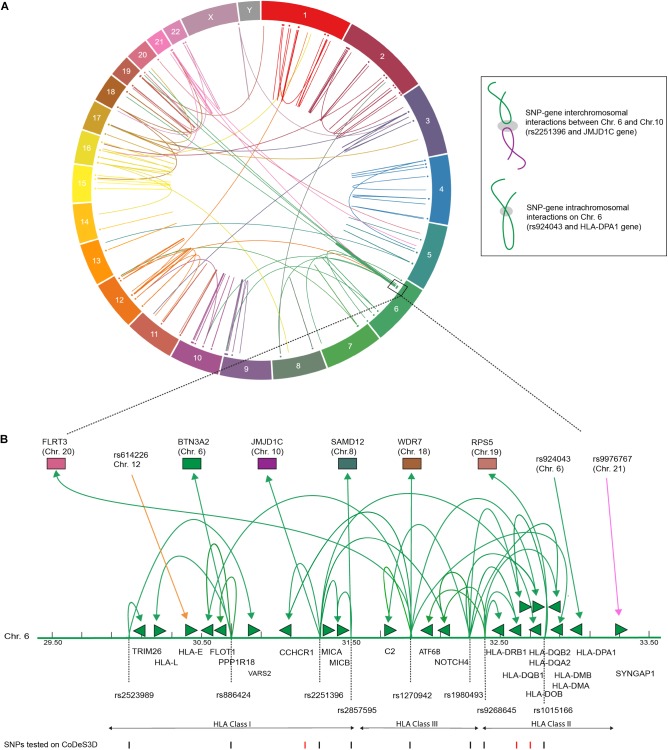
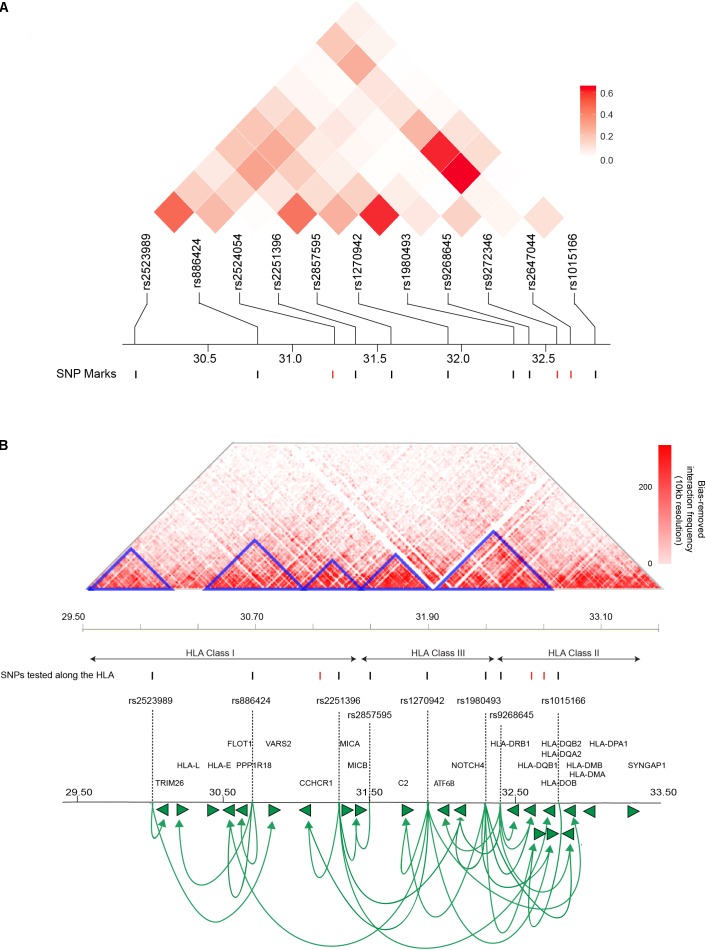
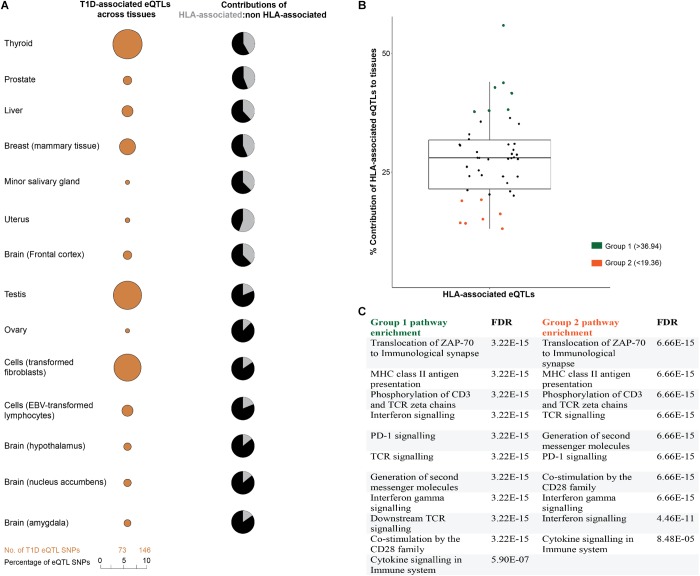
Type 1 diabetes (T1D) is a chronic metabolic disorder characterized by the autoimmune destruction of insulin-producing pancreatic islet beta cells in genetically predisposed individuals. Genome-wide association studies (GWAS) have identified over 60 risk regions across the human genome, marked by single nucleotide polymorphisms (SNPs), which confer genetic predisposition to T1D. There is increasing evidence that disease-associated SNPs can alter gene expression through spatial interactions that involve distal loci, in a tissue- and development-specific manner. Here, we used three-dimensional (3D) genome organization data to identify genes that physically co-localized with DNA regions that contained T1D-associated SNPs in the nucleus. Analysis of these SNP-gene pairs using the Genotype-Tissue Expression database identified a subset of SNPs that significantly affected gene expression. We identified 246 spatially regulated genes including HLA-DRB1, LAT, MICA, BTN3A2, CTLA4, CD226, NOTCH1, TRIM26, PTEN, TYK2, CTSH, and FLRT3, which exhibit tissue-specific effects in multiple tissues. We observed that the T1D-associated variants interconnect through networks that form part of the immune regulatory pathways, including immune-cell activation, cytokine signaling, and programmed cell death protein-1 (PD-1). Our results implicate T1D-associated variants in tissue and cell-type specific regulatory networks that contribute to pancreatic beta cell inflammation and destruction, adaptive immune signaling, and immune-cell proliferation and activation. A number of other regulatory changes we identified are not typically considered to be central to the pathology of T1D. Collectively, our data represent a novel resource for the hypothesis-driven development of diagnostic, prognostic, and therapeutic interventions in T1D.

Keywords: Type 1 diabetes; autoimmunity; expression quantitative trait loci (eQTL); genetic variation; genome organization; genome-wide association studies (GWAS).


Figures

FIGURE 1
FIGURE 1
T1D associated SNPs form an integrated gene regulatory network. (A) Circos plot showing eQTL associations between T1D SNPs and eGenes that overlap with Hi-C data. Data tracks: chromosome labels (outer-most ring); and a scatter plot of relative SNP positions. Link lines represent significant SNP-gene interactions at FDR q < 0.05 (Supplementary Table 2). The inset illustrates a cis- and trans-eQTL. The gray ellipsoid represents the unknown factors that are responsible for mediating the physical interaction. (B) T1D associated genetic variants are involved in cis- and trans-eQTLs that enter and emerge from the HLA locus. Significant cis- and trans-eQTLs are annotated by lines with arrows, green arrows heads denoted direction of the regulatory effect. Genes within the HLA locus are annotated as arrows, which indicate transcriptional direction. SNP positions are marked as lines (black – lines indicate significant SNPs, FDR < 0.05). eGenes affected by trans-eQTLs are colored according to chromosome number as in (A).
FIGURE 2
FIGURE 2
T1D-associated variants along the HLA locus affect gene expression within and outside of the locus. (A) Linkage disequilibrium (LD) plots of T1D-associated SNPs along the HLA locus amongst people with Western European ancestry (CEU). The squares within the heat map represent the LD (R2) value between every two variants. The weak LD (R2 ≤ 0.6) indicates that SNPs are infrequently co-inherited and contribute to disease development independently. SNPs with significant eQTLs are represented by black marks (FDR ≤ 0.05). (B) An interaction frequency heat map of intra-chromosomal contacts across the HLA locus (∼4 Mb) captured in the human lymphoblastoid cell line GM12878 at 10 kb resolution (Rao et al., 2014). The heat map color represent the levels of normalized interaction frequencies and triangles illustrate topological association domains (TADs). SNPs that show significant and non-significant eQTLs are denoted by black and red marks, respectively (FDR ≤ 0.05). Loops (lines with arrows) represent interactions between SNPs and genes that are associated with differential expression. Green arrows heads denoted direction of the regulatory effect. The illustrated gene map is as in Figure 1 (B). [The heat map matrix of pairwise LD was plotted at https://ldlink.nci.nih.gov/. Hi-C interaction frequency heat maps were plotted at http://kobic.kr/3div/ (Yang et al., 2018)].)
FIGURE 3
FIGURE 3
T1D-associated eQTL effects are tissue-specific. (A) T1D-associated eQTLs are differentially distributed across human tissues. The differential distribution is epitomized by the relative proportions of HLA and non-HLA associated eQTLs in different tissues. A complete summary of all GTEx tissues with significant eQTLs (FDR ≤ 0.05) is presented in Supplementary Figure 1. (B) The relative contributions of HLA associated T1D eQTLs to tissue specific effects. Relative contribution was calculated (HLA: total eQTLs for a tissue expressed as a percentage). The mean HLA contribution was 28.16 ± 8.79%. (C) eGenes within tissues with high or low HLA contributions (i.e., ±1 SD from the mean) were enriched for biological pathways associated with immune pathways. Biological pathway enrichment was performed using the Reactome pathways database (Fabregat et al., 2018), with significant (FDR ≤ 0.05) for immune response pathways.

References

    1. American Diabetes Association (2003). Peripheral arterial disease in people with diabetes. Diabetes Care 26 3333–3341. 10.2337/diacare.26.12.3333 - DOI - PubMed
    1. Ashburner M., Ball C. A., Blake J. A., Botstein D., Butler H., Cherry J. M., et al. (2000). Gene ontology: tool for the unification of biology. Nat. Genet. 25 25–29. 10.1038/75556 - DOI - PMC - PubMed
    1. Barcellos L. F., May S. L., Ramsay P. P., Quach H. L., Lane J. A., Nititham J., et al. (2009). High-density SNP screening of the major histocompatibility complex in systemic lupus erythematosus demonstrates strong evidence for independent susceptibility regions. PLoS Genet. 5:e1000696. 10.1371/journal.pgen.1000696 - DOI - PMC - PubMed
    1. Bazzaz J., Amoli M. M., Taheri Z., Larijani B., Pravica V., Hutchinson I. V. (2014). TNF-α and IFN-γ gene variation and genetic susceptibility to type 1 diabetes and its microangiopathic complications. J. Diabetes Metab. Disord. 13:46. 10.1186/2251-6581-13-46 - DOI - PMC - PubMed
    1. Benjamini Y., Hochberg Y. (1995). Controlling the false discovery rate: a practical and powerful approach to multiple testing. J. R. Stat. Soc. B 57 289–300.