. 2018 Sep 11;7(12):e1475873.
doi: 10.1080/2162402X.2018.1475873. eCollection 2018.

Profiling targetable immune checkpoints in osteosarcoma

Affiliations

Profiling targetable immune checkpoints in osteosarcoma

Troy A McEachron et al. Oncoimmunology. .

Abstract

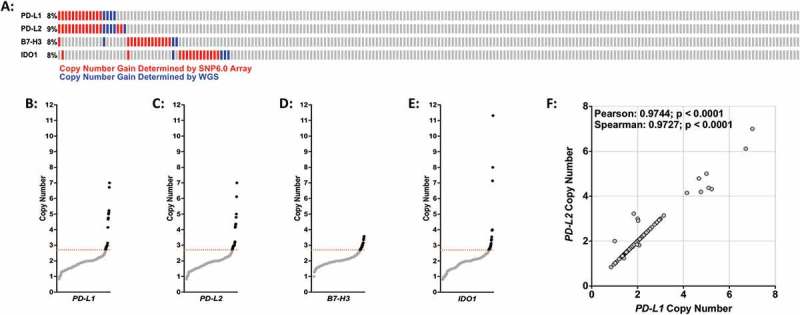
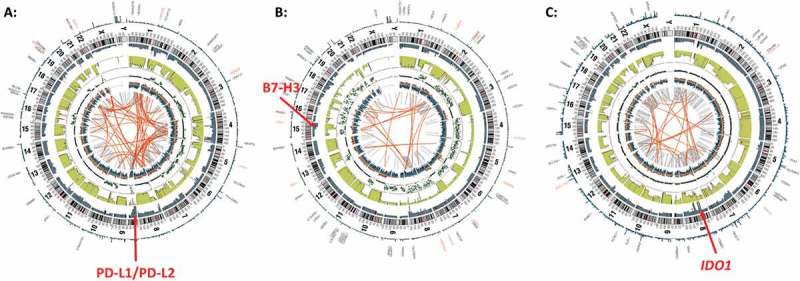
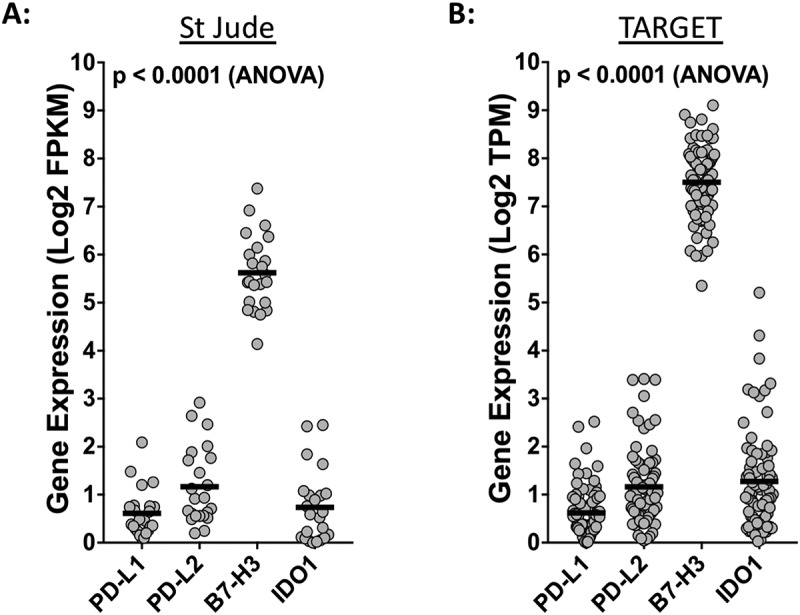
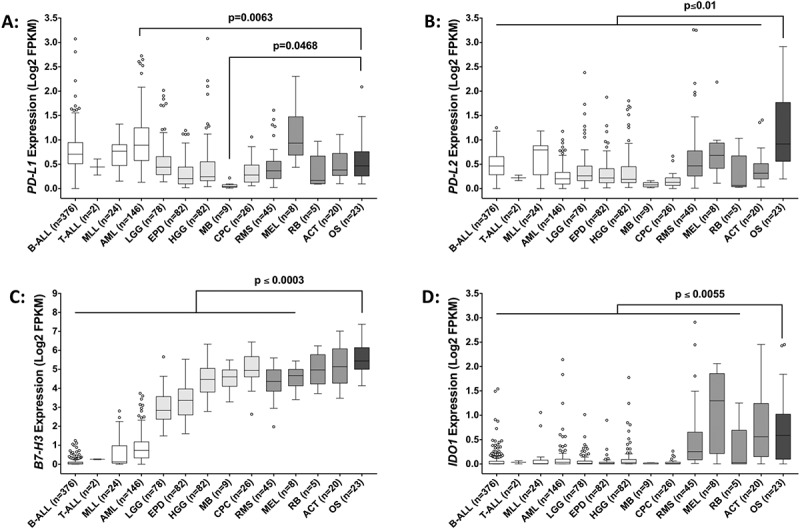
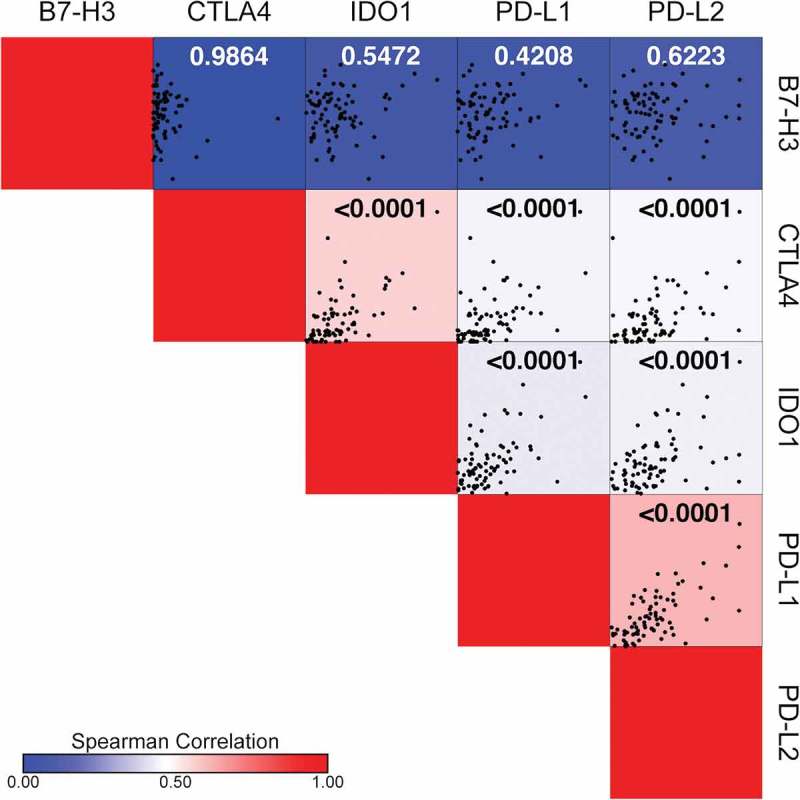
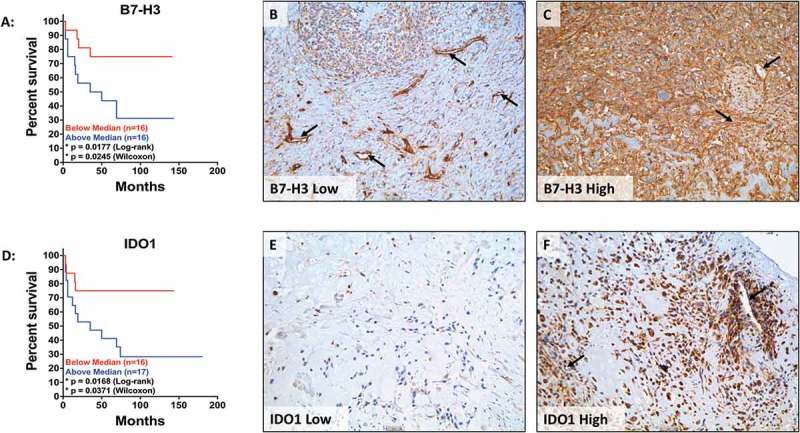
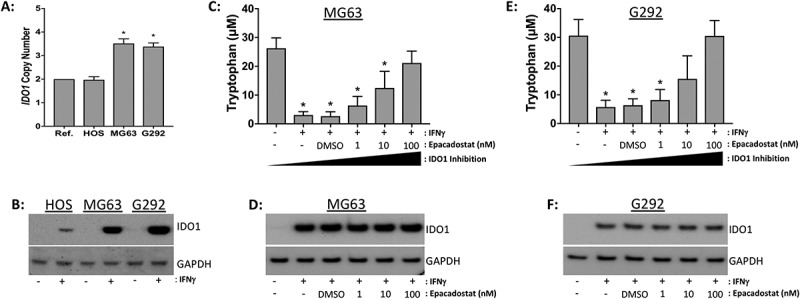
Osteosarcomas are aggressive bone tumors for which therapeutic advances have not improved over several decades. Unlike most pediatric tumors, the osteosarcoma genome is remarkably unstable, characterized by numerous copy number alterations and chromosomal structural aberrations. In this study, we asked if the targetable immune checkpoints CD274 (PD-L1), PDCD1LG2 (PD-L2), CD276 (B7-H3) and IDO1 are impacted by copy number alterations in osteosarcoma. Of the 215 osteosarcoma samples investigated, PD-L1/PD-L2, B7-H3 and IDO1 were independently gained at frequencies of approximately 8-9%, with a cumulative frequency of approximately 24%. RNA sequencing data from two independent cohorts revealed that B7-H3 is the most highly expressed immune checkpoint gene among the four investigated. We also show that IDO1 is preferentially expressed in pediatric solid tumors and that increased protein expression of B7-H3 and IDO1 are significantly associated with inferior survival in patient samples. Using human osteosarcoma cell lines, we demonstrate that IDO1 is gained in MG63 and G292 cells and that the IDO1 inhibitor, epacadostat, inhibits the enzymatic activity of IDO1 in a dose-dependent manner in these cells. Together, these data reveal the genomic and transcriptomic profiles of PD-L1, PD-L2, B7-H3 and IDO1 in osteosarcoma and identifies a potential context for targeted immunotherapeutic intervention in a subset of patients.

Keywords: B7-H3; CD276; IDO1; Osteosarcoma; PD-L1; PD-L2; checkpoint.


Figures

Figure 1.
Figure 1.
Copy number gains of PD-L1, PD-L2, B7-H3, and IDO1 in osteosarcoma specimens. (A) Graphical depiction of PD-L1, PD-L2, B7-H3, and IDO1 copy number gains in 215 osteosarcoma specimens. Red bars = copy number detected by SNP6.0 arrays; blue bars = copy number determined by whole genome sequencing. (B-E) DNA copy number distribution of (B) PD-L1, (C) PD-L2, (D) B7-H3, and (E) IDO1 in osteosarcoma specimens where black dots indicate individual specimens with copy number values above threshold (2.7 copies; dotted red line). (F) DNA copy number scatter plot for PD-L1 and PD-L2. Statistical significance (p ≤ 0.05) determined using both Spearman and Pearson correlation tests.
Figure 2.
Figure 2.
Copy number alterations at PD-L1/PD-L2, B7-H3, and IDO1 loci revealed by whole genome sequencing. Representative circos plots of whole genome sequencing data from three individual patients indicating copy number gains at loci encoding (A) PD-L1/PD-L2, (B) B7-H3, and (C) IDO1. Red arrows point to locus of interest.
Figure 3.
Figure 3.
Osteosarcomas express high levels of B7-H3. Respective expression levels of PD-L1, PD-L2, B7-H3, and IDO1 using RNA-sequencing data from the (A) St. Jude osteosarcoma and the (B) NCI TARGET osteosarcoma datasets. Statistical significance (p < 0.05) was determined using ANOVA and corrected for multiple comparisons. P values for each comparison are listed in Table 1. FPKM, fragments per kilobase of transcript mapped; TPM, transcripts per million.
Figure 4.
Figure 4.
Disease status does not significantly influence the expression of immune checkpoint genes. Comparative analysis of (A, E) PD-L1, (B, F) PD-L2, (C, G) B7-H3, and (D, H) IDO1 gene expression in diagnostic versus metastatic osteosarcoma samples using RNA-sequencing data from the (A-D) St. Jude osteosarcoma (n = 23) and the (E-H) NCI TARGET osteosarcoma (n = 81) datasets. Statistical significance (p ≤ 0.05) determined using unpaired two-tailed t-tests with Welch’s correction. FPKM, fragments per kilobase of transcript mapped; TPM, transcripts per million.
Figure 5.
Figure 5.
Expression of immune checkpoint genes across multiple pediatric tumor types. Gene expression of (A) PD-L1, (B) PD-L2, (C) B7-H3, and (D) IDO1 across various pediatric hematologic malignancies (white bars), central nervous system tumors (light gray bars), solid tumors (gray bars), and osteosarcoma (dark gray bar). Statistical significance (p ≤ 0.05) was determined using one-way ANOVA with Holm-Sidak’s multiple comparison test. P values are indicated for each pairwise comparison (vs. osteosarcoma). B-ALL, B-acute lymphoblastic leukemia; T-ALL, T-acute lymphoblastic leukemia; MLL, mixed lineage leukemia; AML, acute myeloid leukemia; LGG, low-grade glioma; EPD, ependymoma; HGG, high-grade glioma; MB, medulloblastoma; CPC, choroid plexus carcinoma; RMS, rhabdomyosarcoma; MEL, melanoma; RB, retinoblastoma; ACT, adrenocortical tumor; OS, osteosarcoma.
Figure 6.
Figure 6.
B7-H3 expression does not correlate with the expression of PD-L1, PD-L2, IDO1, or CTLA4. Spearman correlation matrix illustrating gene expression correlations between PD-L1, PD-L2, B7-H3, IDO1 and CTLA4 using the TARGET osteosarcoma RNA sequencing dataset. Respective correlation X-Y scatter plots are shown within each square where each black dot represents an individual sample. Spearman correlation (r) is indicated by the color bar where r values increase from blue (r = 0) to red (r = 1). Statistical significance (p ≤ 0.05) for each correlation is indicated in each square.
Figure 7.
Figure 7.
B7H3 and IDO1 protein expression independently correlate with decreased survival. Kaplan-Meier curves of (A) B7-H3 and (D) IDO1 expression in osteosarcoma TMAs. Representative images of osteosarcoma tissue cores expressing (B) low levels of B7-H3, (C) high levels of B7-H3, (E) low levels of IDO1, and (F) high levels of IDO1. Low expression (red) is defined as IHC score below the mean and high expression (blue) is defined as IHC score above the mean. Statistical significance (p ≤ 0.05) was determined using both log-rank and Wilcoxon tests. Black arrows denote tumor vasculature. Scale bar = 50#181;m.
Figure 8.
Figure 8.
Heterogeneous expression of B7-H3 and IDO1 in osteosarcoma tissue. (A, C) Representative images of (A) B7-H3 and (C) IDO1 immunohistochemistry demonstrating immunoreactivity in malignant cells and tumor-associated vasculature. (B, D) Variable expression of (B) B7-H3 and (D) IDO1 in lymphoid aggregates. Black boxes indicate enlarged regions of interest (to the right of each panel). Black arrows denote tumor vasculature. Scale bar = 50#181;m.
Figure 9.
Figure 9.
Epadacostat inhibits IDO1 function in G292 and MG63 human osteosarcoma cell lines in vitro. (A) DNA copy number profile of IDO1 in HOS, MG63, and G292 cells. Ref, diploid reference DNA. (B) IDO1 western blot on whole cell lysates from osteosarcoma cell lines stimulated with serum free media (-) or IFNγ (+) for 24-hours. GAPDH serves as the loading control. (C, E) Epacadostat decreases tryptophan metabolism in conditioned media from (C) MG63 and (E) G292 cell lines. Cells were pre-treated for 1-hour with the indicated doses of epacadostat then stimulated with serum free media (-) or IFNγ (+) for 24-hours. Decreased tryptophan concentrations are indicative of increased IDO1 enzymatic activity. IDO1 protein expression in (D) MG63 and (F) G292 cell lines treated with epacadotstat and IFNγ as indicated below. Western blot images are representative of three independent experiments. Statistical significance (p ≤ 0.05) was determined using ANOVA and corrected for multiple comparisons (control vs. treated).

References

    1. Chen X, Bahrami A, Pappo A, Easton J, Dalton J, Hedlund E, Ellison D, Shurtleff S, Wu G, Wei L, et al. Recurrent somatic structural variations contribute to tumorigenesis in pediatric osteosarcoma. Cell Rep. 2014. 7(1):104–112. doi:10.1016/j.celrep.2014.03.003. - DOI - PMC - PubMed
    1. Kovac M, Blattmann C, Ribi S, Smida J, Mueller NS, Engert F, Castro-Giner F, Weischenfeldt J, Kovacova M, Krieg A, et al. Exome sequencing of osteosarcoma reveals mutation signatures reminiscent of BRCA deficiency. Nat Commun. 2015. 6:8940. doi:10.1038/ncomms9940. - DOI - PMC - PubMed
    1. Lorenz S, Barøy T, Sun J, Nome T, Vodák D, Bryne JC, Håkelien AM, Fernandez-Cuesta L, Möhlendick B, Rieder H, et al. Unscrambling the genomic chaos of osteosarcoma reveals extensive transcript fusion, recurrent rearrangements and frequent novel TP53 aberrations. Oncotarget. 2016. 7(5):5273–5288. doi:10.18632/oncotarget.6567. - DOI - PMC - PubMed
    1. Smida J, Xu H, Zhang Y, Baumhoer D, Ribi S, Kovac M, von Luettichau I, Bielack S, O'Leary VB, Leib-Mösch C, et al. Genome-wide analysis of somatic copy number alterations and chromosomal breakages in osteosarcoma. Int J Cancer. 2017. doi:10.1002/ijc.30778. - DOI - PubMed
    1. Allison DC, Carney SC, Ahlmann ER, Hendifar A, Chawla S, Fedenko A, Angeles C, Menendez LR.. A meta-analysis of osteosarcoma outcomes in the modern medical era. Sarcoma. 2012. 2012:704872. doi:10.1155/2012/704872. - DOI - PMC - PubMed

Publication types