. 2018 Sep 25;7(12):e1504727.
doi: 10.1080/2162402X.2018.1504727. eCollection 2018.

Dendritic cell-based vaccination: powerful resources of immature dendritic cells against pancreatic adenocarcinoma

Affiliations

Dendritic cell-based vaccination: powerful resources of immature dendritic cells against pancreatic adenocarcinoma

Aurélie Collignon et al. Oncoimmunology. .

Abstract

Pancreatic adenocarcinoma (PAC) has a poor prognosis. One treatment approach, investigated here, is to reinforce antitumor immunity. Dendritic cells (DCs) are essential for the development and regulation of adaptive host immune responses against tumors. A major role for DCs may be as innate tumoricidal effector cells. We explored the efficacy of vaccination with immature (i)DCs, after selecting optimal conditions for generating immunostimulatory iDCs. We used two models, C57BL/6Jrj mice with ectopic tumors induced by the PAC cell line, Panc02, and genetically engineered (KIC) mice developing PAC. Therapeutic iDC-vaccination resulted in a significant reduction in tumor growth in C57BL/6Jrj mice and prolonged survival in KIC mice. Prophylactic iDC-vaccination prevented subcutaneous tumor development. These protective effects were long-lasting in Panc02-induced tumor development, but not in melanoma. iDC-vaccination impacted the immune status of the hosts by greatly increasing the percentage of CD8+ T-cells, and natural killer (NK)1.1+ cells, that express granzyme B associated with Lamp-1 and IFN-γ. Efficacy of iDC-vaccination was CD8+ T-cell-dependent but NK1.1+ cell-independent. We demonstrated the ability of DCs to produce peroxynitrites and to kill tumor cells; this killing activity involved peroxynitrites. Altogether, these findings make killer DCs the pivotal actors in the beneficial clinical outcome that accompanies antitumor immune responses. We asked whether efficacy can be improved by combining DC-vaccination with the FOLFIRINOX regimen. Combined treatment significantly increased the lifespan of KIC mice with PAC. Prolonged treatment with FOLFIRINOX clearly augmented this beneficial effect. Combining iDC-vaccination with FOLFIRINOX may therefore represent a promising therapeutic option for patients with PAC.

Keywords: Active immunotherapy; DC-based tumor immunotherapy; FOLFIRINOX; animal models; cancer vaccines; pancreatic cancer.


Figures

Figure 1.
Figure 1.
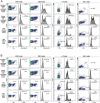
Characteristics of immature vaccinating DCs. (A) Analysis of cell-surface molecules on immature (i)DCs versus mature (m)DCs using flow cytometry. White histograms represent non-specific binding using control isotype antibodies (Ab), and blue histograms specific Ab as indicated. (B) Effects of IL-4, added either one day before the maturation (day 6: d6) or at the beginning of the culture (d0), on iDC and mDC cell-surface molecules. Percentage of fluorescent cells and median fluorescence intensity (MFI, in brackets) are shown. Value of isotype is deduced from that of each corresponding Ab unless indicated. (C) Effects of IL-4 on cytokine secretion by iDCs and mDCs. Culture supernatants from iDCs (medium), from DCs with IL-4, added either at d6 or at d0, and from mDCs (LPS+ CD40L) were collected on d7 for cytokine detection using ELISA assays. IL-12 and IL-15/IL-15 R production is presented as mean ± SEM of four experiments. (*< 0.05; Wilcoxon-Mann Whitney test).
Figure 2.
Figure 2.
Prophylactic iDC-vaccination in Panc02 pancreatic adenocarcinoma and B16-F0 melanoma models. (A) Prophylactic vaccination against pancreatic tumor cells. C57BL/6Jrj mice were either vaccinated sc with iDCs, three times at weekly intervals or received PBS (control mice) (n = 10 mice/group). Four days after the third iDC-injection, mice were challenged sc with Panc02 in the contralateral flank. Experiments were performed four times with groups of 6–9 mice, with similar results. Data are expressed as mean tumor surface area ± SEM. Six mice vaccinated with iDCs remained free of Panc02-induced tumors. Comparisons between groups were made by two-way ANOVA followed by a Bonferroni test (*< 0.05, **< 0.01, ***< 0.001). (B) Prophylactic vaccination against melanoma cells. The graph (left panel) shows the mean tumor surface area ± SEM of pooled data from two experiments, with the PBS-control group (n = 17) and the iDC-vaccinated group (n = 18), both challenged with B16-F0. The graph (right panel) shows a Kaplan-Meier survival curve from mice that received PBS (controls) or iDCs followed by B16-F0 inoculation (*= 0.04; log-rank Mantel-Cox test). (C, left panel) IFN-γ secretion. Culture supernatants of splenocytes were collected after 4 days for IFN-γ detection (mean ± SEM of four experiments). (C, right panel) Images of cells after 4 days of co-culture. Co-cultures of splenocytes with tumor cells were examined using a phase-contrast microscope (x200). Panc02 cultured with splenocytes from PBS-treated mice bearing tumors exhibit their usual spindled shape; Panc02 cultured with splenocytes from iDC-vaccinated and protected mice show dramatic changes in cell morphology and density.
Figure 3.
Figure 3.
Immune status of iDC-vaccinated mice. Spleens from iDC-vaccinated and protected mice, and from Panc02 tumor-bearing control mice, were collected on d18. Intracellular expression of granzyme B, Lamp-1, IFN-γ and TRAIL in CD45+CD3+CD4+ and CD8+ T-cells, CD45+CD3 NK1.1+ cells and γδ T-cells was determined after 4 days of culture. Percentage of fluorescent cells and MFI (in brackets) are shown. Value of isotype is deduced from that of each corresponding Ab. Representative of four experiments.
Figure 4.
Figure 4.
Long-term protection against pancreatic tumor cells and melanoma cells. Mice receiving prophylactic iDC-vaccination and remaining tumor-free were challenged after 38 days with (A) Panc02 (n = 7) or (B) B16-F0 (n = 11), along with respective controls injected with Panc02 (n = 5, representative of three experiments) or B16-F0 (n = 20, pool of two experiments). Data are expressed as mean tumor surface area ± SEM. Comparisons between groups were made by two-way ANOVA followed by a Bonferroni test. The graph (right panel) shows Kaplan-Meier survival curves from mice that received PBS (controls) or iDCs followed by B16-F0 inoculation (****= 0.0001; log-rank Mantel-Cox test). (C) Immune status of iDC-vaccinated mice with long-term protection. Twenty-four days after the second challenge with Panc02, splenocytes were collected and the expression of granzyme B and TRAIL were determined after four-day culture. (D) Statistical analyses of results from 3–4 experiments. (*< 0.05; Wilcoxon-Mann Whitney test).
Figure 5.
Figure 5.
Therapeutic iDC-vaccination. Fourteen days after challenge with Panc02 (once a palpable nodule had formed), mice were injected (A) intratumorally (n = 7) or (B) sc (n = 7) with iDCs three times at weekly intervals or received PBS (control mice, n = 7). Comparisons between groups were made by two-way ANOVA followed by a Bonferroni test (*< 0.05, **< 0.01, ***< 0.001, ****< 0.0001). (C) Comparisons of the tumor surface areas. Measurements at day 14 were subtracted from those at day 44 (termination date). (**P < 0.01; ns, not significant; Wilcoxon-Mann Whitney test). See Supplementary Fig. S4 (pooled data from two experiments). (D) Comparisons of the weights of the tumors excised at the termination date (*P < 0.05; Wilcoxon-Mann Whitney test). See also Supplementary Fig. S4 (pooled data from two experiments).
Figure 6.
Figure 6.
Cytotoxic properties of DCs and molecules involved in interactions with tumor cells. (A) Detection of nitrites in the DC supernatants. Detection of nitrites was performed in the supernatants of iDCs in culture with LPS, and mature DCs (after 24-h maturation with LPS+ CD40L) in the presence or absence of tumor cells. Data are mean ± SD from triplicate cultures (representative of three independent experiments). (B) Cytotoxic activities of DCs against tumor cells. DCs (d8) were cultured for 48h with Panc02 or B16-F0 cells, without stimulus, in the presence of LPS (iDCs+ LPS) or after 24-h maturation with LPS+ CD40L (mDCs), at the indicated tumor cell:DC ratios. The viability of tumor cells was determined using crystal violet assay. The data represent the mean ± SD from triplicate cultures and are representative of two independent experiments. (****< 0.0001). Right panel: Effects of peroxynitrite inhibitor on iDC tumoricidal activity. Tumor cells were cultured without DC (controls) or with LPS-activated iDC, with or without FeTPPS (75uM). Pooled data of two experiments; (****P < 0.0001; Wilcoxon-Mann Whitney test. (C) Flow cytometry analysis of DCs for the cell-surface expression of death receptor ligands and markers for IFN-producing DCs (IKDCs): NK1.1, NKG2D, and CD45R (B220). (D) Flow cytometry analysis of cell-surface expression of CD40L, CD40, TRAIL-RII, Fas, NKG2-L, and MHC class I on tumor cells.
Figure 7.
Figure 7.
iDC-vaccination in immunodeficient and NK cell-depleted mice. (A) Development of tumors in nude mice, treated with PBS (n = 7) or iDC-vaccination (n = 7) before Panc02 inoculation. Data are expressed as mean of tumor surface area ± SEM. There is no significant difference between the two curves (two-way ANOVA followed by a Bonferroni test). (B, left panel) Depletion of NK1.1+ cells. Three groups of C57B6/Jrj mice were treated with anti-NK1.1 Ab (n = 7) or diluent (n = 7) one day before the first DC- injection, or PBS (n = 7). They were all challenged with Panc02 four days after the last iDC-injection. Data are expressed as mean of tumor surface area ± SEM. Comparisons between groups were made by two-way ANOVA followed by a Bonferroni test. (B, right panel). Three groups of C57B6/Jrj mice were anti-NK1.1-treated and iDC-vaccinated (n = 7) or diluent-treated and iDC-vaccinated (n = 6), or PBS-treated as controls (n = 7). They were all challenged with melanoma B16-F0. (**< 0.01; log-rank Mantel-Cox test). (C) IFN-γ production. Spleens were collected 13 days after Panc02 inoculation and 33 days after anti-NK1.1 treatment (at a timepoint where NK1.1+ cells remained depleted). Representative of three experiments.
Figure 8.
Figure 8.
Immune status of anti-NK1.1-treated mice. Spleens from four groups were collected on d16: anti-NK1.1-treated, iDC-vaccinated and Panc02-challenged group; diluent-treated, iDC-vaccinated and Panc02-challenged group; PBS-treated, Panc02-tumor-bearing control group and PBS-treated naïve group. Intracellular expression of granzyme B (A) and TRAIL (B) were determined in CD4+ T-cells, CD8+ T-cells, γδ T-cells, and NK1.1+ cells after 4 days of culture. Value (% of fluorescent cells) of isotype is deduced from that of each corresponding Ab, except for TRAIL+ γδ T-cells.
Figure 9.
Figure 9.
iDC-vaccination in CD8+ T-cell depleted mice. Three groups of nine C57BL/6Jrj mice received one anti-CD8 Ab, or isotype control Ab, or PBS injection, three days before Panc02 inoculation (d0), one injection on d0 and three injections on d3, d9, and d17. Data are expressed as mean tumor surface area ± SEM (left panel). Comparisons between groups were made by two-way ANOVA followed by a Bonferroni test (*< 0.05, **< 0.01, ***< 0.001). Right panel depicts Kaplan-Meier survival curves. (**= 0.005; log-rank Mantel-Cox test).
Figure 10.
Figure 10.
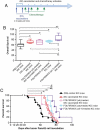
Therapeutic effects of iDC-vaccination and FOLFIRINOX in the Pdx-1-Cre ; LSL-KrasGD12 ;LSL-Trp53R162H mouse model (A) Treatment schedule of iDC-vaccination and FOLFIRINOX. (B) Efficacy of iDC-vaccination alone or in combination with FOLFIRINOX. Five groups of mice were treated with PBS, iDCs, iDCs+ FOLFIRINOX (four injections), FOLFIRINOX alone (four injections), and FOLFIRINOX alone (five to seven injections). Data are pooled from three or more independent experiments. Comparisons of treatment effects on survival were performed using the Wilcoxon-Mann Whitney test. (C) The graph depicts Kaplan-Meier survival curves from the groups cited above. (*< 0.05, **< 0.01; log-rank Mantel-Cox test).

References

    1. Banchereau J, Palucka K.. Immunotherapy: cancer vaccines on the move. Nat Rev Clin Oncol. 2018;15(1):9–10. doi: 10.1038/nrclinonc.2017.149 PMID:28895570. - DOI - PubMed
    1. Topalian SL. Targeting immune checkpoints in cancer therapy. JAMA. 2017;318(17):1647–1648. doi: 10.1001/jama.2017.14155 PMID:28885639. - DOI - PubMed
    1. Rosenberg SA, Restifo NP. Adoptive cell transfer as personalized immunotherapy for human cancer. Science. 2015;348(6230):62–68. doi: 10.1126/science.aaa4967 PMID:25838374. - DOI - PMC - PubMed
    1. Restifo NP, Smyth MJ, Snyder A. Acquired resistance to immunotherapy and future challenges. Nat Rev Cancer. 2016;16(2):121–126. doi: 10.1038/nrc.2016.2 PMID:26822578. - DOI - PMC - PubMed
    1. Kong IC, Flynn JC. Opportunistic autoimmune disorders potentiated by immune-checkpoint inhibitors anti-CTLA-4 and Anti-PD-1. Front Immunol. 2014;5:206. doi: 10.3389/fimmu.2014.00206 PMID: 24904570. - DOI - PMC - PubMed

Publication types