. 2018 Sep 11;7(12):e1509820.
doi: 10.1080/2162402X.2018.1509820. eCollection 2018.

Assessment of PD-L1 expression across breast cancer molecular subtypes, in relation to mutation rate, BRCA1-like status, tumor-infiltrating immune cells and survival

Affiliations

Assessment of PD-L1 expression across breast cancer molecular subtypes, in relation to mutation rate, BRCA1-like status, tumor-infiltrating immune cells and survival

Marcelo Sobral-Leite et al. Oncoimmunology. .

Abstract

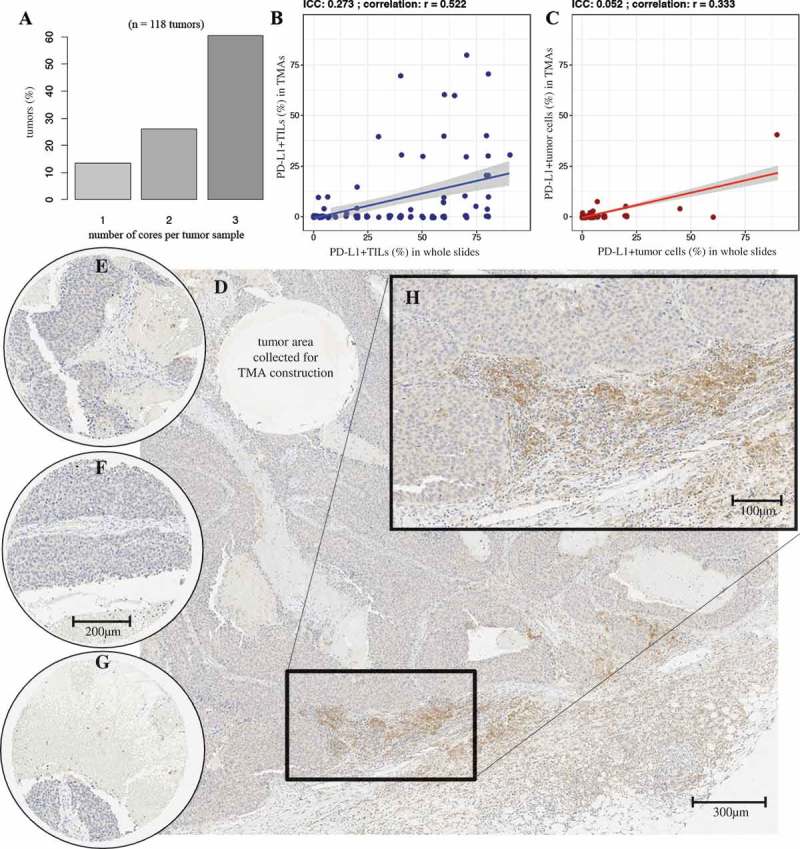
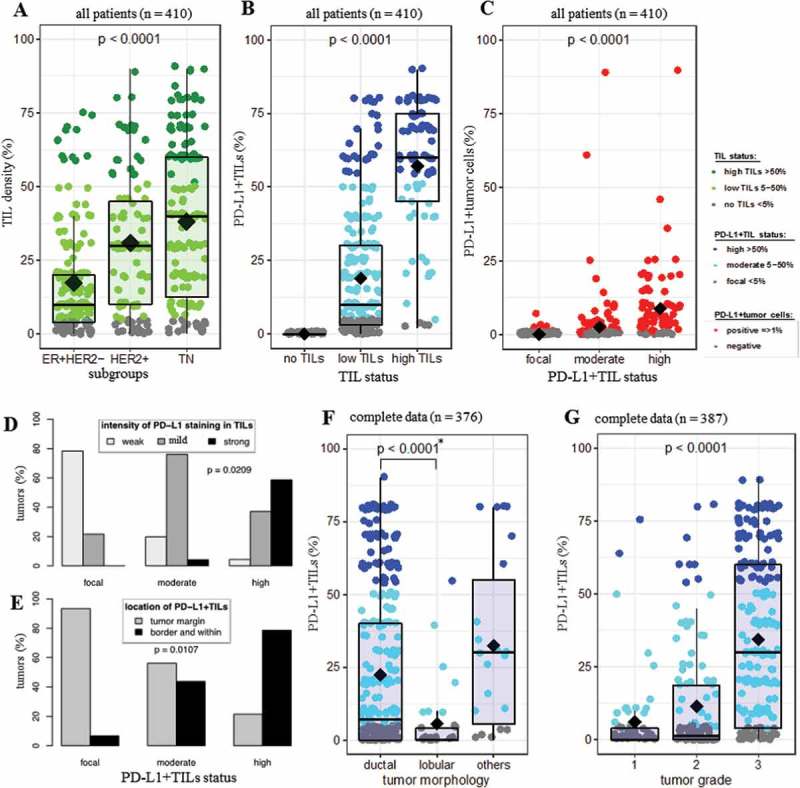
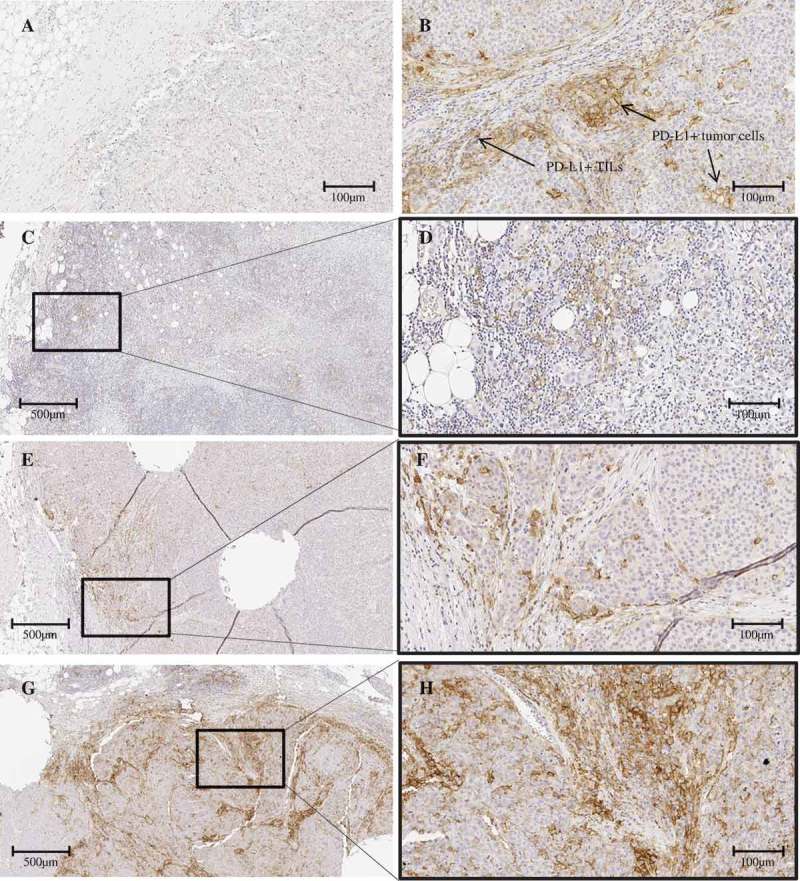
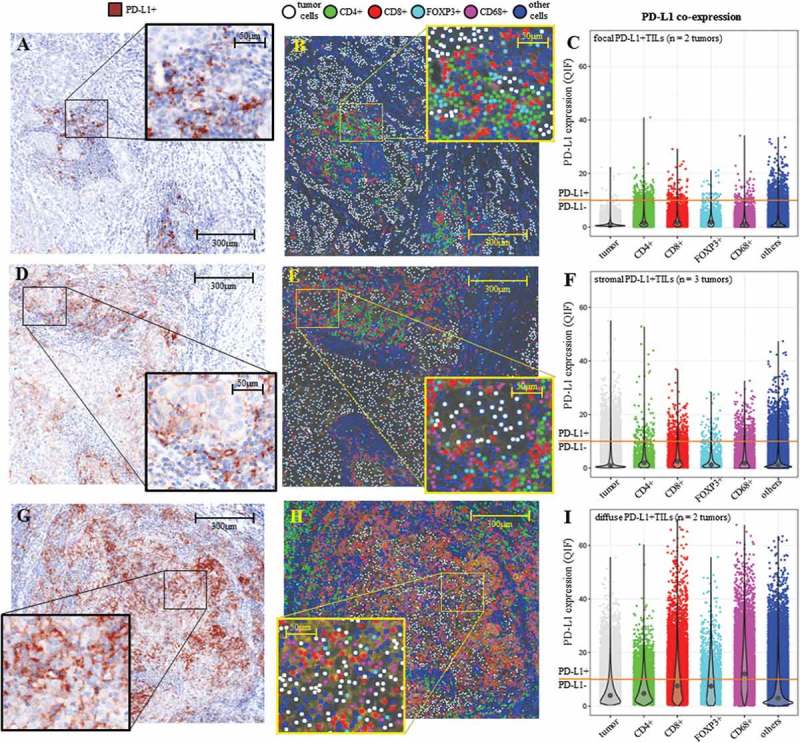
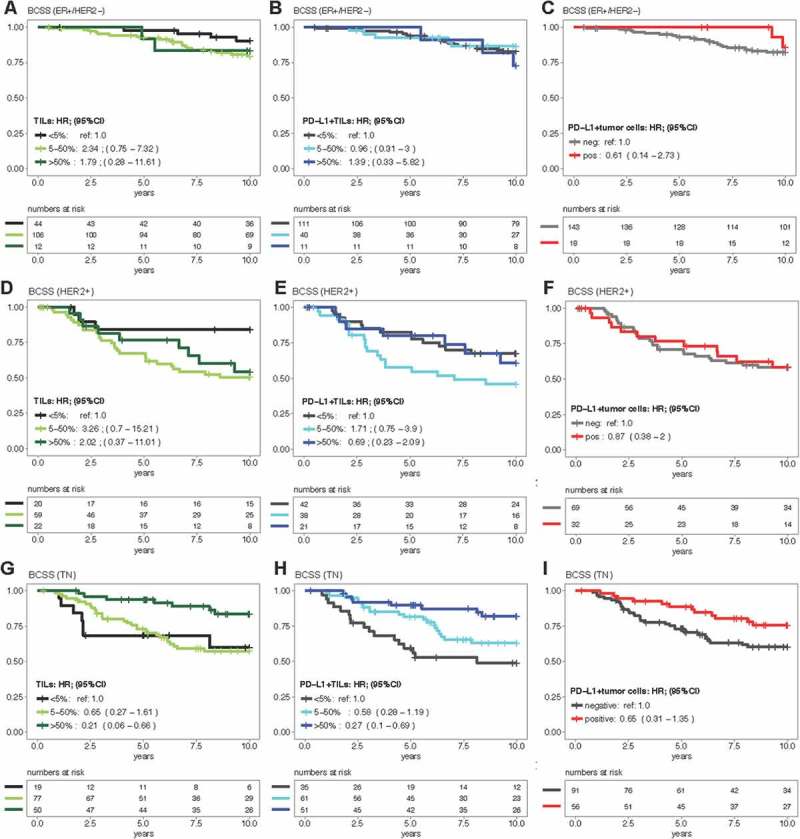
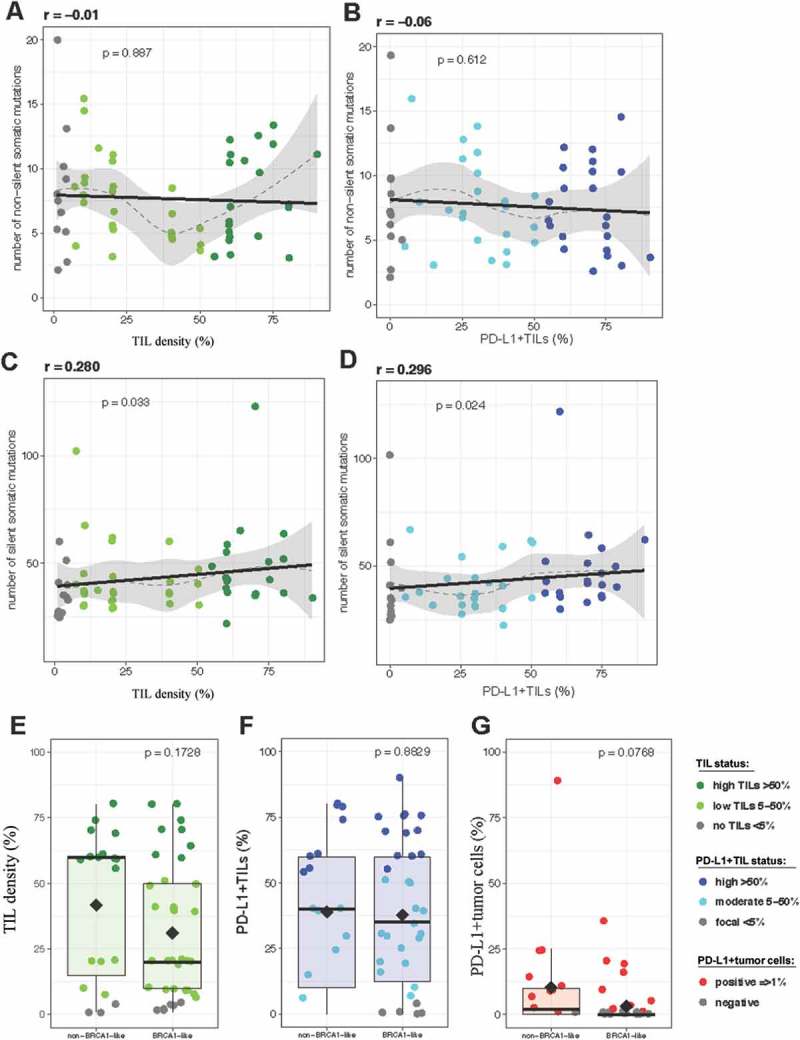
To better understand the expression pattern of programmed death-ligand 1 (PD-L1) expression in different breast cancer types, we characterized PD-L1 expression in tumor and tumor-infiltrating immune cells, in relation to mutation rate, BRCA1-like status and survival. We analyzed 410 primary treatment-naive breast tumors comprising 162 estrogen receptor-positive (ER+) and HER2-, 101 HER2+ and 147 triple-negative (TN) cancers. Pathologists quantified tumor-infiltrating lymphocytes (TILs) and PD-L1 expression in tumor cells and TILs using whole slides and tissue microarray. Mutation rate was assessed by DNA sequencing, BRCA1-like status using multiplex ligation-dependent probe amplification, and immune landscape by multiplex image analyses of CD4, CD68, CD8, FOXP3, cytokeratin, and PD-L1. Half of PD-L1 scores evaluated by tissue microarray were false negatives compared to whole slide evaluations. We observed at least 1% of PD-L1-positive (PD-L1+) cells in 53.1% of ER+HER2-, 73.3% of HER2+, and 84.4% of TN tumors. PD-L1 expression was higher in ductal compared to lobular carcinomas, also within ER+HER2- tumors (p = 0.04). High PD-L1+ TILs score (> 50%) was independently associated with better outcome in TN tumors (HR = 0.27; 95%CI = 0.10-0.69). Within TN tumors, PD-L1 and TIL scores showed a modest but significant positive association with the number of silent mutations, but no association with BRCA1-like status. Multiplex image analyses indicated that PD-L1 is expressed on multiple immune cells (CD68+ macrophages, CD4+, FOXP3+, and CD8+ T cells) in the breast tumor microenvironment, independent of the PD-L1 status of the tumor cells. We found no evidence that levels of PD-L1+ TILs in TN breast cancer are driven by high mutation rate or BRCA1-like status.

Keywords: BRCA1-like; Breast cancer; PD-L1; TILs; mutations.


Figures

Figure 1.
Figure 1.
High number of PD-L1 negative scores were detected using TMAs. In total, 118 tumors from the ONCOPOOL cohort were scored using TMA and whole slides. A) Around 85% of the tumor contributed with 2 or 3 cores of 0.6 mm for the scores using TMA. B) The scores of PDL1+ TILs generated using TMA showed poor correlation with those generated by whole slides observation. C) Comparison of the scores of PD-L1+tumor cells generated by TMA and whole slides also showed poor correlation. D) Example of false negative score obtained by TMA analysis. TMA cores were negative for PD-L1 staining using immunohistochemistry assays (E, F and G); however, the PD-L1 positive cells were located away from the area where the cores were taken for TMA construction. Area of PD-L1+TILs detailed in H. Calculation: intraclass correlation coefficient (ICC) and Spearman correlation (r). Lines in B and C represent the linear correlation; the gray area around the line represents the standard error. Abbreviations: tissue microarray (TMA), PD-L1+tumorinfiltrating lymphocytes (PD-L1+TILs).
Figure 2.
Figure 2.
PD-L1 expression is associated with specific breast tumor characteristics. A) Tumorinfiltrating lymphocyte (TIL) density was higher in TN tumors. B) PD-L1+TIL score increased according to the higher status of TILs. C) PD-L1+tumor cells were more frequent in tumors with high PD-L1+TILs. Tumors classified as high PD-L1+TILs had a stronger intensity of staining (D) and were predominantly located at the border and within the tumor margins (E), compared with tumors classified as focal and moderate PD-L1+TILs. F) Lobular carcinomas had lower levels of PD-L1+TILs compared with ductal carcinomas. G) Tumor-infiltration of PD-L1+lymphocytes were more extensive in high grade tumors. The average mean of each distribution is represented by a lozenge. Comparisons of means were tested by ANOVA. (*) Comparison between the means of ductal and lobular groups by Student's t-test. Categorical levels of each score are defined in the legend and represented by degrees of green (%TIL density), blue (%PD-L1+TILs) or red (%PDL1+ tumor cells). Abbreviations: estrogen receptor (ER), tumor-infiltrating lymphocytes (TILs).
Figure 3.
Figure 3.
Representative examples of the expression of PD-L1 in primary breast tumors: A) immune desert tumor; B) PD-L1+tumor-infiltrating lymphocytes (PD-L1+TILs) surrounded by few tumor cells with membranous PD-L1 staining. C) Tumor showing lymphocytes aggregated in the stroma, exhibiting focal PD-L1+TILs (i); detailed in D. E) Tumor showing moderate PD-L1 expression in TILs nearby the tumor invasive edge, but without PD-L1+tumor cells (ii); detailed in F. G) Example of extensive immune infiltration (stromal and intratumoral), diffuse and intense PD-L1 expression in TILs and few tumor cells (iii); detailed in H.
Figure 4.
Figure 4.
Distribution of PD-L1 expression among the immune cell types. Bright field images of PD-L1 immunofluorescent staining of three different immune infiltration patterns and PD–L1+TIL status were selected: i) lymphocytic aggregates/focal PD-L1+TILs in A), ii) stromal PD-L1+TILs at the invasive margins in D) and iii) diffuse/intratumoral PD-L1+TIL infiltration in G). Areas containing tumor cells and adjacent microenvironment were detailed. Color-based maps of these areas revealed the single-cell phenotype in the image generated by imaging analysis software (C, F and H): tumor cells (white); CD4 (green), CD8 (red), FOXP3 (cyan), CD68 (magenta), and other cells (blue). Distribution of the quantitative immunofluorescence (QIF) of PD-L1 expression, per cell phenotype, revealed the proportion of PD-L1+cells in each tumor. Orange lines correspond to the threshold for PD-L1 classification as negative (QIF < 7) or positive (QIF ≥ 7). Violin plots show the distribution and mean of PD-L1 QIF scores per cell phenotype. Cells classified as ‘others’ represent other cell types in the stroma compartment that could not be phenotype due the lack of specific markers.
Figure 5.
Figure 5.
Association between PD-L1 expression and breast cancer specific survival (BCSS). Kaplan–Meier curves, the numbers at risk and adjusted hazard ratios (HR) of the categories of tumorinfiltrating lymphocytes (TILs), PD-L1+TILs, and PD-L1+tumor cells in ER+HER2− (A, B and C), HER2+ (D, E and F), and triple-negative (TN) tumors (G, H, I). HR based on Cox multivariable regression models were adjusted for: age at diagnosis, pathological features and adjuvant treatments (as described in the methods). Abbreviations: breast cancer specific survival (BCSS), hazard ratios (HR), 95% confidence interval (95%CI), estrogen receptor (ER), triple-negative (TN) and tumor-infiltrating lymphocytes (TILs).
Figure 6.
Figure 6.
Mutational load and BRCA1-like status in triple-negative (TN) breast cancer (n=56). No correlation was found between the number of nonsilent somatic mutations and percentage of tumor-infiltrating lymphocyte (TIL) density (A) or percentage of PD-L1+TILs (B). Silent somatic mutations wereweakly positive associated with TIL density (C) and percentage of PD-L1+TILs (D). No difference in TIL density (E), percentage of PD-L1+TILs (F) or PDL1+ tumor cells (G) was found between non-BRCA1-like and BRCA1-like tumors. Spearman’s coefficient (r) and its statistical significance (p) were used asstatistical test. Dashed lines in the graphs represent the estimation of the smoothedconditional mean between the points in the graph. The gray area around the line isthe estimated standard error of the smoothed mean. Linear correlation is plotted in black. Comparisons of means between two groups were examined by Student's ttest Abbreviations: percentage (%) and tumor-infiltrating lymphocytes (TILs).

References

    1. Savas P, Salgado R, Denkert C, Sotiriou C, Darcy PK, Smyth MJ, Loi S.. Clinical relevance of host immunity in breast cancer: from TILs to the clinic. Nat Rev Clin Oncol. 2016;13:228–241. PMID:26667975. doi: 10.1038/nrclinonc.2015.215. - DOI - PubMed
    1. Dieci MV, Griguolo G, Miglietta F, Guarneri V. The immune system and hormone-receptor positive breast cancer: is it really a dead end? Cancer Treatment Reviews. 2016;46:9–19. PMID:27055087. doi: 10.1016/j.ctrv.2016.03.011. - DOI - PubMed
    1. Chen DS, Mellman I. Elements of cancer immunity and the cancer-immune set point. Nature. 2017;541:321–330. PMID:28102259. doi: 10.1038/nature21349. - DOI - PubMed
    1. Freeman GJ, Long AJ, Iwai Y, Bourque K, Chernova T, Nishimura H, Fitz LJ, Malenkovich N, Okazaki T, Byrne MC, et al. Engagement of the PD-1 immunoinhibitory receptor by a novel B7 family member leads to negative regulation of lymphocyte activation. The Journal of Experimental Medicine. 2000;192:10.1084/jem.192.7.102727–34 PMID:11015443. - PMC - PubMed
    1. Okazaki T, The HT. PD-1-PD-L pathway in immunological tolerance. Trends in Immunology. 2006;27:195–201. PMID:16500147. doi: 10.1016/j.it.2006.02.001. - DOI - PubMed

Publication types