. 2018 Oct 19;7(12):e1526613.
doi: 10.1080/2162402X.2018.1526613. eCollection 2018.

Integrated analysis of the immunological and genetic status in and across cancer types: impact of mutational signatures beyond tumor mutational burden

Affiliations

Integrated analysis of the immunological and genetic status in and across cancer types: impact of mutational signatures beyond tumor mutational burden

Jan Budczies et al. Oncoimmunology. .

Abstract

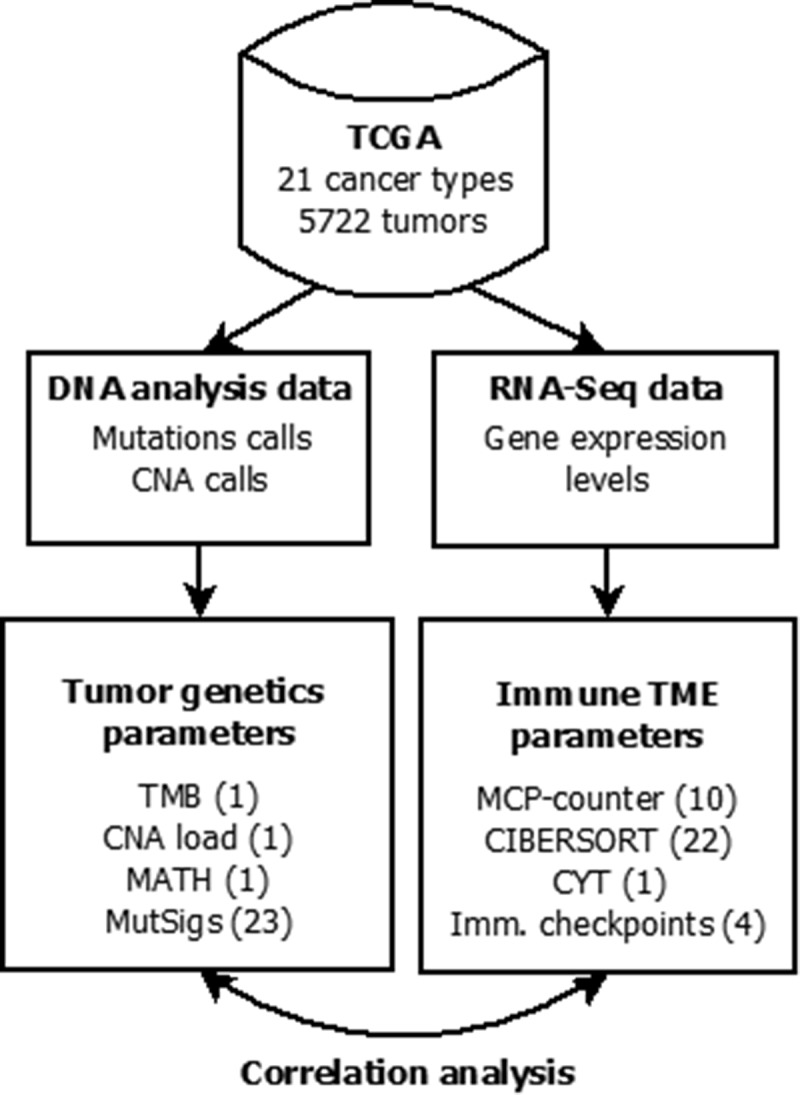
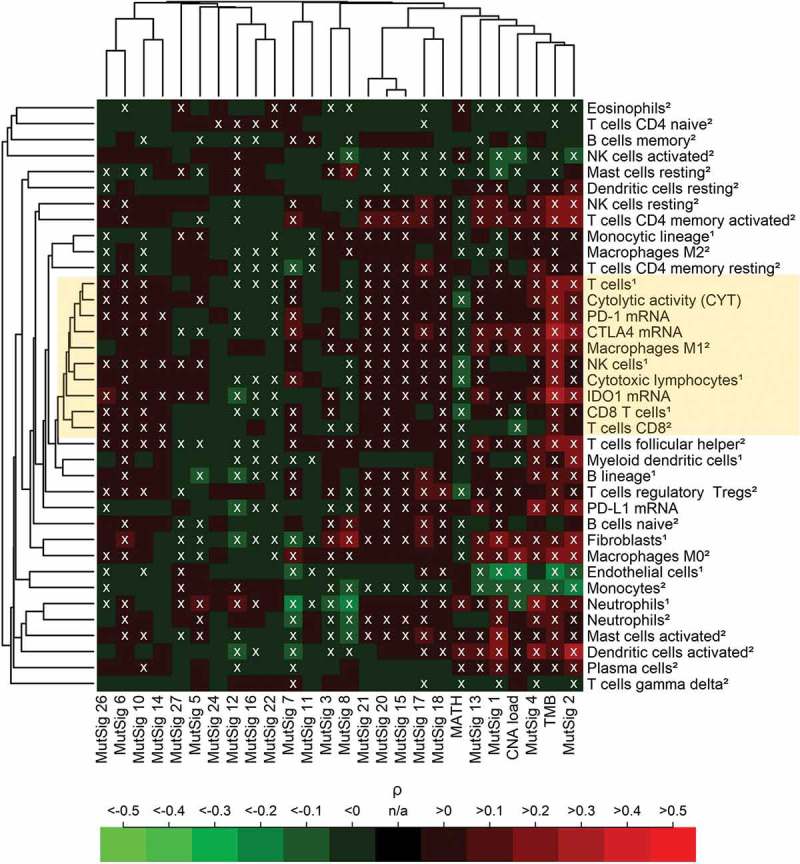
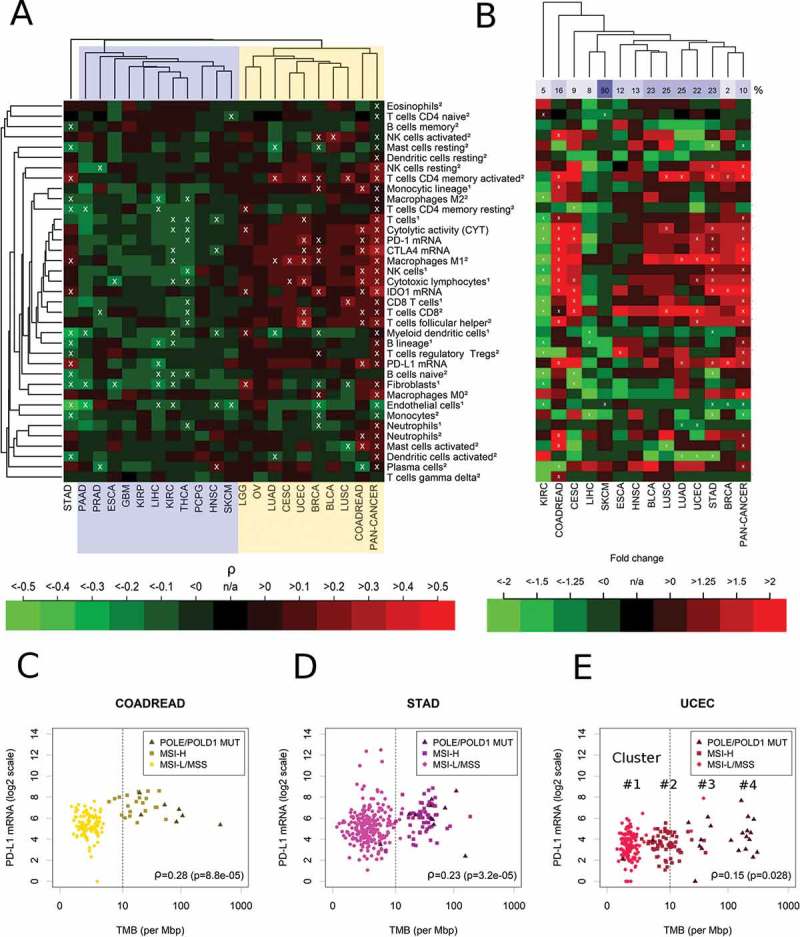
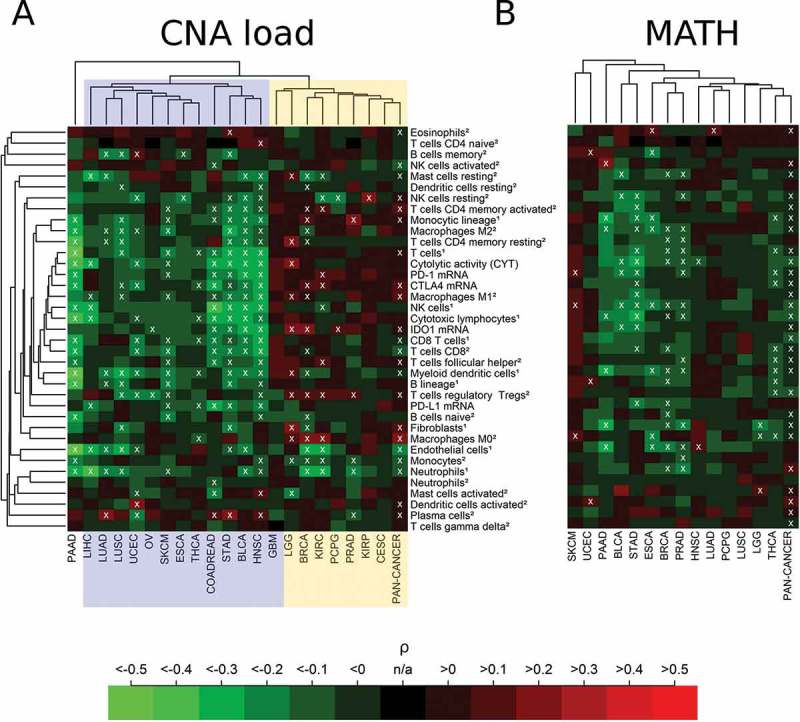
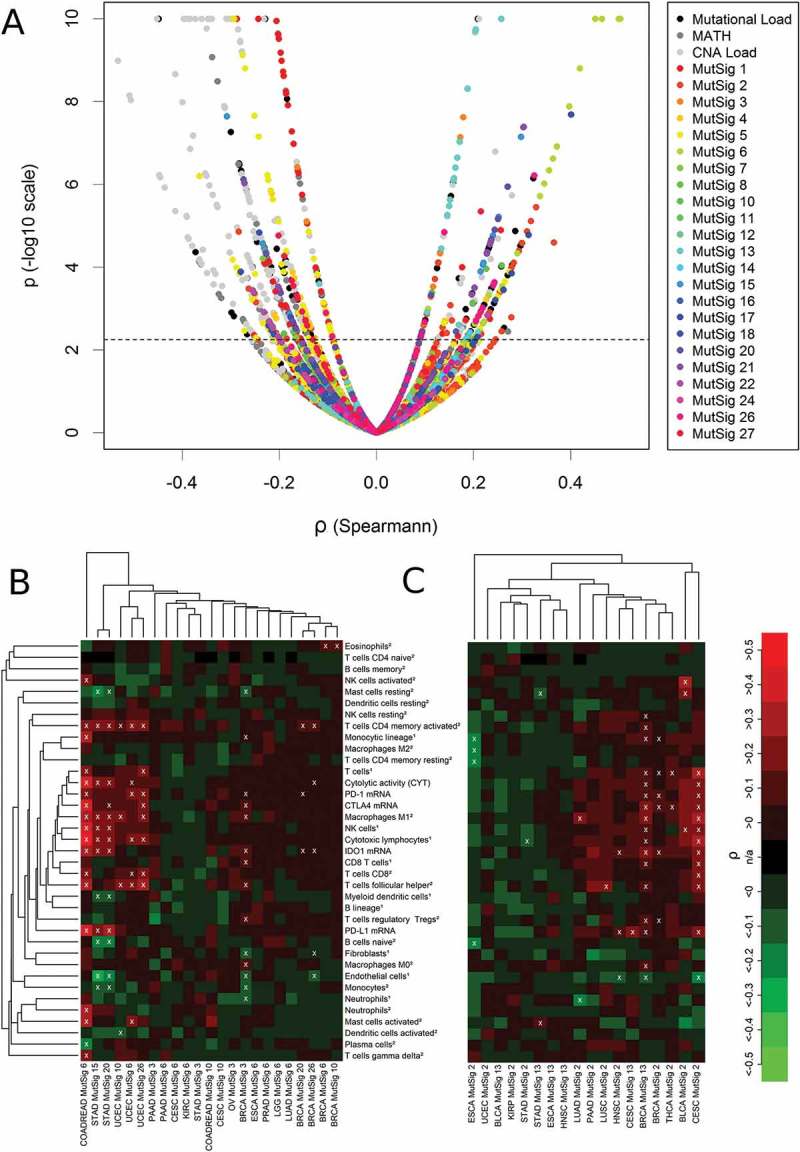
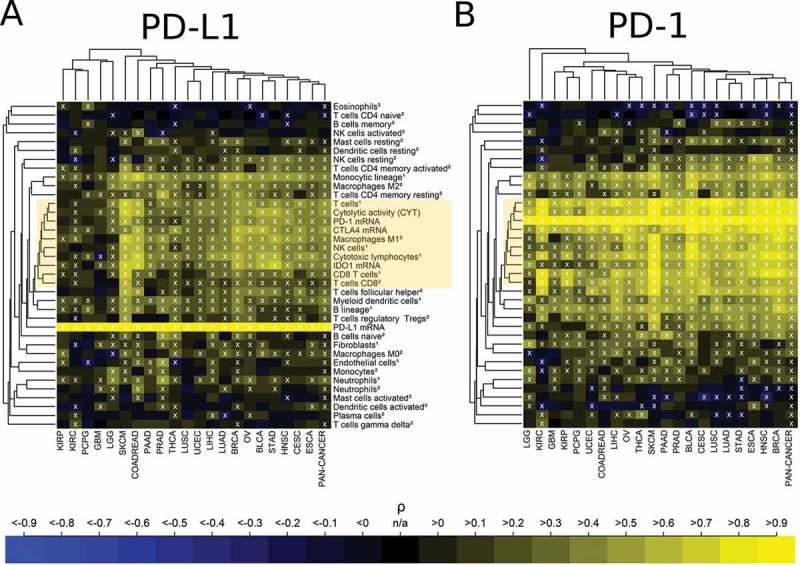
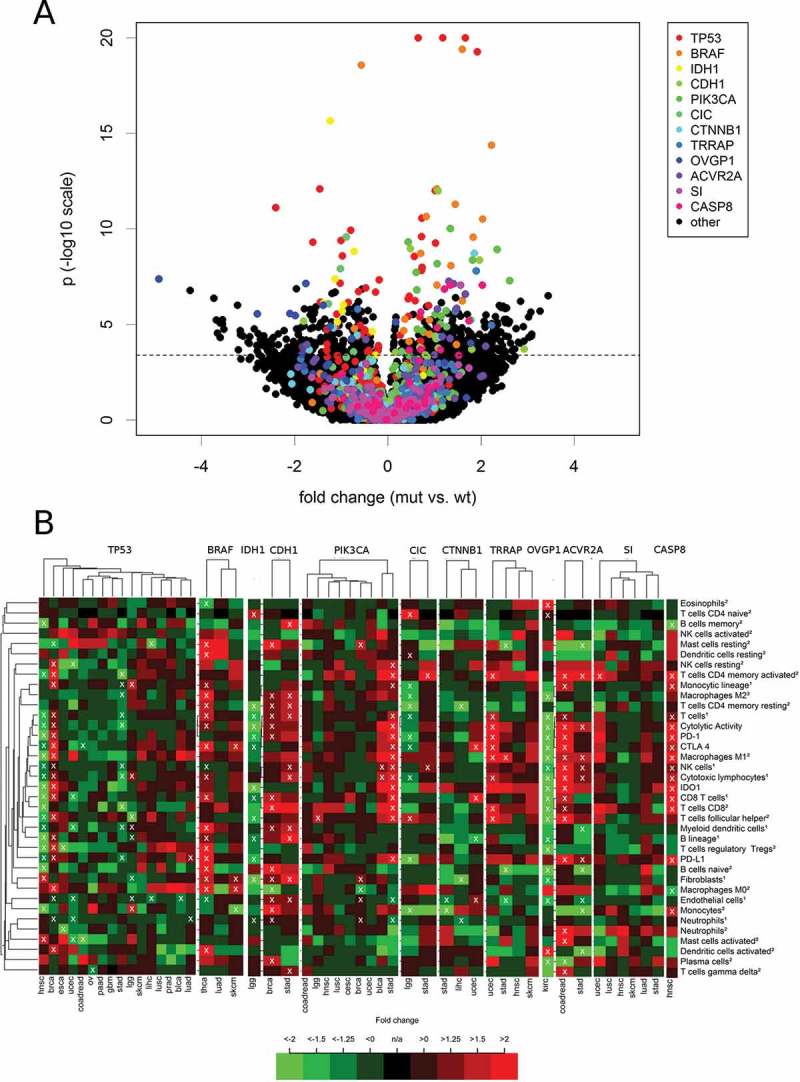
Harnessing the immune system by checkpoint blockade has greatly expanded the therapeutic options for advanced cancer. Since the efficacy of immunotherapies is influenced by the molecular make-up of the tumor and its crosstalk with the immune system, comprehensive analysis of genetic and immunologic tumor characteristics is essential to gain insight into mechanisms of therapy response and resistance. We investigated the association of immune cell contexture and tumor genetics including tumor mutational burden (TMB), copy number alteration (CNA) load, mutant allele heterogeneity (MATH) and specific mutational signatures (MutSigs) using TCGA data of 5722 tumor samples from 21 cancer types. Among all genetic variables, MutSigs associated with DNA repair deficiency and AID/APOBEC gene activity showed the strongest positive correlations with immune parameters. For smoking-related and UV-light-exposure associated MutSigs a few positive correlations were identified, while MutSig 1 (clock-like process) correlated non-significantly or negatively with the major immune parameters in most cancer types. High TMB was associated with high immune cell infiltrates in some but not all cancer types, in contrast, high CNA load and high MATH were mostly associated with low immune cell infiltrates. While a bi- or multimodal distribution of TMB was observed in colorectal, stomach and endometrial cancer where its levels were associated with POLE/POLD1 mutations and MSI status, TMB was unimodal distributed in the most other cancer types including NSCLC and melanoma. In summary, this study uncovered specific genetic-immunology associations in major cancer types and suggests that mutational signatures should be further investigated as interesting candidates for response prediction beyond TMB.

Keywords: Immuno-oncology; PD-L1; immune checkpoints; mutational signatures; tumor mutational burden.


Figures

Figure 1.
Figure 1.
Flowchart of data collection and analysis (number of investigated parameters in brackets). Mutation calls, copy number alteration (CNA) and gene expression data were obtained from the cBioPortal. Tumor mutational burden (TMB) and mutant allele tumor heterogeneity (MATH) were calculated from the mutation calls, CNA load was calculated from the GISTIC CNA calls and levels of mutational signatures were obtained from.32 The abundance of cell populations in the tumor microenvironment (TME) was estimated from bulk tissue gene expression data using the bioinformatic methods MCP-counter and CIBERSORT. Cytolytic activity (CYT) as well as PD-L1, PD-1, CTLA4 and IDO1 mRNA expression were also obtained from the bulk tissue gene expression data. Correlation analysis of 37 parameters of TME (35 immunological variables and two non-immunological variables) with 26 parameters of tumor genetics was performed.
Figure 2.
Figure 2.
Pan-cancer (5722 tumors spanning 21 cancer types) correlation analysis of 37 TME parameters (including 35 immunological variables and two non-immunological cell populations) with 26 tumor genetic variables. A core cluster of immunological variables (T cells, CYT, M1 macrophages, NK cells, cytotoxic lymphocytes, CD8 + T cells as well as PD-1, CTLA4 and IDO1 expression) clustered tightly together (yellow box). In the heatmap, 37% of the correlations were significantly positive, 21% were significantly negative (white crosses, FDR< 5%). The abundance of cell populations was estimated by MCP-counter1 and CIBERSORT2. DNA repair deficiency related MutSigs: 3, 6, 10, 15, 20 and 26. APOBEC related MutSigs: 2 and 13.
Figure 3.
Figure 3.
Immune correlates of TMB in 21 specific cancer types and in the combined pan-cancer cohort. (A) Separation of cancer types in a cluster showing non-significant or negative correlations of TMB with the immune variables (cluster I, blue) and a cluster showing significant positive correlations (cluster II, yellow). Overall, 9% of the correlations were significantly positive, 9% were significantly negative (white crosses, FDR< 5%). (B) Fold changes of hypermutated (TMB ≥ 10 mut/Mb) vs. normal mutated (TMB < 10 mut/Mb) tumors. 13% of the correlations were significantly positive, 7% were significantly negative (white crosses, FDR< 5%). (C) Highly significant correlation of PD-L1 mRNA and TMB in colorectal cancer (COAD). (D) Highly significant correlation of PD-L1 mRNA and TMB in stomach adenocarcinoma (STAD). (E) Significant correlation of TMB and PD-L1 mRNA in uterine corpus endometrial carcinoma (UCEC). The abundance of cell populations was estimated by MCP-counter1 and CIBERSORT2.
Figure 4.
Figure 4.
Immune correlates of CNA load and MATH in 21 cancer types and in the combined pan-cancer cohort. (A) Separation of cancer types showing a cluster of significant negative correlations of CNA load with the immune variables (cluster I, blue) and a cluster showing significant positive or non-significant correlations (cluster II, yellow). Overall, 6% of the correlations were significantly positive, 25% were significantly negative (white crosses, FDR< 5%). (B) Negative or non-significant correlation of MATH with immune variables in almost all cancer types (except SKCM). 3% of the correlations were significantly positive, 18% were significantly negative (white crosses, FDR< 5%). The abundance of cell populations was estimated by MCP-counter1 and CIBERSORT2.
Figure 5.
Figure 5.
Correlations analysis of 37 TME parameters with 26 genetic variables in 21 cancer types. (A) Volcano plot showing 551 significant (above dashed line, FDR< 5%) correlations out of a total number of 5346 analyses. (B) Correlation of immunological variables with mutational signatures associated with failure of DNA repair (MutSigs 6, 15, 20, 26: defective mismatch repair; MutSig 3: defective double strand repair by HR; MutSig 10: POLE mutations): 8% of the correlations were significantly positive, 2% were significantly negative (white crosses, FDR< 5%). (C) Correlation of immunological variables with mutational signatures associated with activity of the AID/APOBEC family of cytidine deaminases: 7% of the correlations were significantly positive, 2% were significantly negative (white crosses, FDR< 5%). The abundance of cell populations was estimated by MCP-counter1 and CIBERSORT2.
Figure 6.
Figure 6.
Association of high immune checkpoint expression with the presence of immune cell infiltrates. (A) Strong positive correlation of PD-L1 expression with the immune variables in the central immune signature (CIS, yellow box). 60% of the correlations were significantly positive, 3% were significantly negative (white crosses, FDR< 5%). (B) Very strong positive correlation of PD-1 expression with the immune variables in the central immune signature (CIS, yellow box). 69% of the correlations were significantly positive, 6% were significantly negative (white crosses, FDR< 5%). The abundance of cell populations was estimated by MCP-counter1 and CIBERSORT2.
Figure 7.
Figure 7.
Association of the levels of 37 TME parameters with mutations in specific genes. For each cancer type, all genes that were mutated in at least 20 tumors were included in the analysis. (A) Volcano plot with rainbow colors highlighting the twelve top genes (TP53, BRAF, IDH1, CDH1, PIK3CA, CIC, CTNNB1, TRRAP, OVGP1, ACVR2A, SI CASP8) that correlated highly significant (p < 1.0E-07) with at least one immune variables in at least one cancer type. (B) Heatmaps showing the fold change (mut vs. wt tumors) pattern of the twelve top genes in the cancer types with at least ten mutated tumors.

References

    1. Ribas A, Wolchok JD.. Cancer immunotherapy using checkpoint blockade. Science. 2018;359(6382);1350–1355. doi:10.1126/science.aar4060. - DOI - PMC - PubMed
    1. Pardoll DM. The blockade of immune checkpoints in cancer immunotherapy. Nat Rev Cancer. 2012;12(4);252–264. doi:10.1038/nrc3239. - DOI - PMC - PubMed
    1. Vanpouille-Box C, Lhuillier C, Bezu L, Aranda F, Yamazaki T, Kepp O, Fucikova J, Spisek R, Demaria S, Formenti SC, et al Trial watch: immune checkpoint blockers for cancer therapy. Oncoimmunology. 2017;6(11):e1373237. doi:10.1080/2162402X.2017.1373237. - DOI - PMC - PubMed
    1. McDermott D, Lebbe C, Hodi FS, Maio M, Weber JS, Wolchok JD, Thompson JA, Balch CM. Durable benefit and the potential for long-term survival with immunotherapy in advanced melanoma. Cancer Treat Rev. 2014;40(9);1056–1064. doi:10.1016/j.ctrv.2014.06.012. - DOI - PubMed
    1. Kroemer G, Galluzzi L. Combinatorial immunotherapy with checkpoint blockers solves the problem of metastatic melanoma-An exclamation sign with a question mark. Oncoimmunology. 2015;4(7);e1058037. doi:10.1080/2162402X.2015.1008371. - DOI - PMC - PubMed

Publication types