. 2018 Nov 22:8:404.
doi: 10.3389/fcimb.2018.00404. eCollection 2018.

An Experimental Pipeline for Initial Characterization of Bacterial Type III Secretion System Inhibitor Mode of Action Using Enteropathogenic Yersinia

Affiliations

An Experimental Pipeline for Initial Characterization of Bacterial Type III Secretion System Inhibitor Mode of Action Using Enteropathogenic Yersinia

Jessica M Morgan et al. Front Cell Infect Microbiol. .

Abstract

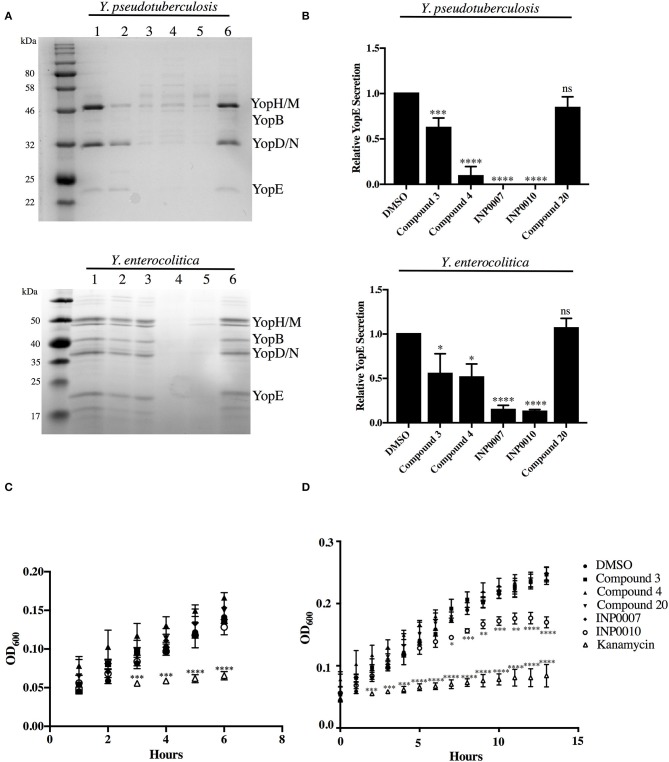
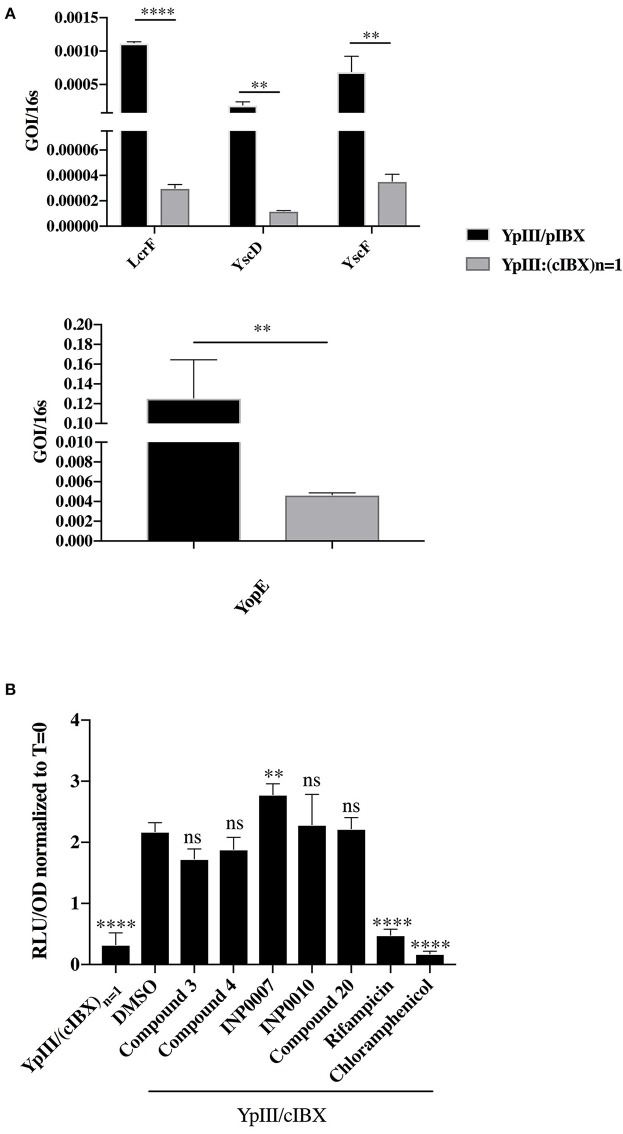
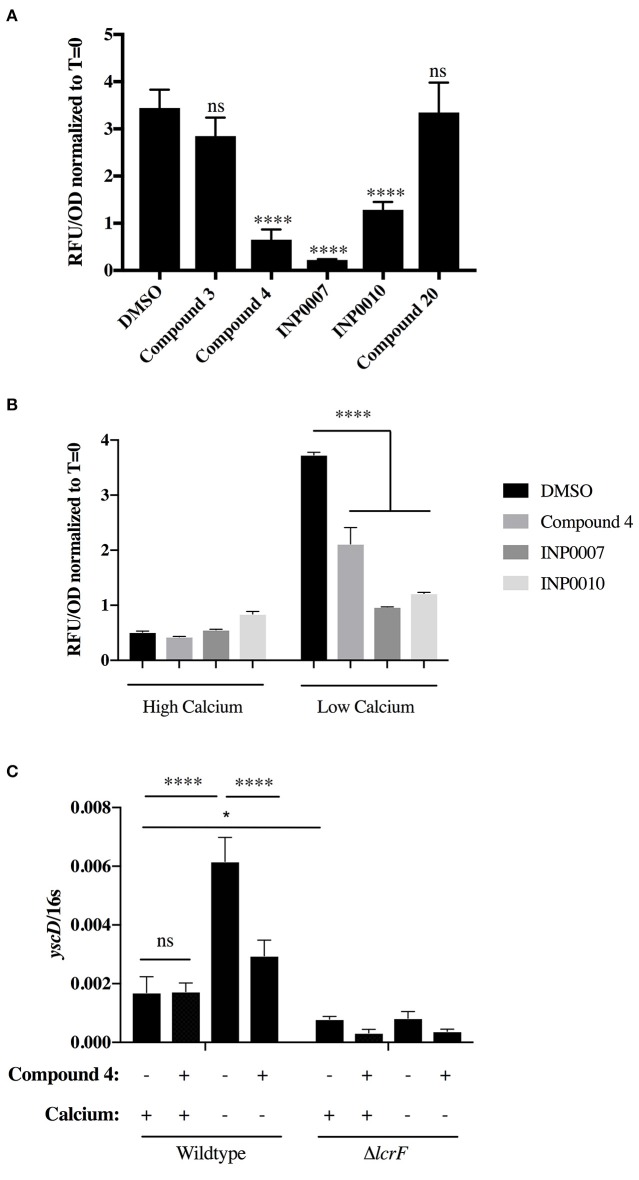
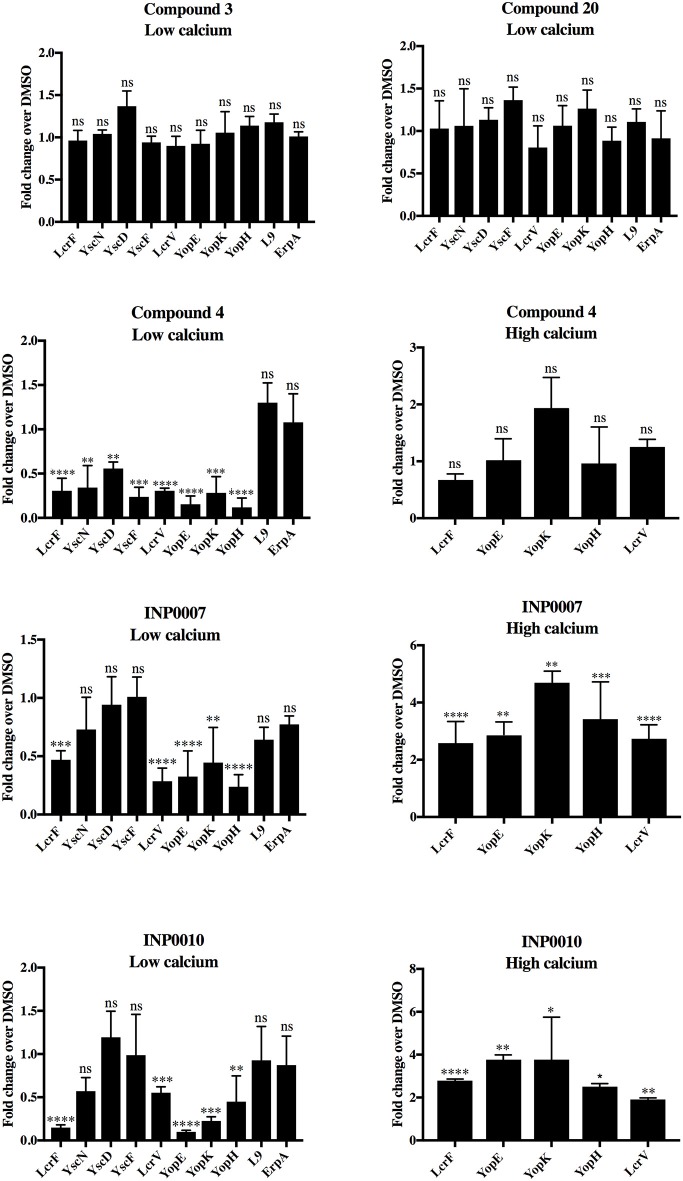
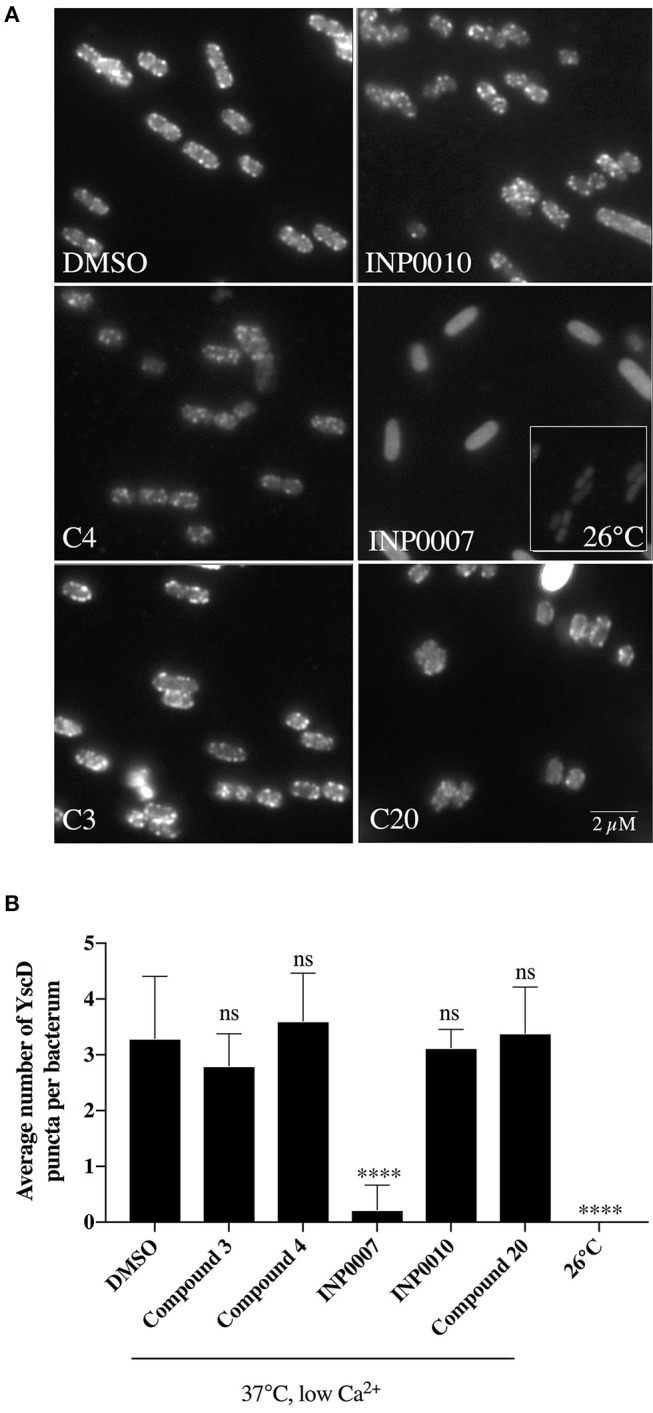
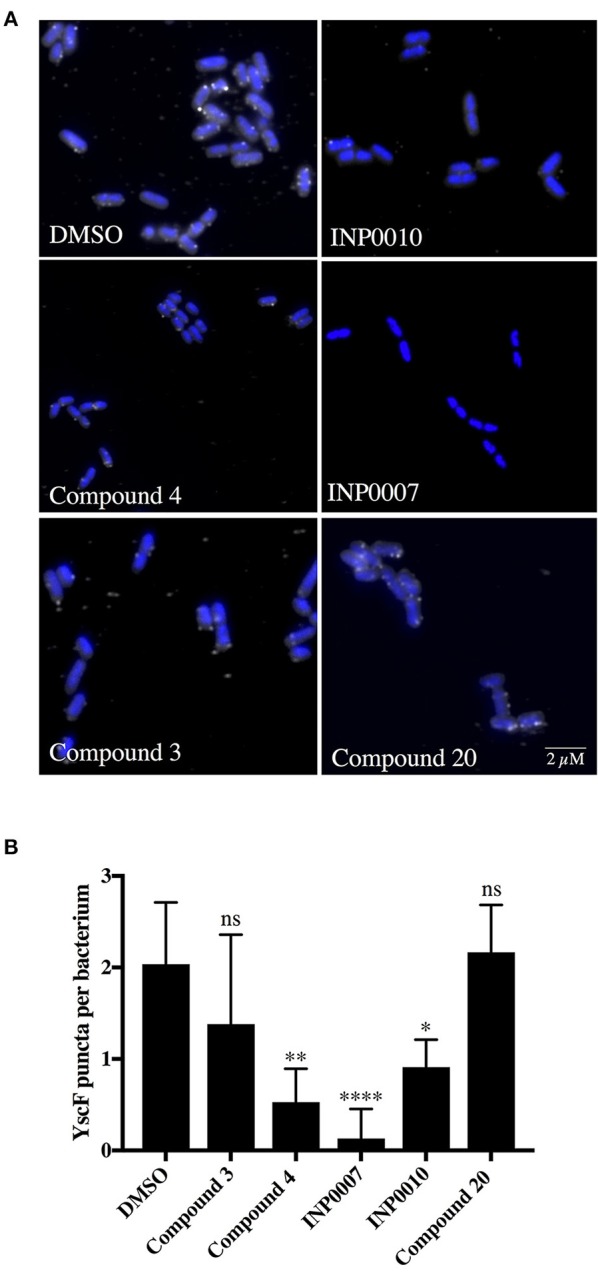
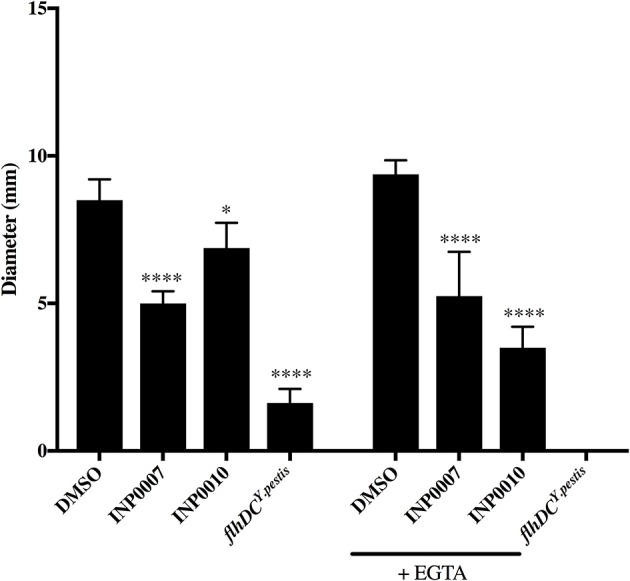
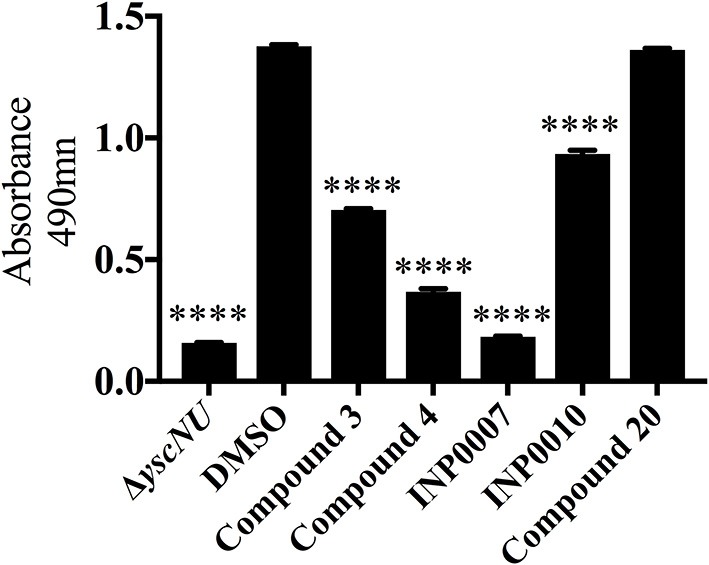
Dozens of Gram negative pathogens use one or more type III secretion systems (T3SS) to disarm host defenses or occupy a beneficial niche during infection of a host organism. While the T3SS represents an attractive drug target and dozens of compounds with T3SS inhibitory activity have been identified, few T3SS inhibitors have been validated and mode of action determined. One issue is the lack of standardized orthogonal assays following high throughput screening. Using a training set of commercially available compounds previously shown to possess T3SS inhibitory activity, we demonstrate the utility of an experiment pipeline comprised of six distinct assays to assess the stages of type III secretion impacted: T3SS gene copy number, T3SS gene expression, T3SS basal body and needle assembly, secretion of cargo through the T3SS, and translocation of T3SS effector proteins into host cells. We used enteropathogenic Yersinia as the workhorse T3SS-expressing model organisms for this experimental pipeline, as Yersinia is sensitive to all T3SS inhibitors we tested, including those active against other T3SS-expressing pathogens. We find that this experimental pipeline is capable of rapidly distinguishing between T3SS inhibitors that interrupt the process of type III secretion at different points in T3SS assembly and function. For example, our data suggests that Compound 3, a malic diamide, blocks either activity of the assembled T3SS or alters the structure of the T3SS in a way that blocks T3SS cargo secretion but not antibody recognition of the T3SS needle. In contrast, our data predicts that Compound 4, a haloid-containing sulfonamidobenzamide, disrupts T3SS needle subunit secretion or assembly. Furthermore, we suggest that misregulation of copy number control of the pYV virulence plasmid, which encodes the Yersinia T3SS, should be considered as a possible mode of action for compounds with T3SS inhibitory activity against Yersinia.

Keywords: T3SS; T3SS inhibitor; Yersinia; pYV; type III secretion system.


Figures

Figure 1
Figure 1
Efficiency of T3SS effector protein secretion and bacterial growth in the presence of T3SS inhibitors. (A,B) The relative efficiency of effector protein secretion into the culture supernatant was analyzed following bacterial growth for 2 h under T3SS-inducing conditions in the presence of either 50 μM compound or equivalent volume of DMSO. (A) The secretome of Y. pseudotuberculosis IP2666 and Y. enterocolitica 8081 was precipitated with trichloroacetic acid, separated by SDS-PAGE, and visualized by staining with Coomassie blue. Samples were normalized to culture optical density. (1) DMSO, (2) Compound 3, (3) Compound 4, (4) INP0007, (5) INP0010, (6) Compound 20. (B) Quantification of the YopE protein band by densitometry relative to the DMSO control. The average of 3 (Y. pseudotuberculosis) or 4 (Y. enterocolitica) biological replicates ± standard deviation is shown. (C,D) Y. pseudotuberculosis IP2666 growth at 26°C in the presence of 50 μM compound or DMSO was tracked by measuring optical density. The average of three biological replicates ± standard deviation is shown and statistical significance is represented comparing compounds relative to the DMSO control. *P < 0.03; **P < 0.004; ****P < 0.0001; ***P < 0.0007 (one way ANOVA with Dunnett's post-hoc test).
Figure 2
Figure 2
Correlation between pYV copy number and T3SS gene expression. (A) Y. pseudotuberculosis encoding luciferase genes on pYV (YPIII/pIBX) or a strain in which pYV-encoded T3SS and luciferase genes were incorporated into the chromosome in single copy [YPIII/(cIBX)n = 1] were grown for 3 h under T3SS-inducing conditions in 50 μM compound or equivalent volume of DMSO and T3SS gene expression evaluated by qPCR. GOI, gene of interest. Expression levels were normalized to 16s rRNA and then the fold change compared to DMSO calculated [(GOIcompound/16scompound)/(GOIDMSO/16sDMSO)]. The average of four biological replicates ± standard deviation is shown. ****P < 0.0001, **P < 0.008 (Student T-test). (B) Y. pseudotuberculosis YpIII/pIBX and YPIII/(cIBX)n = 1 were grown under T3SS-inducing conditions for 3 h in 50 μM compound or equivalent volume of DMSO and luminescence measured as a readout of pYV gene copy number. The average of four biological replicates ± standard deviation is shown and statistical significance is represented comparing compounds relative to the DMSO control. ****P < 0.0001; **P = 0.008 (one way ANOVA with Dunnett's post-hoc test).
Figure 3
Figure 3
Analysis of yopH-mCherry fluorescence to assess T3SS gene expression. (A,B) Y. pseudotuberculosis pyopH FLAG mCherry was grown under T3SS-inducing (A,B, low calcium) or non-inducing (B, high calcium) conditions and relative mCherry fluorescence measured at 3 h after addition of 50 μM compound or equivalent volume of DMSO. The average of three biological replicates ± standard deviation is shown and statistical significance is represented comparing compounds relative to the DMSO control. ****P < 0.0001 (one way ANOVA with Dunnett's post-hoc test). (C) Y. pseudotuberculosis wildtype or ΔlcrF were grown in low or high calcium media for 3 h in 50 μM Compound 4 or equivalent volume of DMSO and yscD mRNA levels measured by qPCR. Expression levels were normalized to 16s rRNA. Statistical significance is represented comparing the indicated pairs of conditions. ****P < 0.0001, *P < 0.002 (Student t-test).
Figure 4
Figure 4
T3SS gene mRNA levels under low and high calcium conditions. Wildtype Y. pseudotuberculosis was grown under high or low calcium conditions in the presence of 50 μM compound or equivalent volume of DMSO and mRNA levels of T3SS (lcrF, yscN, yscD, yscF, lcrV, yopE, yopK, yopH) and non-T3SS genes (L9, erpA) assessed by qPCR. The average of four biological replicates ± standard deviation is shown and statistical significance is represented comparing compounds relative to the DMSO control for each gene. ****P < 0.0001, ***P < 0.0005, **P < 0.003; *P < 0.022 (one way ANOVA with Dunnett's post-hoc test). ns, not significant.
Figure 5
Figure 5
YscD-EGFP puncta formation in Y. enterocolitica. Y. enterocolitica pYV40-EGFP-yscD was grown under T3SS-inducing conditions for 3 h in the presence of 50 μM compound or equivalent volume of DMSO and fluorescent foci quantified using IMARIS software. Representative images (A) and the average number of foci ± standard deviation per cell (B) are shown from three biological replicates, with N > 2,000 cells quantified per condition. Statistical significance is represented comparing compounds relative to the DMSO control. ****P < 0.008 (one way ANOVA with Dunnett's post-hoc test).
Figure 6
Figure 6
YscF puncta visualization in Y. pseudotuberculosis using immunofluorescence. Wildtype Y. pseudotuberculosis was grown under T3SS-inducing conditions for 3 h in 50 μM compound or equivalent volume of DMSO and an anti-YscF antibody used to visualize T3SS needles. (A) Representative confocal microscopy images and (B) the average number of YscF puncta per bacterium from three biological replicates ± the standard deviation are shown, with N > 1,500 bacteria quantified per condition. Statistical significance is represented comparing compounds relative to the DMSO control. ****P < 0.0001, **P < 0.002, *P < 0.04 (one way ANOVA with Dunnett's post-hoc test).
Figure 7
Figure 7
INP0007 and INP0010 inhibit Y. pseudotuberculosis motility. Y. pseudotuberculosis wildtype or the non-motile flhDCY.pestis mutant were spotted onto motility agar containing the 50 μM compounds or the equivalent volume of DMSO and allowed to grow for ~24 h. Average swimming diameter of the colony was measured from three biological replicates ± standard deviation and statistical significance is represented comparing compounds relative to the DMSO control. ****P < 0.0001, *P < 0.03 (one way ANOVA with Dunnett's post-hoc test).
Figure 8
Figure 8
Secretion of YopM-Bla into the culture supernatant. Y. pseudotuberculosis Δyop6 expressing the Yop reporter YopM-Bla were grown under T3SS-inducing in vitro conditions for 2 h in the presence of 50 μM compound or equivalent volumes of DMSO and cleavage of the β-lactamase substrate nitrocefin used to measure the relative quantity of secreted YopM-Bla. The average of three independent experiments ± standard deviation are shown and statistical significance is represented comparing compounds relative to the DMSO control. ****P < 0.0001 (one way ANOVA with Dunnett's post-hoc test).
Figure 9
Figure 9
Translocation of YopM-Bla into mammalian cells in the presence of T3SS inhibitors. (A) Representative fluorescent micrographs of CCF2-AM loaded CHO K1 cells in the absence of bacteria (uninfected) or infected for 2 h with Y. pseudotuberculosis lacking YopHEMOJT but expressing the Yop reporter YopM-Bla (Δyop6 pYopM-Bla) at MOI 7 in the presence of 50 μM compound or equivalent volume of DMSO. A T3SS-defective mutant lacking the pore-forming protein YopB was used as a negative control (Δyop6/ΔyopB pYopM-Bla). (B) CCF2 green (uncleaved) and blue (cleaved) fluorescence was measured and the average from three biological replicates ± standard deviation is shown and statistical significance is represented relative to the DMSO control. ****P < 0.0001, **P < 0.007 (one way ANOVA with Dunnett's post-hoc test).

References

    1. Aiello D., Williams J. D., Majgier-Baranowska H., Patel I., Peet N. P., Huang J., et al. . (2010). Discovery and characterization of inhibitors of Pseudomonas aeruginosa type III secretion. Antimicrob. Agents Chemother. 54, 1988–1999. 10.1128/AAC.01598-09 - DOI - PMC - PubMed
    1. Anantharajah A., Buyck J. M., Sundin C., Tulkens P. M., Mingeot-Leclercq M. P., Van Bambeke F. (2017). Salicylidene acylhydrazides and hydroxyquinolines act as inhibitors of type three secretion systems in Pseudomonas aeruginosa by distinct mechanisms. Antimicrob. Agents Chemother. 61:e02566-16. 10.1128/AAC.02566-16 - DOI - PMC - PubMed
    1. Andersen J. B., Sternberg C., Poulsen L. K., Bjorn S. P., Givskov M., Molin S. (1998). New unstable variants of green fluorescent protein for studies of transient gene expression in bacteria. Appl. Environ. Microbiol. 64, 2240–2246. - PMC - PubMed
    1. Auerbuch V., Golenbock D. T., Isberg R. R. (2009). Innate immune recognition of Yersinia pseudotuberculosis type III secretion. PLoS Pathog. 5:e1000686. 10.1371/journal.ppat.1000686 - DOI - PMC - PubMed
    1. Beckham K. S., Roe A. J. (2014). From screen to target: Insights and approaches for the development of anti-virulence compounds. Front. Cell. Infect. Microbiol. 4:139. 10.3389/fcimb.2014.00139 - DOI - PMC - PubMed

Publication types

MeSH terms

LinkOut - more resources