Review
. 2018 Nov 21:5:167.
doi: 10.3389/fcvm.2018.00167. eCollection 2018.

Single Cell Gene Expression to Understand the Dynamic Architecture of the Heart

Affiliations
Review

Single Cell Gene Expression to Understand the Dynamic Architecture of the Heart

Andrea Massaia et al. Front Cardiovasc Med. .

Abstract

The recent development of single cell gene expression technologies, and especially single cell transcriptomics, have revolutionized the way biologists and clinicians investigate organs and organisms, allowing an unprecedented level of resolution to the description of cell demographics in both healthy and diseased states. Single cell transcriptomics provide information on prevalence, heterogeneity, and gene co-expression at the individual cell level. This enables a cell-centric outlook to define intracellular gene regulatory networks and to bridge toward the definition of intercellular pathways otherwise masked in bulk analysis. The technologies have developed at a fast pace producing a multitude of different approaches, with several alternatives to choose from at any step, including single cell isolation and capturing, lysis, RNA reverse transcription and cDNA amplification, library preparation, sequencing, and computational analyses. Here, we provide guidelines for the experimental design of single cell RNA sequencing experiments, exploring the current options for the crucial steps. Furthermore, we provide a complete overview of the typical data analysis workflow, from handling the raw sequencing data to making biological inferences. Significantly, advancements in single cell transcriptomics have already contributed to outstanding exploratory and functional studies of cardiac development and disease models, as summarized in this review. In conclusion, we discuss achievable outcomes of single cell transcriptomics' applications in addressing unanswered questions and influencing future cardiac clinical applications.

Keywords: RNA-seq; cellular landscape; gene expression; heart; qRT-PCR; single cell; transcriptomics.


Figures
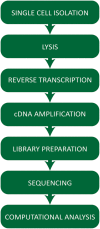
Figure 1
Figure 1
Workflow summarizing the critical steps of a typical single cell RNA-sequencing experiment.
Figure 2
Figure 2
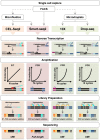
Schematic representation of single cell RNA sequencing experimental pipelines. FACS (with or without Index Sorting), microfluidics and microdroplets are the main methods used for single cell capture. Notably, FACS can be performed as a preparatory step before the other capture techniques. CEL-Seq2, Smart-seq2, 10X Genomics and Drop-seq are shown. Single cell capture is followed by lysis and reverse transcription using oligo-dT primers, which also introduce UMIs (lilac), barcodes (light blue), adapters (cyan), the T7 promoter (red) or PCR primers (dark blue and magenta), as shown in each specific method. Smart-seq does not include early barcoding. Second-strand synthesis in performed by poly(A) tailing (CEL-seq2) or by template-switching (in the other methods). The cDNA is then amplified linearly by IVT using the T7 promoter, or exponentially by PCR. During library preparation, the amplified molecules are fragmented by physical (CEL-Seq2) or enzymatic means (Smart-seq2, 10X and Drop-seq). Fragments are ligated with adaptor sequences required for cDNA amplification (yellow and cyan) and sequencing (orange and gray); in CEL-Seq2, this requires an initial RT step. The resulting sequencing libraries allow UMIs counting or full-length coverage. UMI, unique molecular identifier; Bc, barcode; IVT, in vitro transcription. Undulating lines represent RNA, solid blocks DNA, ovals enzymes, dotted lines sequencing reads. For more details, see https://teichlab.github.io/scg_lib_structs/.
Figure 3
Figure 3
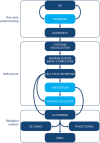
Computational analysis pipeline. The analysis can be broadly divided into three main stages (raw data processing, refinement and biological analysis), each including several steps. Initial QC and trimming can be performed iteratively, multiple times. Light blue boxes indicate optional steps. Details are given in the text. QC, quality control; DE, differentially expressed; GRNs, gene regulatory networks.
Figure 4
Figure 4
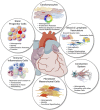
The cellular cardiac landscape: expected deliverables and improvement using single cell and spatial transcriptomics. Single elements used to construct the figure were taken from https://smart.servier.com/ and minor modifications (e.g., color) were applied.

References

    1. Bengtsson M, Stahlberg A, Rorsman P, Kubista M. Gene expression profiling in single cells from the pancreatic islets of Langerhans reveals lognormal distribution of mRNA levels. Genome Res. (2005) 15:1388–92. 10.1101/gr.3820805 - DOI - PMC - PubMed
    1. Eberwine J, Yeh H, Miyashiro K, Cao Y, Nair S, Finnell R, et al. Analysis of gene expression in single live neurons. Proc Natl Acad Sci USA. (1992) 89:3010–4. - PMC - PubMed
    1. Warren LA, Rossi DJ, Schiebinger GR, Weissman IL, Kim SK, Quake SR. Transcriptional instability is not a universal attribute of aging. Aging Cell (2007) 6:775–82. 10.1111/j.1474-9726.2007.00337.x - DOI - PubMed
    1. Tyagi S, Kramer FR. Molecular beacons: probes that fluoresce upon hybridization. Nat Biotechnol. (1996) 14:303–8. 10.1038/nbt0396-303 - DOI - PubMed
    1. Raj A, van den Bogaard P, Rifkin SA, van Oudenaarden A, Tyagi S. Imaging individual mRNA molecules using multiple singly labeled probes. Nat Methods (2008) 5:877–9. 10.1038/nmeth.1253 - DOI - PMC - PubMed