

Effective approach to epidemic containment using link equations in complex networks
- PMID: 30525105
- PMCID: PMC6281434
- DOI: 10.1126/sciadv.aau4212
Effective approach to epidemic containment using link equations in complex networks
Abstract
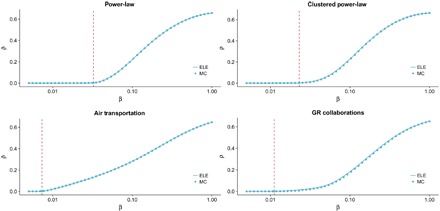
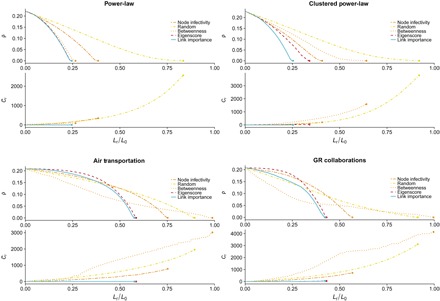
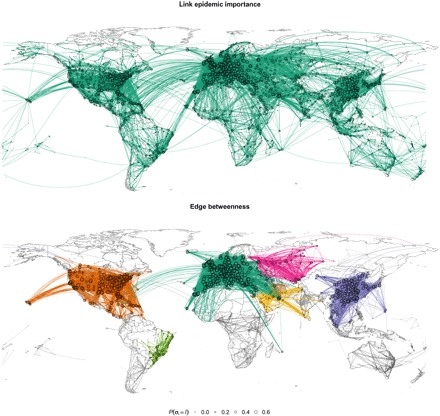
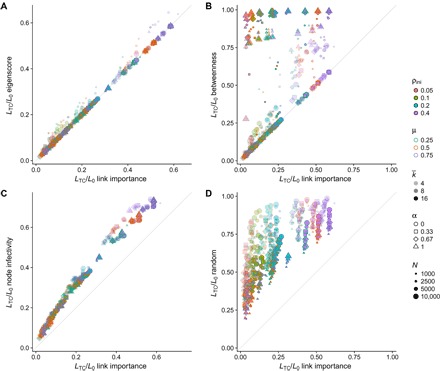
Epidemic containment is a major concern when confronting large-scale infections in complex networks. Many studies have been devoted to analytically understand how to restructure the network to minimize the impact of major outbreaks of infections at large scale. In many cases, the strategies are based on isolating certain nodes, while less attention has been paid to interventions on the links. In epidemic spreading, links inform about the probability of carrying the contagion of the disease from infected to susceptible individuals. Note that these states depend on the full structure of the network, and its determination is not straightforward from the knowledge of nodes' states. Here, we confront this challenge and propose a set of discrete-time governing equations that can be closed and analyzed, assessing the contribution of links to spreading processes in complex networks. Our approach allows a scheme for the containment of epidemics based on deactivating the most important links in transmitting the disease. The model is validated in synthetic and real networks, yielding an accurate determination of epidemic incidence and critical thresholds. Epidemic containment based on link deactivation promises to be an effective tool to maintain functionality of networks while controlling the spread of diseases, such as disease spread through air transportation networks.
Figures
Similar articles
-
Suppression of epidemic spreading process on multiplex networks via active immunization.Chaos. 2019 Jul;29(7):073111. doi: 10.1063/1.5093047. Chaos. 2019. PMID: 31370413
-
Epidemic spreading in annealed directed networks: susceptible-infected-susceptible model and contact process.Phys Rev E Stat Nonlin Soft Matter Phys. 2013 Jan;87(1):012813. doi: 10.1103/PhysRevE.87.012813. Epub 2013 Jan 25. Phys Rev E Stat Nonlin Soft Matter Phys. 2013. PMID: 23410394
-
Suppressing traffic-driven epidemic spreading by edge-removal strategies.Phys Rev E Stat Nonlin Soft Matter Phys. 2013 Jun;87(6):064801. doi: 10.1103/PhysRevE.87.064801. Epub 2013 Jun 10. Phys Rev E Stat Nonlin Soft Matter Phys. 2013. PMID: 23848813
-
Epidemics on dynamic networks.Epidemics. 2018 Sep;24:88-97. doi: 10.1016/j.epidem.2018.04.003. Epub 2018 Apr 28. Epidemics. 2018. PMID: 29907403 Review.
-
epiDMS: Data Management and Analytics for Decision-Making From Epidemic Spread Simulation Ensembles.J Infect Dis. 2016 Dec 1;214(suppl_4):S427-S432. doi: 10.1093/infdis/jiw305. J Infect Dis. 2016. PMID: 28830107 Free PMC article. Review.
Cited by
-
Stochastic effects on the dynamics of an epidemic due to population subdivision.Chaos. 2020 Oct;30(10):101102. doi: 10.1063/5.0028972. Chaos. 2020. PMID: 33138468 Free PMC article.
-
Quantifying edge relevance for epidemic spreading via the semi-metric topology of complex networks.J Phys Complex. 2025 Sep 1;6(3):035005. doi: 10.1088/2632-072X/adf2ed. Epub 2025 Aug 1. J Phys Complex. 2025. PMID: 40757246 Free PMC article.
-
Socio-demographic and health factors drive the epidemic progression and should guide vaccination strategies for best COVID-19 containment.Results Phys. 2021 Jul;26:104433. doi: 10.1016/j.rinp.2021.104433. Epub 2021 Jun 8. Results Phys. 2021. PMID: 34123716 Free PMC article.
-
Infection kinetics of Covid-19 and containment strategy.Sci Rep. 2021 Jun 2;11(1):11606. doi: 10.1038/s41598-021-90698-2. Sci Rep. 2021. PMID: 34078929 Free PMC article.
-
Moving the epidemic tipping point through topologically targeted social distancing.Eur Phys J Spec Top. 2021;230(16-17):3273-3280. doi: 10.1140/epjs/s11734-021-00138-5. Epub 2021 Jun 28. Eur Phys J Spec Top. 2021. PMID: 34221247 Free PMC article.
References
-
- R. M. Anderson, R. M. May, B. Anderson, Infectious Diseases of Humans: Dynamics and Control (Wiley Online Library, 1992), vol. 28.
-
- Hethcote H. W., The mathematics of infectious diseases. SIAM Rev. 42, 599–653 (2000).
-
- D. J. Daley, J. Gani, J. M. Gani, Epidemic Modelling: An Introduction (Cambridge Univ. Press, 2001), vol. 15.
-
- Pastor-Satorras R., Castellano C., Van Mieghem P., Vespignani A., Epidemic processes in complex networks. Rev. Mod. Phys. 87, 925 (2015).
-
- Pastor-Satorras R., Vespignani A., Epidemic spreading in scale-free networks. Phys. Rev. Lett. 86, 3200–3203 (2001). - PubMed
Publication types
MeSH terms
LinkOut - more resources
Full Text Sources
