

Combined Benefit of Quantitative Three-Compartment Breast Image Analysis and Mammography Radiomics in the Classification of Breast Masses in a Clinical Data Set
- PMID: 30526359
- PMCID: PMC6394732
- DOI: 10.1148/radiol.2018180608
Combined Benefit of Quantitative Three-Compartment Breast Image Analysis and Mammography Radiomics in the Classification of Breast Masses in a Clinical Data Set
Abstract
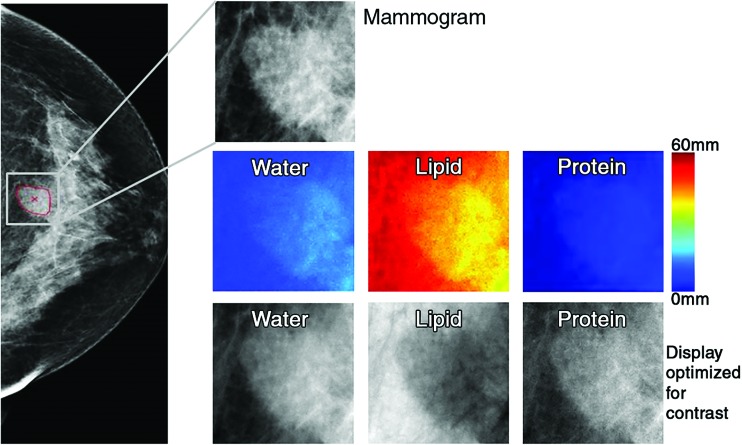
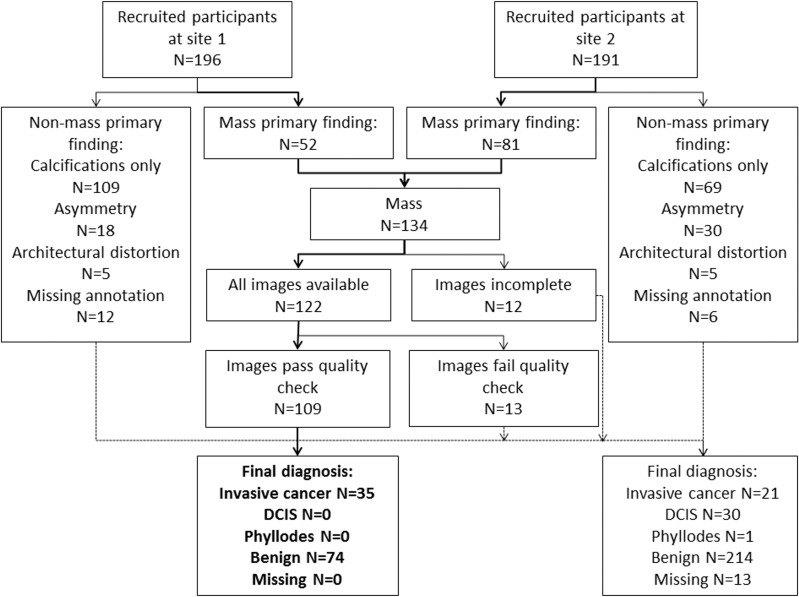
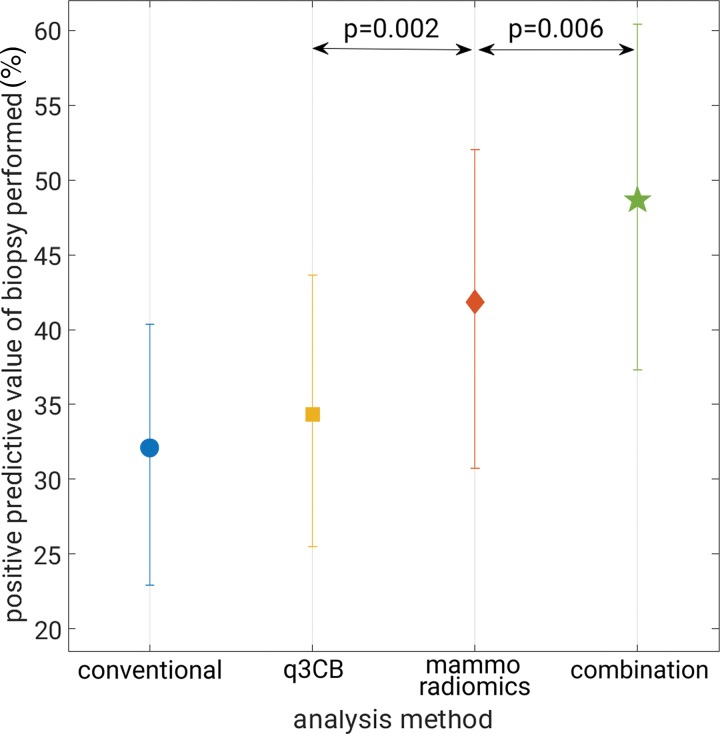
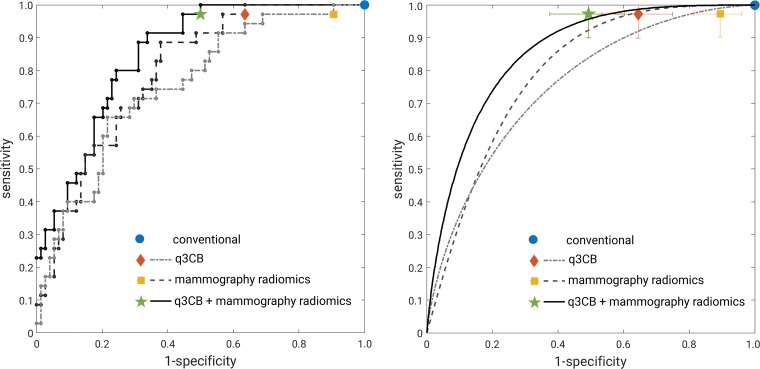
Purpose To investigate the combination of mammography radiomics and quantitative three-compartment breast (3CB) image analysis of dual-energy mammography to limit unnecessary benign breast biopsies. Materials and Methods For this prospective study, dual-energy craniocaudal and mediolateral oblique mammograms were obtained immediately before biopsy in 109 women (mean age, 51 years; range, 31-85 years) with Breast Imaging Reporting and Data System category 4 or 5 breast masses (35 invasive cancers, 74 benign) from 2013 through 2017. The three quantitative compartments of water, lipid, and protein thickness at each pixel were calculated from the attenuation at high and low energy by using a within-image phantom. Masses were automatically segmented and features were extracted from the low-energy mammograms and the quantitative compartment images. Tenfold cross-validations using a linear discriminant classifier with predefined feature signatures helped differentiate between malignant and benign masses by means of (a) water-lipid-protein composition images alone, (b) mammography radiomics alone, and (c) a combined image analysis of both. Positive predictive value of biopsy performed (PPV3) at maximum sensitivity was the primary performance metric, and results were compared with those for conventional diagnostic digital mammography. Results The PPV3 for conventional diagnostic digital mammography in our data set was 32.1% (35 of 109; 95% confidence interval [CI]: 23.9%, 41.3%), with a sensitivity of 100%. In comparison, combined mammography radiomics plus quantitative 3CB image analysis had PPV3 of 49% (34 of 70; 95% CI: 36.5%, 58.9%; P < .001), with a sensitivity of 97% (34 of 35; 95% CI: 90.3%, 100%; P < .001) and 35.8% (39 of 109) fewer total biopsies (P < .001). Conclusion Quantitative three-compartment breast image analysis of breast masses combined with mammography radiomics has the potential to reduce unnecessary breast biopsies. © RSNA, 2018 Online supplemental material is available for this article.
Figures
References
-
- Kerlikowske K, Hubbard R, Tosteson AN. Higher mammography screening costs without appreciable clinical benefit: the case of digital mammography. J Natl Cancer Inst 2014;106(8):dju191. - PubMed
-
- Ong MS, Mandl KD. National expenditure for false-positive mammograms and breast cancer overdiagnoses estimated at $4 billion a year. Health Aff (Millwood) 2015;34(4):576–583. - PubMed
-
- Winch CJ, Sherman KA, Boyages J. Toward the breast screening balance sheet: cumulative risk of false positives for annual versus biennial mammograms commencing at age 40 or 50. Breast Cancer Res Treat 2015;149(1):211–221. - PubMed
