. 2018 Dec 7;19(1):888.
doi: 10.1186/s12864-018-5327-0.

A high-fat diet alters genome-wide DNA methylation and gene expression in SM/J mice

Affiliations

A high-fat diet alters genome-wide DNA methylation and gene expression in SM/J mice

Madeline Rose Keleher et al. BMC Genomics. .

Abstract

Background: While the genetics of obesity has been well defined, the epigenetics of obesity is poorly understood. Here, we used a genome-wide approach to identify genes with differences in both DNA methylation and expression associated with a high-fat diet in mice.

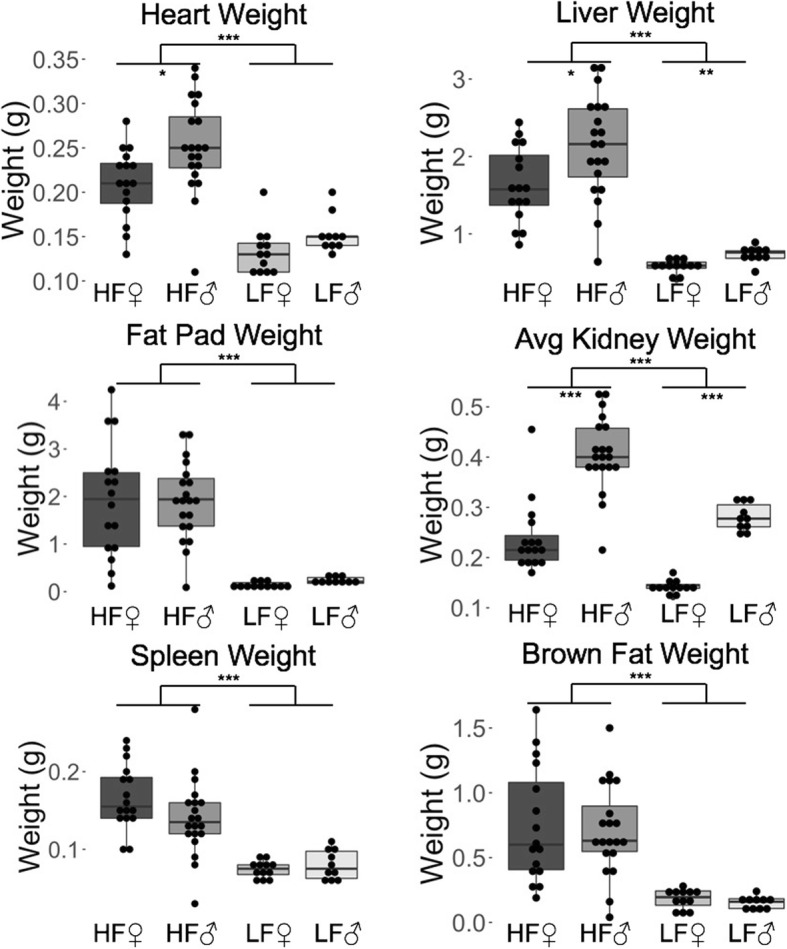
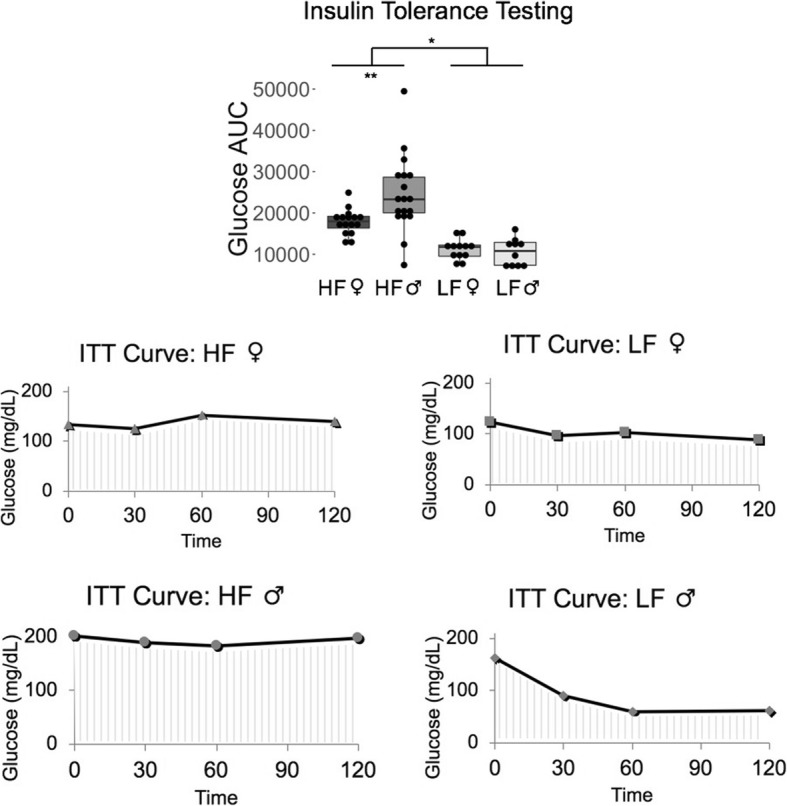
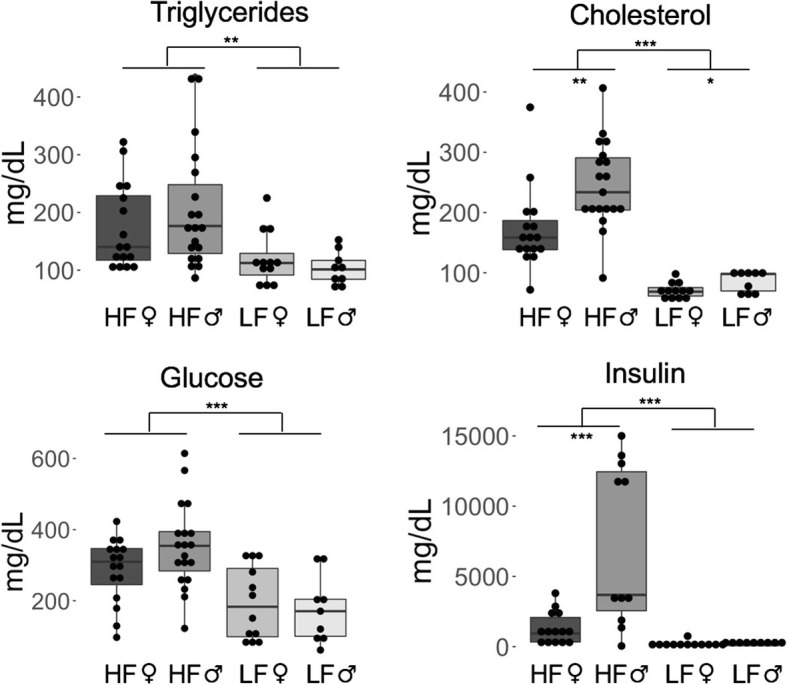
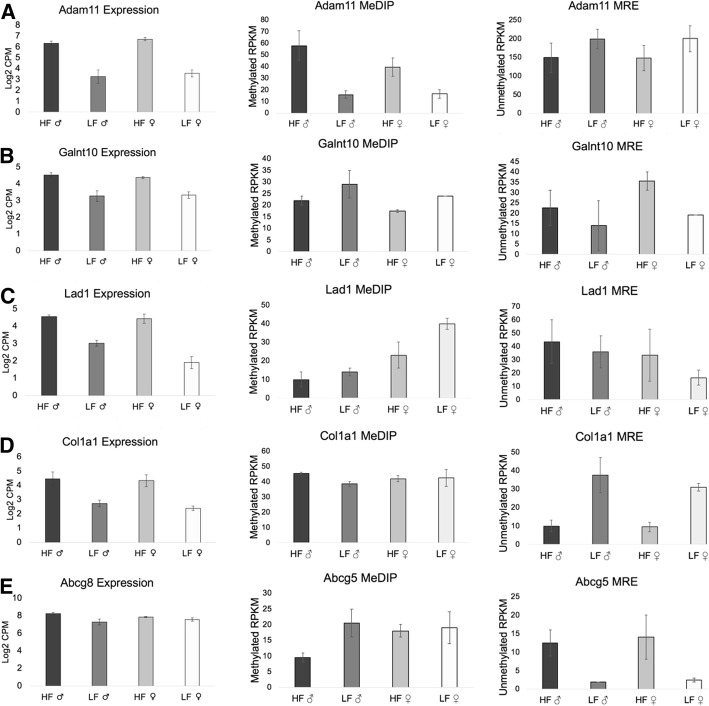
Results: We weaned genetically identical Small (SM/J) mice onto a high-fat or low-fat diet and measured their weights weekly, tested their glucose and insulin tolerance, assessed serum biomarkers, and weighed their organs at necropsy. We measured liver gene expression with RNA-seq (using 21 total libraries, each pooled with 2 mice of the same sex and diet) and DNA methylation with MRE-seq and MeDIP-seq (using 8 total libraries, each pooled with 4 mice of the same sex and diet). There were 4356 genes with expression differences associated with diet, with 184 genes exhibiting a sex-by-diet interaction. Dietary fat dysregulated several pathways, including those involved in cytokine-cytokine receptor interaction, chemokine signaling, and oxidative phosphorylation. Over 7000 genes had differentially methylated regions associated with diet, which occurred in regulatory regions more often than expected by chance. Only 5-10% of differentially methylated regions occurred in differentially expressed genes, however this was more often than expected by chance (p = 2.2 × 10- 8).

Conclusions: Discovering the gene expression and methylation changes associated with a high-fat diet can help to identify new targets for epigenetic therapies and inform about the physiological changes in obesity. Here, we identified numerous genes with altered expression and methylation that are promising candidates for further study.

Keywords: Diet; Epigenetics; Gene expression; Methylation; Mice; Obesity; RNA-seq.


Conflict of interest statement

Ethics approval and consent to participate

This study received ethics approval from Loyola University, followed an approved Institutional Animal Care and Use Committee protocol (Project #1188).

Consent for publication

Not applicable.

Competing interests

The authors declare that they have no competing interests.

Publisher’s Note

Springer Nature remains neutral with regard to jurisdictional claims in published maps and institutional affiliations.

Figures

Fig. 1
Fig. 1
The average weight of mice in grams (± one standard error) from 1 to 17 weeks of age. Diet had a statistically significant effect from 4 weeks of age and on. HF = High-fat diet, and LF = Low-fat diet. LF male n = 10, HF male n = 18, LF female n = 12, HF female n = 16
Fig. 2
Fig. 2
The average organ weights for each sex and diet group in grams. All organ weights were significantly heavier in the high-fat mice than the low-fat mice. The liver, heart, and kidneys were heavier in males than females. HF = High-fat diet, and LF = Low-fat diet. LF male n = 10, HF male n = 18, LF female n = 12, HF female n = 16. *** p < 0.001, ** p < 0.01, * p < 0.05, absence of asterisks indicates not-significant
Fig. 3
Fig. 3
High-fat diet mice had an elevated response to glucose tolerance testing. HF = High-fat diet, and LF = Low-fat diet. LF male n = 10, HF male n = 18, LF female n = 12, HF female n = 16. *** p < 0.001, ** p < 0.01, * p < 0.05, absence of asterisks indicates not-significant
Fig. 4
Fig. 4
High-fat diet mice had a reduced sensitivity to insulin tolerance testing. HF = High-fat diet, and LF = Low-fat diet. LF male n = 10, HF male n = 18, LF female n = 12, HF female n = 16. *** p < 0.001, ** p < 0.01, * p < 0.05, absence of asterisks indicates not-significant
Fig. 5
Fig. 5
High-fat diet mice had higher levels of triglycerides, cholesterol, glucose, and insulin in their serum than low-fat diet mice. HF = High-fat diet, and LF = Low-fat diet. *** p < 0.001, ** p < 0.01, * p < 0.05, absence of asterisks indicates not-significant
Fig. 6
Fig. 6
a A high-fat diet drastically increased leptin levels, b and was negatively correlated with hepatic expression of the leptin receptor Lepr gene. c High-fat-fed mice had signifcantly reduced expression of Lepr. d Serum leptin levels were positvely correlated with the weight of the reproductice fat pad. HF = High-fat diet, and LF = Low-fat diet. Error bars represent ± a single standard error. *** p < 0.001, ** p < 0.01, * p < 0.05, absence of asterisks indicates not-significant
Fig. 7
Fig. 7
a High-fat (HF) diet mice had significantly higher methylation and higher Adam11 expression than low-fat (LF) diet mice. b HF mice also had higher Galnt10 gene expression, with HF females having significantly less methylation in their first intron than LF females. c HF mice had higher expression of Lad1, and the first intron (also a promoter region) had lower methylation in HF females than LF females. d HF mice had higher expression of the Col1a1 gene than LF mice, with significantly increased methylation in HF males across exons 23 and 24 compared to LF males. e HF males had less methylation at a region between the genes Abcg8 and Abcg5, which lie head-to-head, and the HF males had significantly increased expression of both Abcg8 and Abcg5

References

    1. Skinner AC, Skelton JA. Prevalence and trends in obesity and severe obesity among children in the United States, 1999-2012. JAMA Pediatr. 2014;168(6):561–566. doi: 10.1001/jamapediatrics.2014.21. - DOI - PubMed
    1. Lohman BJ, Gillette MT, Neppl TK. Harsh parenting and food insecurity in adolescence: the association with emerging adult obesity. J Adolesc Health. 2016;59(1):123–127. doi: 10.1016/j.jadohealth.2016.03.024. - DOI - PMC - PubMed
    1. Hagström H, Stål P, Hultcrantz R, Hemmingsson T, Andreasson A. Overweight in late adolescence predicts development of severe liver disease later in life: a 39years follow-up study. J Hepatol. 2016;65(2):363–368. doi: 10.1016/j.jhep.2016.03.019. - DOI - PubMed
    1. Finkelstein EA, Khavjou OA, Thompson H, Trogdon JG, Pan L, Sherry B, et al. Obesity and severe obesity forecasts through 2030. Am J Prev Med. 2012;42:563–570. doi: 10.1016/j.amepre.2011.10.026. - DOI - PubMed
    1. Ogden CL, Carroll MD, Kit BK, Flegal KM. Prevalence of childhood and adult obesity in the United States, 2011-2012. JAMA. 2014;311:806–814. doi: 10.1001/jama.2014.732. - DOI - PMC - PubMed