. 2019 Jan 8;116(1):104-119.
doi: 10.1016/j.bpj.2018.11.006. Epub 2018 Nov 10.

Architectural Dynamics of CaMKII-Actin Networks

Affiliations

Architectural Dynamics of CaMKII-Actin Networks

Shahid Khan et al. Biophys J. .

Abstract

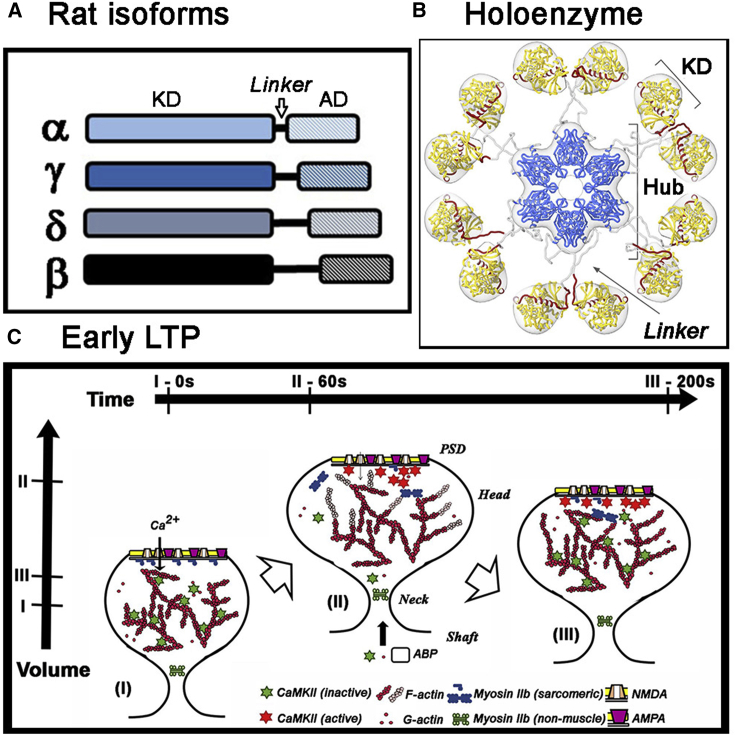
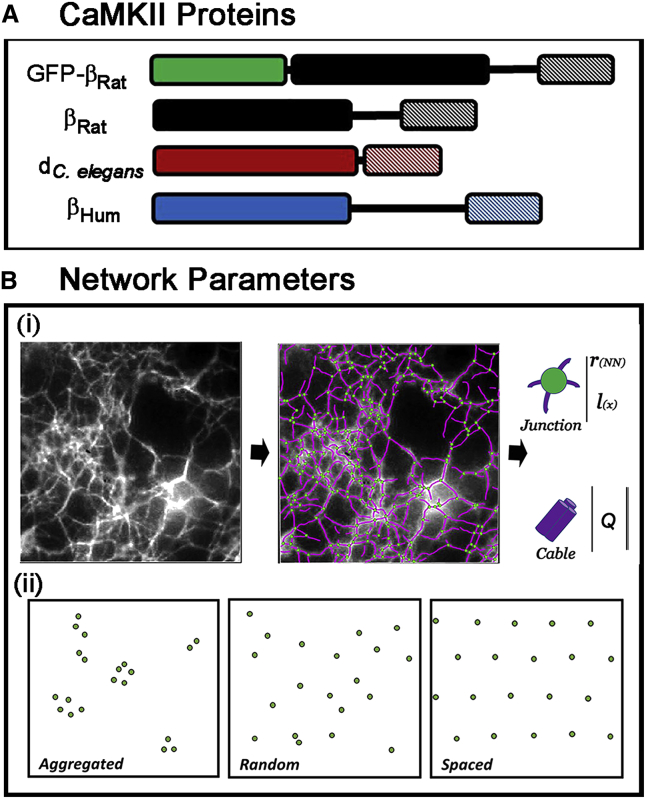
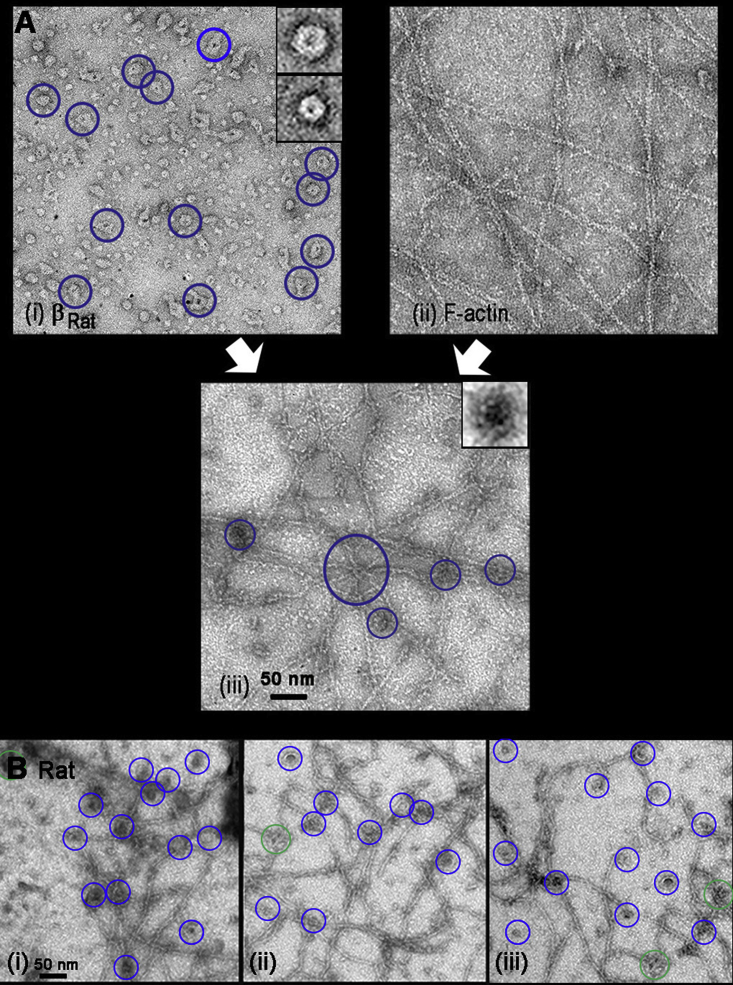
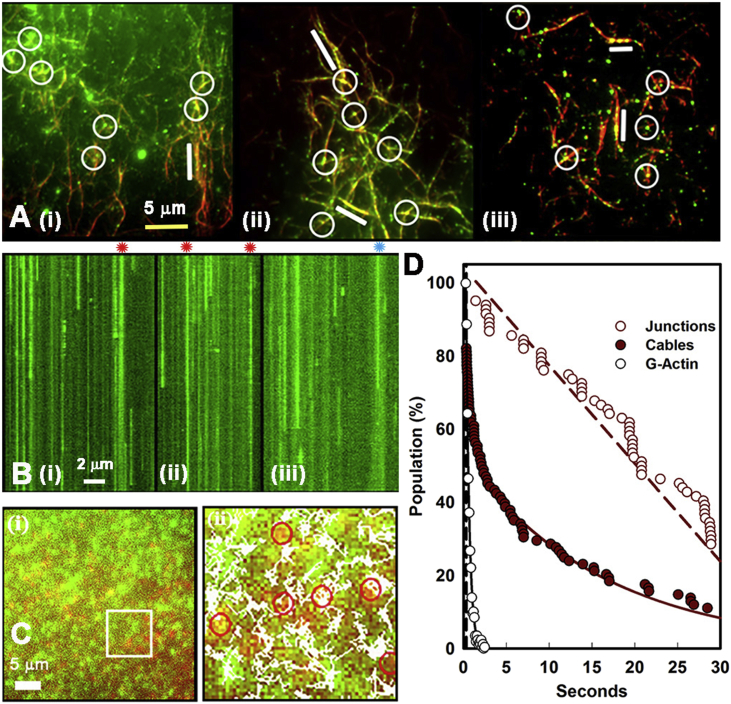
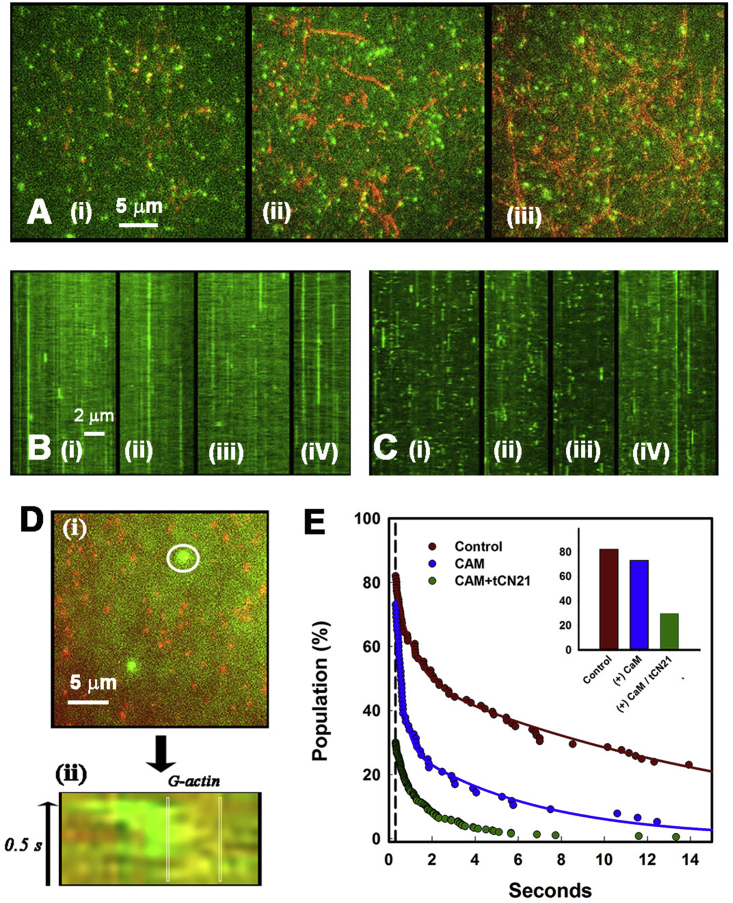
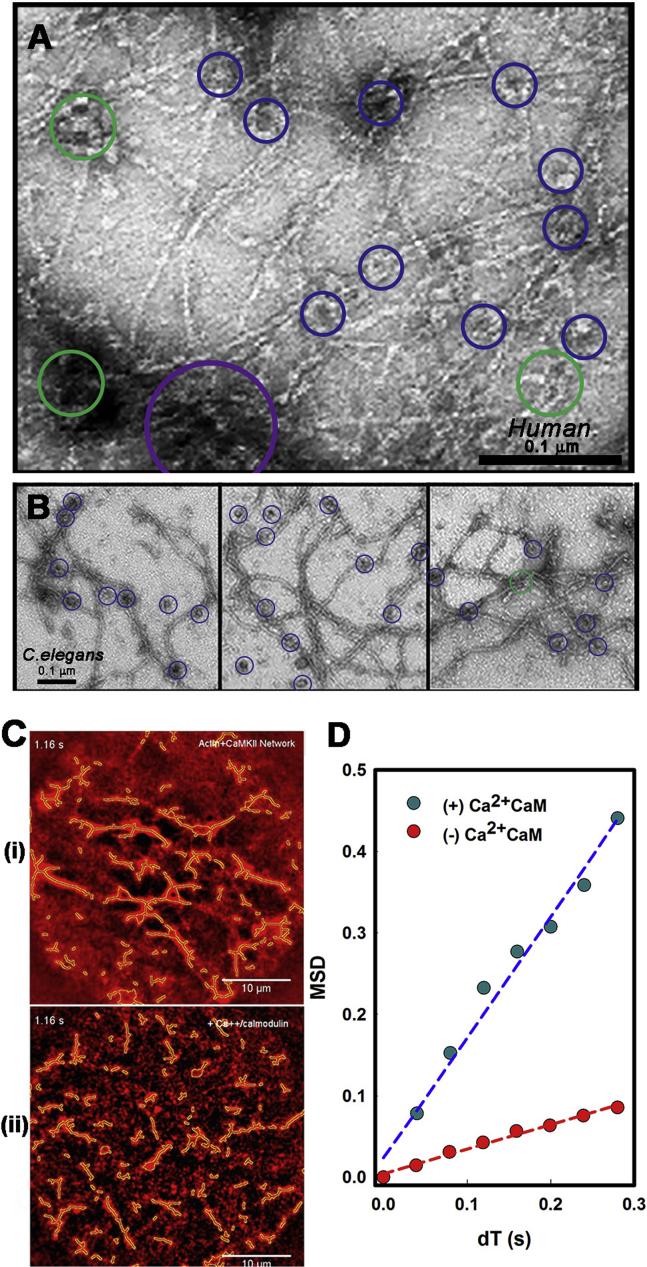
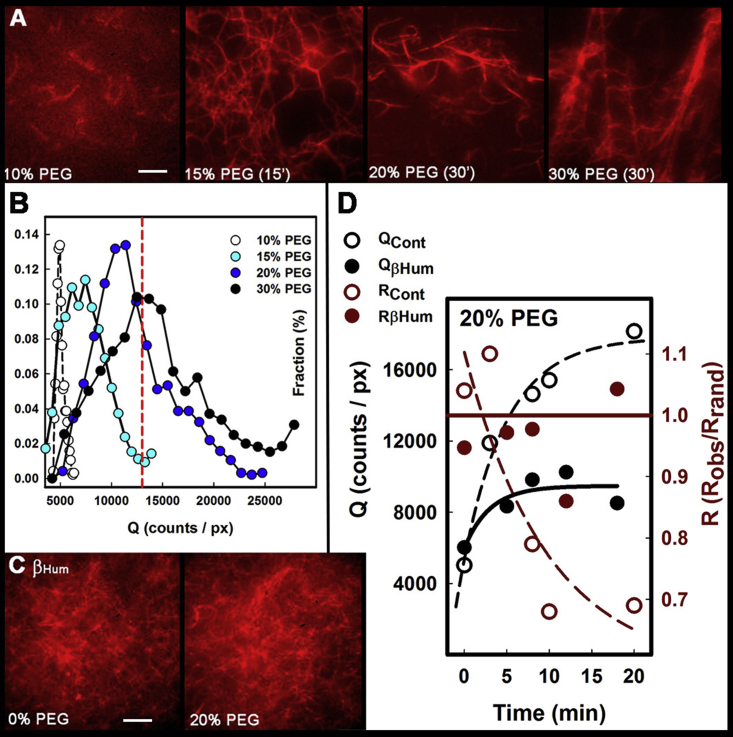
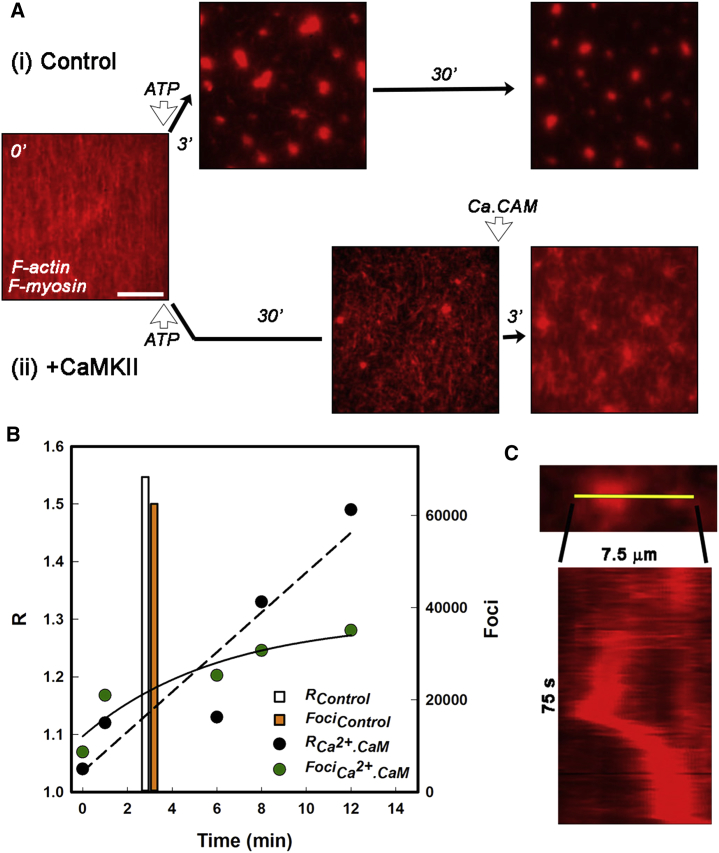
Calcium-calmodulin-dependent kinase II (CaMKII) has an important role in dendritic spine remodeling upon synaptic stimulation. Using fluorescence video microscopy and image analysis, we investigated the architectural dynamics of rhodamine-phalloidin stabilized filamentous actin (F-actin) networks cross-linked by CaMKII. We used automated image analysis to identify F-actin bundles and crossover junctions and developed a dimensionless metric to characterize network architecture. Similar networks were formed by three different CaMKII species with a 10-fold length difference in the linker region between the kinase domain and holoenzyme hub, implying linker length is not a primary determinant of F-actin cross-linking. Electron micrographs showed that at physiological molar ratios, single CaMKII holoenzymes cross-linked multiple F-actin filaments at random, whereas at higher CaMKII/F-actin ratios, filaments bundled. Light microscopy established that the random network architecture resisted macromolecular crowding with polyethylene glycol and blocked ATP-powered compaction by myosin-II miniature filaments. Importantly, the networks disassembled after the addition of calcium-calmodulin and were then spaced within 3 min into compacted foci by myosin motors or more slowly (30 min) aggregated by crowding. Single-molecule total internal reflection fluorescence microscopy showed CaMKII dissociation from surface-immobilized globular actin exhibited a monoexponential dwell-time distribution, whereas CaMKII bound to F-actin networks had a long-lived fraction, trapped at crossover junctions. Release of CaMKII from F-actin, triggered by calcium-calmodulin, was too rapid to measure with flow-cell exchange (<20 s). The residual bound fraction was reduced substantially upon addition of an N-methyl-D-aspartate receptor peptide analog but not ATP. These results provide mechanistic insights to CaMKII-actin interactions at the collective network and single-molecule level. Our findings argue that CaMKII-actin networks in dendritic spines maintain spine size against physical stress. Upon synaptic stimulation, CaMKII is disengaged by calcium-calmodulin, triggering network disassembly, expansion, and subsequent compaction by myosin motors with kinetics compatible with the times recorded for the poststimulus changes in spine volume.


Figures

Figure 1
Figure 1
For a Figure360 author presentation of Fig. 1, see the figure legend at https://doi.org/10.1016/j.bpj.2018.11.006. (A) Rat isoforms. Subunits are distinguished by the length and composition of their linkers between the KD and AD. (B) Holoenzyme; Dodecamer with stacked hexamer rings. Linker extensions regulate kinase co-operativity possibly by controlling access of calcium-calmodulin to its R (regulatory segment (red))-binding motif. The dominant extended form of the autoinhibited CaMKII holoenzyme visualized by cryoelectron tomography of the rat α-isoform is shown (with permission from (20)). (C) Stimulus-dependent remodeling of the spine cytoskeleton. Spine morphology is shown in its initial (i) maximally expanded (ii) and stable end states (iii) after synaptic stimulation. (i) to (ii): transient (subsecond) calcium influx triggers calmodulin-mediated CaMKII activation, dissociation from F-actin (red), and sequestration to the PSD. CaMKII kinase activity orchestrates actin polymerization (F-actin; pink) to expand the cytoskeleton. ABP, actin binding protein. Compaction may be powered by PSD-localized myosin miniature-filament formation mediated by MLCK kinase activation. (ii) to (iii): as intracellular calcium returns to basal levels, compaction of the expanded cytoskeleton by myosin is completed and stabilized by the attachment of CaMKII that has entered from the shaft. Horizontal bars denote time stamps for the states, whereas the vertical bars mark relative spine head volumes.
Figure 2
Figure 2
(A) CaMKII proteins used in the study. The three proteins (βrat = rat β-isoform, βHum = human β-isoform, dC. elegans = C. elegans splice variant d) were selected based on differences in linker lengths and phylogenetic spread. Single-molecule measurements utilized the GFP-tagged fusion of the rat β-isoform. (B) Network parameters. (i) SOAX representation of an F-actin network in 15% PEG showing snakes (purple filaments) and junctions (green spots) superimposed on the image. The parameters extracted from the SOAX were the junction density, interjunction separation (l(x)), and cable intensity (Q). The nearest-neighbor distance (rΝΝ) was computed from junction density and separation. (ii) Network architectures. Random network flanked by examples of aggregated and spaced networks are shown.
Figure 3
Figure 3
Architecture of βRat-actin networks. (A) (i) βRat and (ii) F-actin solutions form (iii) networks when mixed. Some holoenzymes are identified (blue circles). Boxes (45 nm) show image averages of the dominant subpopulations (top: holoenzymes (n = 21; 25.8 ± 0.8 nm); bottom: proteolyzed hubs (n = 15; 18.0 ± 0.3 nm)). (iii) Multiple (six) F-actin filaments joined by one holoenzyme (center; large blue circle). Junctions with two or three filaments formed by single holoenzymes (blue circles) are common. The box (45 nm) shows the image average of junction-localized βRat (n = 30; 24.0 ± 2.6 nm). (B) (iiii) βRat-actin networks. Junctions have one (blue circles) or two (green circles) holoenzymes.
Figure 4
Figure 4
Single-molecule binding to F- and G-actin. (A) (iiii) Averaged dual color TIRF of GFP-βRat holoenzymes (green spots) bound to Rh-Ph F-actin (red) filament aggregates (R = 0.58; S = 1.05). 20 frames/s video frame rates were used. AB/GOC buffer is shown. 100 frame averages are shown. Circles (white) mark GFP-βRat; bars (white) mark filament stretches decorated continuously with GFP-βRat. (B) (iiii) Kymographs of green fluorescent spots associated with actin filaments. Asterisks (red) mark spots at junctions. The duration (abscissa) of each kymograph is 20 s (400 frames). Length scale (white) represents 2 μm. Bound fraction (dwell time > 6 frames (0.3 s)) is 0.82 ± 0.11. (C) (i) GFP-βrat (green) molecules in the evanescent field adjacent to a surface layer of antibody immobilized Cy3 G-actin (red) molecules. (ii) Particle tracks superimposed on a snapshot of part of the image field (box area in (i)). (D) Values for koff were determined from single- or double-exponential best fits (lines) to dwell-time distributions. Subpopulations localized at junctions (open red circles; koff = 0.04 s−1) versus cables (solid red circles; rate = 0.43(exp (−1.2) + 0.56(exp (−0.06) s−1) are shown. The distribution of GFP-βrat track dwell times over the immobilized Cy3 G-actin fits single-exponential decay (white; k = 2.55s−1; R > 0.99) is shown. The vertical dashed line marks six-frame (0.3 s) “bound” spot threshold.
Figure 5
Figure 5
(A) Dual-color TIRF of GFP-βRat holoenzymes (green spots) associated with F-actin in the presence of (i and ii) calcium-calmodulin and (iii) calcium-calmodulin with tCN21 peptide; tow frame averages. Kymographs (20-s duration) of GFP-βRat spots associated with F-actin in the presence of calcium-calmodulin ((B) (iiv)) and (C) (iiv)) calcium-calmodulin with tCN21 peptide. (D) (i) A TIRF image of GFP-βRat molecules over a surface of immobilized Cy3 G-actin molecules. Concentrations and experimental conditions as in Fig. 4C but in the presence of calcium-calmodulin are shown. (ii) The kymograph (circle in (ii); 3-μm diameter) shows transient interaction of GFP-βrat particle with a Cy3-actin molecule (demarcated). (E) Distributions of bound-control (red), calcium-calmodulin (blue; koff = 0.78 (exp (−3.1) + 0.22(exp (−1.4) s−1), and calcium-calmodulin (+tCN21) (green; koff = 1.0 s−1) treated populations above the six-frame (0.3 s) threshold. The inset shows fractions of [(bound spots (>6 frames threshold))/(Total spots)] − 0.82 ± 0.11 (control), 0.73 ± 0.09 (calcium-calmodulin), and 0.30 ± 0.01 (calcium-calmodulin + tCN21).
Figure 6
Figure 6
Negative-stain EM images of actin networks. (A) βHum. Junctions with one (blue) or two (green), or holoenzymes are circled (holoenzyme/junction = 1.35 ± 0.6). The aggregate of multiple holoenzymes (purple) decorates a bundle. (B) dC. elegans-actin networks with junctions color coded as in (A). Scale bars, 0.1 μm. (C). Video frames with filaments are outlined by the GMimPro tracking algorithm for centroid computation. (i) Rh-Ph biotinylated F-actin gel with dC. elegans on streptavidin-coated glass after 30-min of incubation with dC. elegans (Q = 13,030 counts/pixel; R = 0.75) (ii) Disassembled filaments <3 min after subsequent flow-in of 0.1 mM calcium/1-μM calmodulin. (D) Mean-square deviation versus time interval (dT) plots for populations before (red symbols; Dlat = 0.06 μm2/s) and after (blue symbols; Dlat = 0.37 μm2/s) treatment with calcium-calmodulin.
Figure 7
Figure 7
CaMKII counteracts macromolecular crowding. (A) Rh-Ph F-actin suspensions in AB/GOC with 0% PEG, 15% PEG (15 min), 20% PEG (30 min), and 30% PEG (30 min). (B) Cable intensity (Q) distributions as a function of PEG concentration show shifts in modal values as bundling increases (S = 0.17 (0% PEG); 0.39 (10%PEG); 0.62 (15% PEG); 0.72 (20% PEG)). The dashed line (red) is the Q value for the dC. elegans network (Fig. 6Ci). (C) Rh-Ph F-actin/βHum mixtures in 0% (R = 1.04; Q = 7810 counts/px (pixel)) and 20% PEG. Scale bars (A and D), 5 μm. (D) Time course of bundling/network formation (20% PEG buffer; F-actin without (open) and with βHum (solid)) tracked by the increase in Q and decrease in R. Lines show single-exponential best fits.
Figure 8
Figure 8
Long-range alignment by myosin motor myosin filaments. (A) Rh-Ph biotinylated F-actin tethered to streptavidin-coated glass coverslips incubated with myosin filaments. Compaction after perfusion of AB+/GOC (2 mM ATP) in the absence (i) and presence of (ii) dC. elegans. After perfusion of calcium buffer Ca-AB+/GOC with 1 μM calmodulin, the CaMKII cross-linked network changes to resemble the compacted control network. Scale bars (white), 5 μm. (B) Time course of network remodeling after calcium-calmodulin perfusion tracked as an increase in R (black) and Qfoci(foci; green) compared to the time for foci formation (R; white), Qfoci(orange) in the absence of CaMKII. Linear (dashed line) and exponential (continuous curve) best fits to R and Q, respectively, are shown. (C) A kymograph of the approach and coalescence trajectories of two foci (from a central section of the image field (Video S5; with calcium-calmodulin) along the yellow line.

References

    1. Lisman J., Yasuda R., Raghavachari S. Mechanisms of CaMKII action in long-term potentiation. Nat. Rev. Neurosci. 2012;13:169–182. - PMC - PubMed
    1. Lisman J., Malenka R.C., Malinow R. Learning mechanisms: the case for CaM-KII. Science. 1997;276:2001–2002. - PubMed
    1. Rongo C., Kaplan J.M. CaMKII regulates the density of central glutamatergic synapses in vivo. Nature. 1999;402:195–199. - PubMed
    1. Herring B.E., Nicoll R.A. Long-term potentiation: from CaMKII to AMPA receptor trafficking. Annu. Rev. Physiol. 2016;78:351–365. - PubMed
    1. Kim K., Lakhanpal G., Okamoto K. A temporary gating of actin remodeling during synaptic plasticity consists of the interplay between the kinase and structural functions of CaMKII. Neuron. 2015;87:813–826. - PMC - PubMed

Publication types

LinkOut - more resources