. 2019 Jan 2;101(1):165-177.e5.
doi: 10.1016/j.neuron.2018.11.016. Epub 2018 Dec 4.

Single-Neuron Correlates of Error Monitoring and Post-Error Adjustments in Human Medial Frontal Cortex

Affiliations

Single-Neuron Correlates of Error Monitoring and Post-Error Adjustments in Human Medial Frontal Cortex

Zhongzheng Fu et al. Neuron. .

Abstract

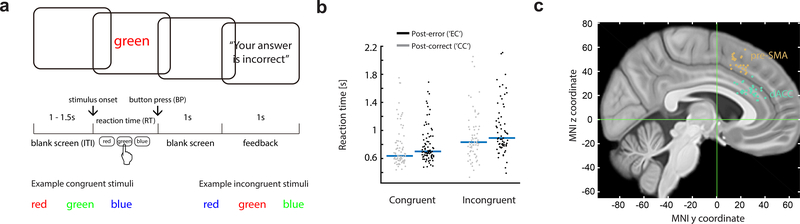
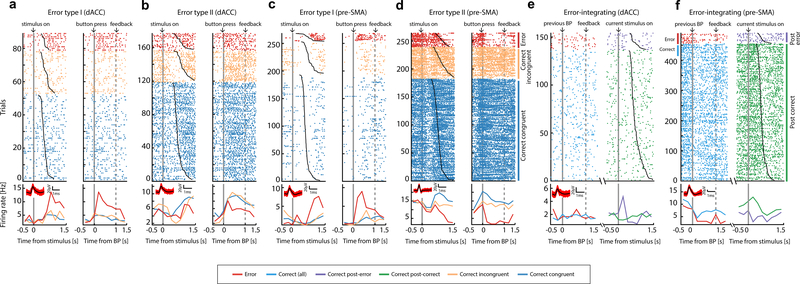
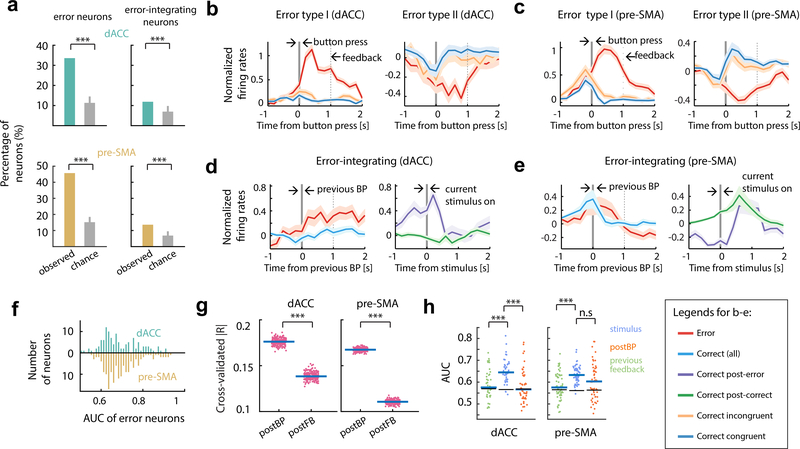
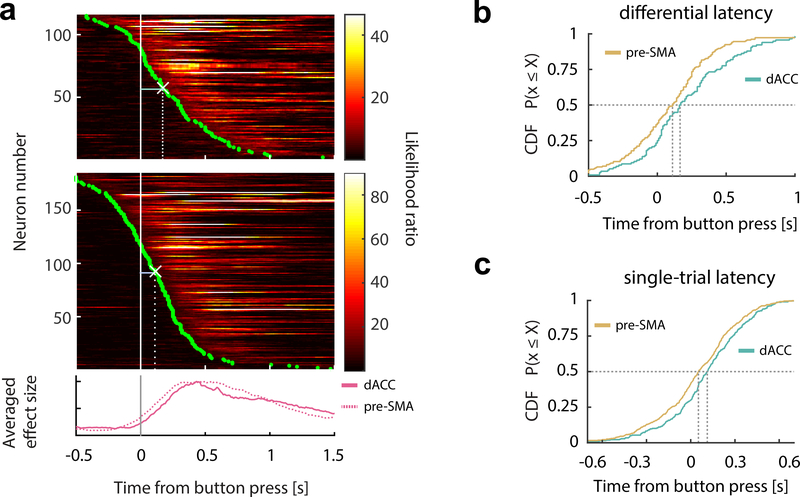
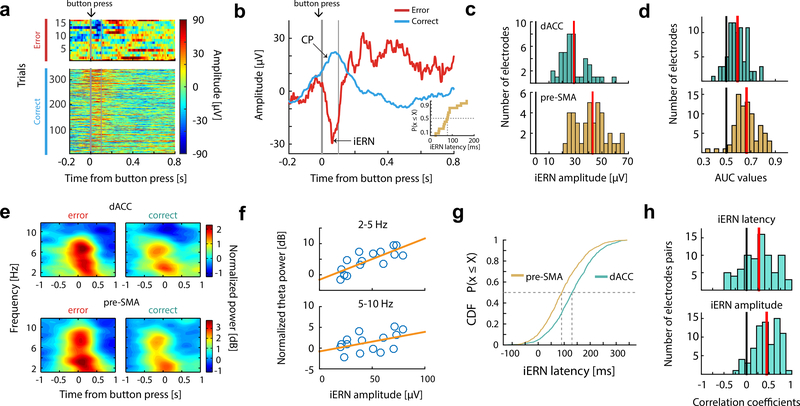
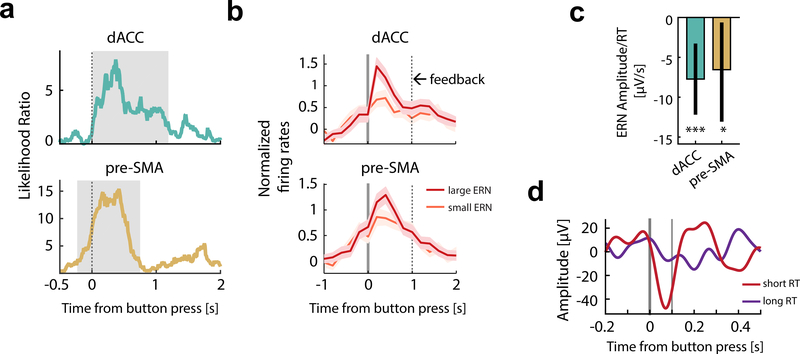
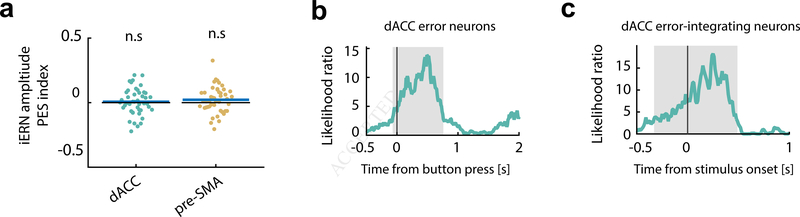
Humans can self-monitor errors without explicit feedback, resulting in behavioral adjustments on subsequent trials such as post-error slowing (PES). The error-related negativity (ERN) is a well-established macroscopic scalp EEG correlate of error self-monitoring, but its neural origins and relationship to PES remain unknown. We recorded in the frontal cortex of patients performing a Stroop task and found neurons that track self-monitored errors and error history in dorsal anterior cingulate cortex (dACC) and pre-supplementary motor area (pre-SMA). Both the intracranial ERN (iERN) and error neuron responses appeared first in pre-SMA, and ∼50 ms later in dACC. Error neuron responses were correlated with iERN amplitude on individual trials. In dACC, such error neuron-iERN synchrony and responses of error-history neurons predicted the magnitude of PES. These data reveal a human single-neuron correlate of the ERN and suggest that dACC synthesizes error information to recruit behavioral control through coordinated neural activity.

Keywords: anterior cingulate cortex; cognitive control; error monitoring; executive function; human intracranial; human single-neuron; medial frontal cortex; post-error slowing; pre-supplementary motor area.


Conflict of interest statement

Declaration of Interests

The authors declare no competing interests.

Figures

Figure 1.
Figure 1.. Task, behavior, and electrode localization
(a)Task structure. (b)Behavior. Each dot represents the mean RT of ‘EC’ or ‘EC’ trials of a session. (c)Recording locations, projected onto the x=5 mm slice. Each dot represents the location of a micro-wire bundle in a patient. See also Figure S1.
Figure 2.
Figure 2.. Examples of error and error-integrating neurons
(a-d) Error neurons (e-f) Error-integrating neurons. (a-f) Raster (top) and mean spike rates (bottom) aligned at stimulus onset (left) and button press (right; ‘BP’) for (a-d); aligned to previous-trial button press (left) and to current-trial stimulus onset (right) for (e-f). Trials are sorted by reaction time (black line overlaying raster plots) and trial type (color; from top to bottom, error, correct incongruent, correct congruent for (a-d); ‘eC’ and ‘cC’ trials for (e-f)). Solid gray bars, time points for alignments. Broken gray bars, onset of feedback. Insets show the waveforms associated with each neuron and the corresponding scale bars.
Figure 3.
Figure 3.. Temporal profile of error and error-integrating neurons
(a)Percentage of significant error and error-integrating neurons in dACC and pre-SMA. Gray bar is null distribution (mean and 95% confidence interval). (b)Average standardized spike rates for all dACC error neurons, aligned at button press (t=0, gray bar). Broken bars, 1s after button press. Shading is ± s.e.m. across neurons. (c)Same as (b), but for pre-SMA error neurons. (d)Average standardized spike rates as a function of time for dACC error-integrating neurons, aligned at preceding-trial button press (left) or current-trial stimulus onset (right). (e)Same as (d) but for the pre-SMA. (f)ROC analysis. Error signal can be reliably decoded at the single-trial level (Type I and Type II pooled). (g)Statistics for (b-c). Error neurons distinguished between error and correct trials more strongly after button press compared to after onset of feedback. Shown are cross-validated partial correlation coefficients across all error neurons (Type I and II pooled). Each data point represents the mean effect size across all error neurons in one cross-validation run. (h)Statistics for (d-e). ROC analysis of the response of error-integrating neurons in three different time windows. The spike rates of error-integrating neurons differentiated between ‘eC’ and ‘cC’ trials in the peri-stimulus time window (blue; [−500ms 500ms] relative to stimulus onset) significantly better than those in the post-feedback period in differentiating between error and correct trials. Error bars, ± s.e.m. across neurons. Broken horizontal lines, the 97.5th percentile of the null distribution. ‘*’, ‘**’, and ‘***’ mark statistical comparisons with p value <0.05, ≤0.01, or ≤0.001, respectively. ‘n.s’ marks not significant (p>0.05). BP=button press.
Figure 4.
Figure 4.. Error neurons in pre-SMA respond earlier than error neurons in dACC
(a)Temporal profile of error information carried by the error neuronal population (Type I and II pooled), aligned at button press (gray bar) and sorted by the onset latencies of error information (green dots). Each row represents one error neuron in dACC (upper) or pre-SMA (middle). White crosses mark the medians of onset latencies. Bottom plot shows the average likelihood ratio normalized by the peak value (solid line, dACC; broken lines, pre-SMA). (b)CDF of differential latencies (see Methods for details) are shown for error neurons. (c)CDF of single-trial onset latencies for error neurons. CDF=cumulative distribution function.
Figure 5.
Figure 5.. Intracranial error-related negativity (iERN)
(a) Example single-trial event-related potentials recorded from dACC, sorted by RT (RT increases from top to bottom rows) and trial types. t=0 is button press. Thin vertical bar marks 100ms after button press. (b)Average of data shown in (a) grouped by trial types (colors; red for error, green for correct), aligned at button press (t = 0, thick vertical gray bar). Inset, distribution of iERN latencies for the same data. Thin vertical bar marks 100ms after button press. (c) Mean iERN amplitudes over all electrodes placed in dACC (green) and pre-SMA (brown). Red vertical bars show the median values. (d)iERN amplitudes differ significantly between correct and error trials, evaluated using ROC analysis (see main text for details). Red vertical bars show the mean values. (e)Spectral signature of the error signal. Power spectrum is aligned at button press (t = 0; averaged across n = 42 sessions). The region of power increase visibly splits into two frequency bands (2–5Hz and 5–10Hz). See Fig. S6e-f for statistics. (f)Trial-by-trial correlation between iERN amplitude and slow-theta (2–5Hz; top) and (5–10Hz) power for the example session shown in (a,b). (g)Comparison of iERN latency across all sessions. The iERN peak occurred significantly earlier in the pre-SMA compared to the dACC. (h)Trial-by-trial correlation of iERN latency (upper) and iERN amplitude (lower) between pairs of iERNs recorded simultaneously in dACC and pre-SMA. For both, the correlation coefficients have a mean significantly greater than zero. Red vertical bars show the mean values.
Figure 6.
Figure 6.. The iERN amplitude is correlated with error neuron spike rate and RT
(a)iERN amplitude correlated significantly with the spike rates of error neurons (Type I). The likelihood ratio peaked around ~400ms after button press. t=0 is button press. Grey shading delineates the extent of the significant cluster as determined by a cluster-based permutation test. Note that the significant cluster started earlier in pre-SMA. (b)Illustration of the relationship between iERN amplitude and spike rates of the error neurons (Type I). Color code: red for error trials with largest ERN (iERN larger than the 80th percentile), orange for error trials with smallest ERN (iERN smaller than the 20th percentile). t=0 marks button press. Solid bar marks button press; dotted bar marks feedback onset. (c)iERN amplitude correlated significantly with RT. Bar plots represent values of regression coefficient for the fixed effect of RT in a mixed effect model. Error bars represent 95% confidence intervals (see Methods). (d)Illustration of the relationship between RT and iERN amplitude (data from one session). iERN amplitudes were larger when the corresponding RTs were short (red; RTs shorter than the median) than when RTs were long (purple; RTs longer than the median). Thick vertical bar marks button press; thin vertical bar marks 100ms after button press. See panel c for statistics. ‘*’, ‘**’, and ‘***’ mark statistical comparisons with p value ≤ 0.05, ≤ 0.01, or ≤ 0.001, respectively.
Figure 7.
Figure 7.. Error neuron-iERN synchrony during errors predicts engagement of control
(a)iERN amplitude did not predict PES significantly. Mean values of the PES index (see Methods) for iERN amplitudes were not significantly different from zero. Blue bars denote mean values; black bars denote zero. (b)The correlation between iERN amplitude and error neuron spike rates (as a function of time; quantified as the likelihood ratio in model comparison; see Methods) predicted the extent of post-error slowing (PES) in the dACC. t=0 is button press. Grey shading delineates the extent of the significant cluster as determined by a cluster-based permutation test (p < 0.05). The same analysis in the pre-SMA did not yield a statistically significant relationship. (c)The spike rates of error-integrating neurons in dACC around the time of stimulus onset predicted PES. ‘*’, ‘**’, and ‘***’ mark statistical comparisons with p value ≤ 0.05, ≤ 0.01, or ≤ 0.001, respectively. Error bars represent ± s.e.m across cells.

Similar articles

Cited by

References

    1. Aarts E, Verhage M, Veenvliet JV, Dolan CV & van der Sluis S 2014. A solution to dependency: using multilevel analysis to accommodate nested data. Nat Neurosci, 17, 491–6. - PubMed
    1. Alexander WH & Brown JW 2011. Medial prefrontal cortex as an action-outcome predictor. Nature Neuroscience, 14, 1338–U163. - PMC - PubMed
    1. Amiez C, Joseph JP & Procyk E 2006. Reward encoding in the monkey anterior cingulate cortex. Cerebral Cortex, 16, 1040–1055. - PMC - PubMed
    1. Aron AR, Behrens TE, Smith S, Frank MJ & Poldrack RA 2007. Triangulating a cognitive control network using diffusion-weighted magnetic resonance imaging (MRI) and functional MRI. J Neurosci, 27, 3743–52. - PMC - PubMed
    1. Aron AR & Poldrack RA 2006. Cortical and subcortical contributions to Stop signal response inhibition: role of the subthalamic nucleus. J Neurosci, 26, 2424–33. - PMC - PubMed

Publication types

LinkOut - more resources