. 2019 Jan 10;176(1-2):43-55.e13.
doi: 10.1016/j.cell.2018.10.049. Epub 2018 Dec 6.

Methotrexate Chemotherapy Induces Persistent Tri-glial Dysregulation that Underlies Chemotherapy-Related Cognitive Impairment

Affiliations

Methotrexate Chemotherapy Induces Persistent Tri-glial Dysregulation that Underlies Chemotherapy-Related Cognitive Impairment

Erin M Gibson et al. Cell. .

Abstract

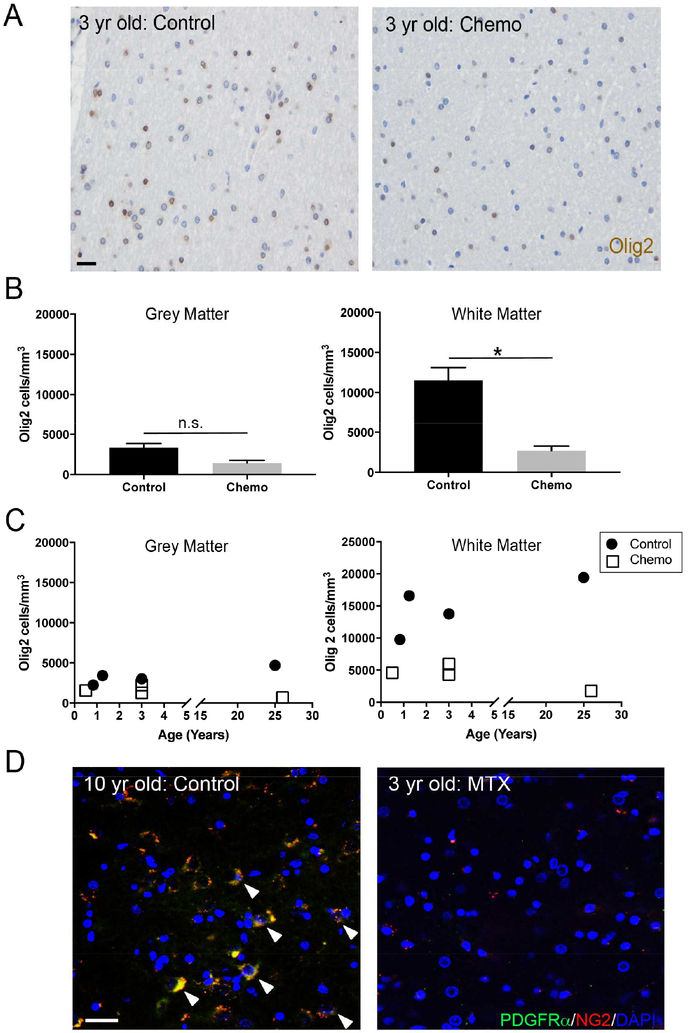
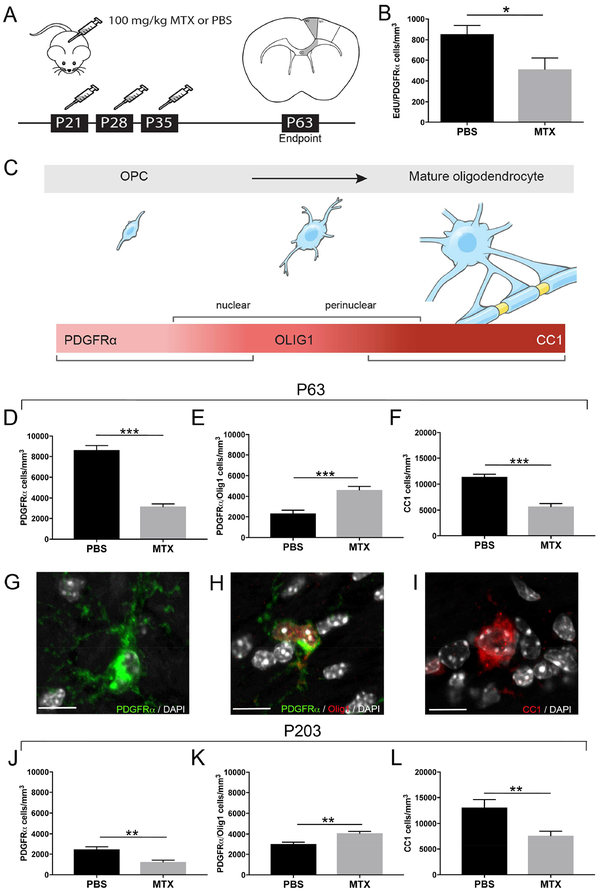
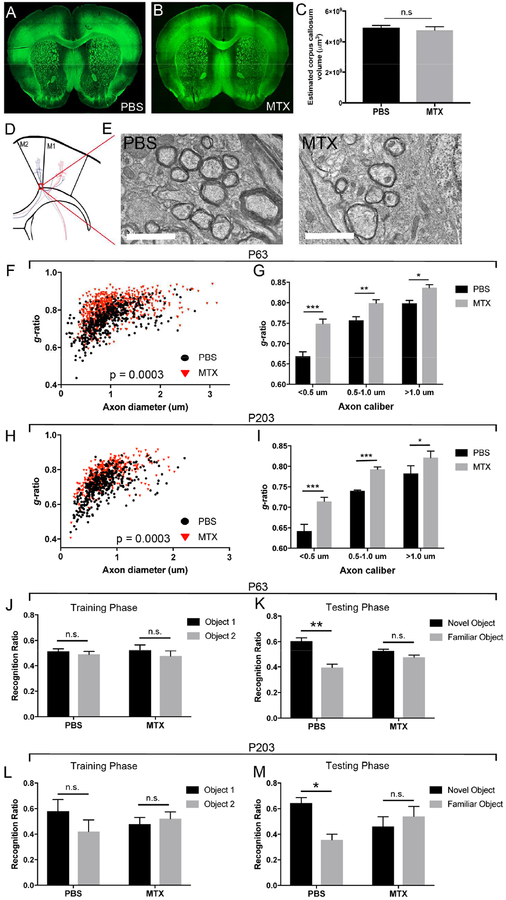
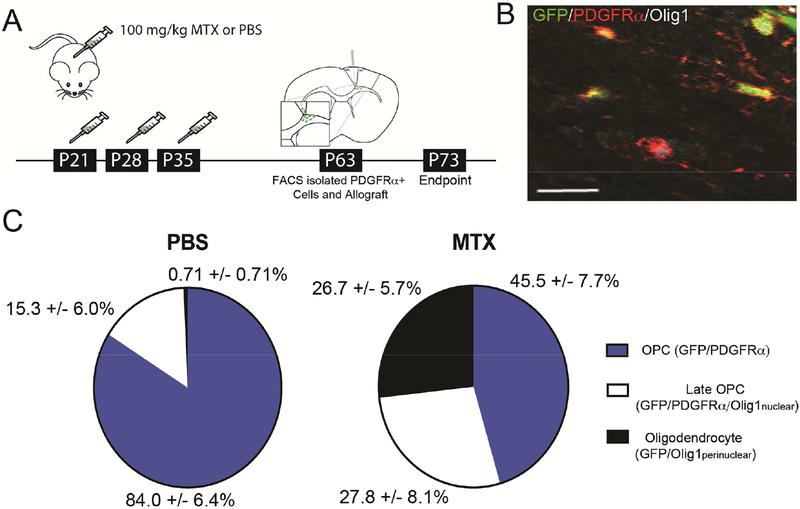
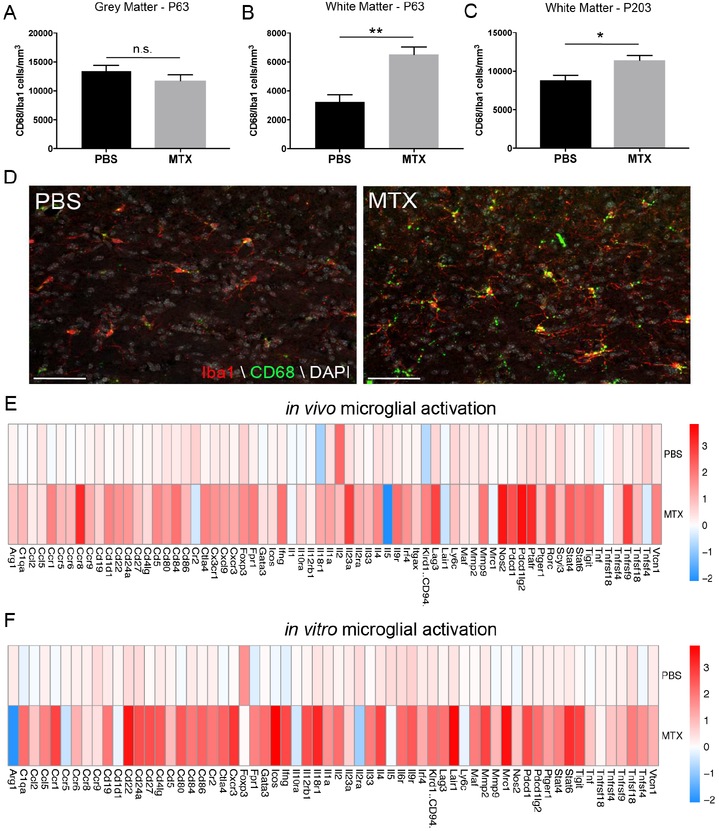
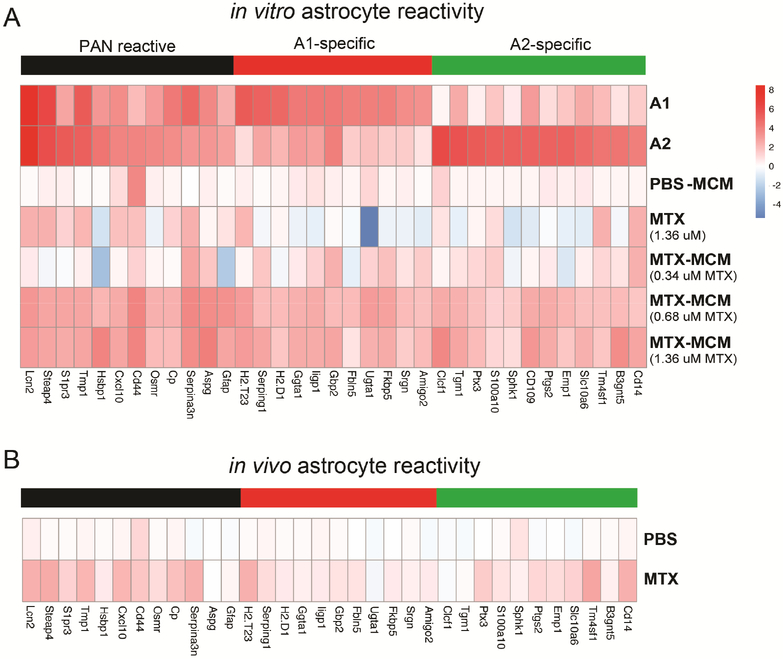
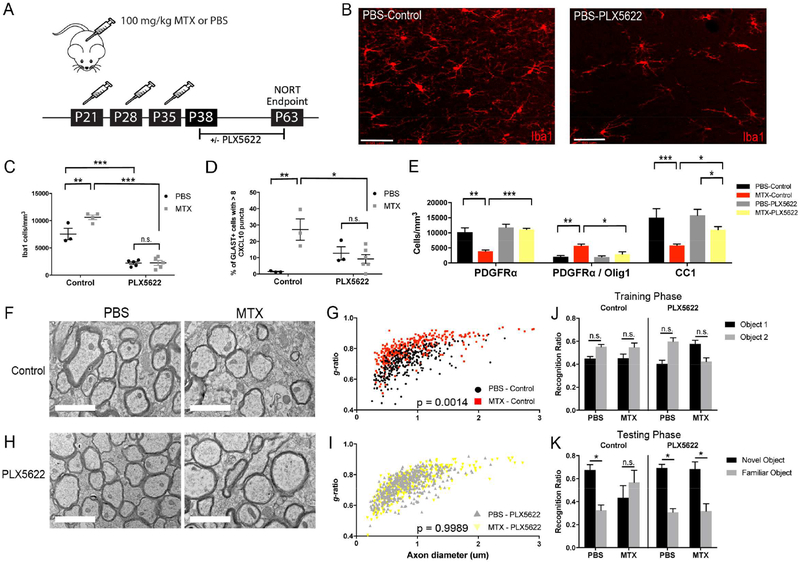
Chemotherapy results in a frequent yet poorly understood syndrome of long-term neurological deficits. Neural precursor cell dysfunction and white matter dysfunction are thought to contribute to this debilitating syndrome. Here, we demonstrate persistent depletion of oligodendrocyte lineage cells in humans who received chemotherapy. Developing a mouse model of methotrexate chemotherapy-induced neurological dysfunction, we find a similar depletion of white matter OPCs, increased but incomplete OPC differentiation, and a persistent deficit in myelination. OPCs from chemotherapy-naive mice similarly exhibit increased differentiation when transplanted into the microenvironment of previously methotrexate-exposed brains, indicating an underlying microenvironmental perturbation. Methotrexate results in persistent activation of microglia and subsequent astrocyte activation that is dependent on inflammatory microglia. Microglial depletion normalizes oligodendroglial lineage dynamics, myelin microstructure, and cognitive behavior after methotrexate chemotherapy. These findings indicate that methotrexate chemotherapy exposure is associated with persistent tri-glial dysregulation and identify inflammatory microglia as a therapeutic target to abrogate chemotherapy-related cognitive impairment. VIDEO ABSTRACT.

Keywords: OPC; astrocyte; chemobrain; chemotherapy; chemotherapy-related cognitive impairment; microglia; myelin; oligodendrocyte.


Conflict of interest statement

Declaration of Interests:

The authors declare no competing interests.

Figures

Figure 1:
Figure 1:
Frontal lobe white matter depletion of oligodendrocyte lineage cells following early life chemotherapy A) Photomicrographs of Olig2+ (brown) cells in frontal cortex white matter of a child exposed to chemotherapy at 3 years old and non-chemotherapy exposed aged-matched control B) Chemotherapy exposure selectively depletes Olig2+ cells in frontal lobe white matter (p=0.0211; n=4) but not grey matter (p=0.0913; n=4) C) Olig2+ cells throughout early life and young adulthood following chemotherapy treatment compared to age-matched controls D) Confocal photomicrographs of PDGFRα+/NG2+ cells in the frontal lobe subcortical white matter of a 10 year old male who received no chemotherapy (left) and a 3 year old male treated with high-dose methotrexate (MTX) chemotherapy in the same anatomical region (right) Data shown as mean±SEM, n.s. = p>0.05, * p<0.05 by paired t-test; n=4/group. Scale bars=20 μm. See also Table S1
Figure 2:
Figure 2:
MTX chemotherapy exposure disrupts oligodendrocyte lineage cell dynamics A) Schematic illustration of juvenile MTX exposure paradigm and area of the premotor (M2) circuit analyzed (shaded in grey) B) Total cell density of newly proliferated EdU+/PDGFRα+ cells at P63 in the corpus callosum of mice exposed to PBS or MTX on P21, 28, and 35 and injected with 40 mg/kg of EdU on P61, 62, and 63 (p=0.0465; n=4 mice/group) C) Schematic illustration of oligodendrocyte lineage cells. OPCs express PDGFRα and begin to express the transcription factor Olig1 in a nuclear and then perinuclear pattern as they progress through differentiation. As differentiation completes, mature, myelinating oligodendrocytes express the marker CC1. D-F) Effect of MTX exposure on OPCs (D; PDGFRα+ cells p<0.0001), PDGFRα+/Olig1+ late OPCs (E; p=0.0003) and CC1+ mature oligodendrocytes (F; p<0.0001) in the corpus callosum at P63 (n=8 mice PBS and n=7 mice MTX) G-I) Photomicrographs of PDGFRα+ OPC (G), late PDGFRα+/Olig1+ cells (H) and CC1+ mature oligodendrocyte (I) J-L) Mice (n=6 PBS; n=7 MTX) exposed to juvenile chemotherapy were allowed to age 6 months (P203) post-treatment. MTX-exposed mice exhibit a decrease in white matter OPC cell density (J; p=0.002) and CC1+ oligodendrocytes (L; p=0.008) with an increase in late OPCs (K; p=0.003). Data shown as mean±SEM, * p<0.05, ** p<0.01, *** p<0.001 by unpaired two-tailed Student’s t-test; Scale bar=10 μm. See also Figure S1 and S2
Figure 3:
Figure 3:
Persistent myelin and neurological deficits following juvenile chemotherapy exposure A-B) Confocal photomicrograph of myelin basic protein (MBP) in the frontal cortex of PBS (A) and MTX (B) exposed mice C) Corpus callosum volume of P63 mice exposed to PBS or MTX (p=0.592; n=5 PBS; n=4 MTX) D) Schematic illustration of the premotor cortex and the region assessed using transmission electron microscopy (TEM; red box). E) Representative TEM images of cortical and subcortical premotor (M2) projections in PBS and MTX exposed mice (4000X; Scale bar=2 μm) F) Scatter plots of g-ratio as a function of axon diameter of M2 projections in the corpus callosum at P63 (PBS: g-ratio 0.7464±0.0049, n=5 mice; MTX: g-ratio 0.801±0.00785, n=8 mice; p=0.0003) G) The increase in g-ratio in MTX- compared to PBS-exposed mice at P63 occurs in small (<0.5 μm; p<0.0001), medium (0.5–1.0 μm; p=0.0097) and large (>1.0 μm; p=0.0220) caliber axons. n=5 mice PBS; n=8 mice MTX H) Scatter plots of g-ratio as a function of axon diameter of M2 projections in the corpus callosum at P203 (PBS: g-ratio 0.7073±0.0037, n=4 mice; MTX: g-ratio 0.7697±0.0073, n=4 mice; p=0.0003) I) The increase in g-ratio in MTX- compared to PBS-exposed mice at P203 occurs in small (<0.5 μm; p<0.0001), medium (0.5–1.0 μm; p<0.0001) and large (>1.0 μm; p=0.0188) caliber axons. n=4 mice PBS; n=4 mice MTX J) P63 PBS and MTX mice spent equivalent amounts of time exploring Object 1 and Object 2 during the training phase of NORT (PBS: p=0.59, n=9; MTX: p=0.58, n=7). K) During the testing phase of NORT, PBS-exposed mice spent significantly more time exploring the novel object compared to the familiar object (p=0.004) while MTX-exposed mice did not discriminate between the objects (p=0.18). L-M) P203 PBS and MTX mice spent equivalent amounts of time exploring Object 1 and Object 2 during the training phase of NORT (L; PBS: p=0.45, n=4; MTX: p=0.69, n=7) but during the testing phase (M), PBS-exposed mice spent significantly more time exploring the novel compared to the familiar object (p=0.047) while the MTX-exposed mice did not discriminate between the objects (p=0.62). Data shown as mean±SEM, * p<0.05, ** p<0.01, *** p<0.001, n.s. p>0.05 by unpaired two-tailed Student’s t-test. See also Figure S3
Figure 4:
Figure 4:
Microenvironmental perturbation drives differentiation of oligodendrocyte precursor cells A) Schematic illustration of juvenile chemotherapy paradigm and syngeneic transplantation of GFP+/PDGFRα+ cells B) Confocal photomicrograph of transplanted GFP/PDGFRα cells in the corpus callosum 10 days-post transplantation (GFP=green; PDGFRα=red; Olig1=white; Scale bar=20 μm) C) Syngeneic transplantation of GFP/PDGFRα cells into previously MTX- (n=3 mice) or PBS-exposed (n=4 mice) corpus callosi. Percent of cells GFP/PDGFRα (p=0.01167), GFP/PDGFRα/Olig1nuclear (p=0.259), and GFP/Olig1perinuclear oligodendrocytes (p=0.00295) in MTX- and PBS-exposed mice 10 days-post transplantation. Data shown as mean±SEM; unpaired two-tailed Student’s t-test. See also Figure S4
Figure 5:
Figure 5:
Chronic microglial activation is secondary to MTX exposure A-C) Activation of microglia (CD68+/Iba1+) following early-life chemotherapy exposure in the superficial grey matter (A; p=0.2570) and corpus callosum (B; p=0.0018) of the premotor circuit at P63 (n=5 mice/group) and P203 (C; p=0.01; n=7 mice/group). Data shown as mean±SEM, * p<0.05, ** p<0.01, n.s. p>0.05 by unpaired two-tailed Student’s t-test D) Confocal photomicrographs of CD68+/Iba1+ activated microglia in the corpus callosum at P63 (Iba1=red, CD68=green, DAPI=white). Scale bar=50 μm E) Iba+ microglia were sorted using FACS at P63 from frontal lobe deep cortex and corpus callosum of previously PBS- or MTX-exposed mice (n=2–6 mice/condition/sort). Heat map of activated transcripts indicate a significant increase in activation following MTX exposure (p<0.0001). F) Immunopanned microglia exposed to 0.68 μM of MTX for 24 hours in vitro indicate significant activation compared to vehicle control (p<0.0001). E-F) All experiments analyzed by two-way ANOVA with Tukey post-hoc tests and performed with n=3 biological replicates
Figure 6:
Figure 6:
Chemotherapy-exposed activated microglia induce astrocyte reactivity A-B) Heat maps depicting mRNA expression levels of actrocyte reactivity gene transcripts A) Immunopanned astrocytes exposed to physiologically high (1.36 μM) concentrations of MTX directly do not become reactive, but when exposed to conditioned medium from MTX-induced activated microglia in vitro (0.68 μM MTX-MCM) astrocytes become broadly reactive compared to PBS controls (pan p=0.0004, A1 p=0.0193, A2 p=0.0144). B) Astrocytes were sorted using FACS from ALDH1L1::eGFP mice at P63 that were previously exposed to juvenile PBS or MTX. MTX exposure results in broad astrocyte reactivity compared to PBS exposure (n=4–5 mice/condition/sort; pan p=0.0011, A1 p=0.075, A2 p=0.0097). All experiments analyzed by two-way ANOVA with Tukey post-hoc tests and performed with n=3 biological replicates.
Figure 7:
Figure 7:
Microglial depletion rescues chemotherapy-induced deficits in oligodendroglial lineage cell and astrocytic dynamics, myelination, and cognitive behavior A) Schematic of juvenile chemotherapy exposure paradigm plus microglial depletion with PLX5622 B) Confocal photomicrographs of Iba1+ microglia in the corpus callosum of PBS-exposed mice fed control or PLX5622 chow; Scale bar=50 μm C) Iba1+ microglia are decreased by 70–80% in PBS and MTX mice following 26 days of PLX5622 (PBS-Control n=3 vs. MTX-Control n=4, p=0.0092; PBS-Control vs. PBSPLX5622 n=5 mice/group, p<0.0001; MTX-Control vs. MTX-PLX5622 n=5, p<0.0001) by two-way ANOVA with Tukey post-hoc analyses. D) Microglial depletion normalizes the percentage of GLAST+ astrocytes with high CXCL10+ pan reactive puncta in MTX- compared to PBS-exposed mice (PBS-Control n=3 vs. MTX-Control n=3, p=0.0053; MTX-Control vs. MTX-PLX5622 n=6, p=0.0207; PBS-Control vs. PBS-PLX5622 n=3; p=0.28). E) Microglial depletion increases OPC (p=0.0002) and mature oligodendrocyte (p=0.0106) while decreases late OPC cell density (p=0.0174) in MTX mice fed PLX5622 chow compared to MTX mice fed control chow. The CC1+ mature oligodendrocyte population is partially recovered to PBS levels (p=0.0128) by one-way ANOVA. PBS-Control n=3 mice; MTX-Control n=4 mice; PBS-PLX5622 and MTX-PLX5622 n=5 mice/group F, H) Representative TEM images of cortical projections to corpus callosum at the level of the cingulum in PBS and MTX mice treated with PLX5622 or control chow; Scale bar=2 μm G, I) Scatter plots of individual axons as a function of axon diameter for PBS and MTX mice fed control or PLX5622 chow. g-ratio: PBS-Control (n=3) 0.7151±0.014; MTX-Control (n=3) 0.7953±0.015, p=0.0014; PBS-PLX5622 (n=4) 0.7331±0.0035; MTXPLX5622 (n=3) 0.735±0.0023, p>0.05; MTX-Control vs. MTX-PLX5622 p=0.0089 J-K) NORT on PBS- or MTX-exposed mice at P63 following treatment with control or PLX5622 chow J) During the training phase, mice spent equivalent time exploring Object 1 and Object 2 regardless of juvenile chemotherapy treatment or post-treatment microglial state; PBS-Control (n=5), p=0.057; MTX-Control (n=3), p=0.32; PBS-PLX5622 (n=3), p=0.10; MTX-PLX5622 (n=5), p=0.08 K) During the testing phase, PBS-Control (p=0.02), PBS-PLX5622 (p=0.027), and MTXPLX5622 (p=0.047) mice explored the novel object significantly more than the familiar object while MTX-Control mice (p=0.59) did not discriminate between the novel and familiar objects by unpaired two-tailed Student’s t-test. Data shown as mean±SEM, * p<0.05, ** p<0.01, *** p<0.001, n.s. p>0.05. See also Figure S5

Comment in

References

    1. Acharya MM, Martirosian V, Chmielewski NN, Hanna N, Tran KK, Liao AC, Christie LA, Parihar VK, and Limoli CL (2015). Stem cell transplantation reverses chemotherapy-induced cognitive dysfunction. Cancer Res 75, 676–686. - PMC - PubMed
    1. Adamsky A,K. A; Kreisel T; Doron A; Ozeri-Engelhard N; Melcer T; Refaeli R; Horn H; Regev L; Groysman M; London M; Goshen I (2018). Astrocytic Activation Generates De Novo Neuronal Potentiation and Memory Enhancement. Cell 174, 1–13. - PubMed
    1. American Cancer Society (2016). Cancer Treatment & Survivorship Facts & Figures 2016–2017.
    1. Anderson VA, Godber T, Smibert E, Weiskop S, and Ekert H (2000). Cognitive and academic outcome following cranial irradiation and chemotherapy in children: a longitudinal study. British journal of cancer 82, 255–262. - PMC - PubMed
    1. Aukema EJ, Caan MW, Oudhuis N, Majoie CB, Vos FM, Reneman L, Last BF, Grootenhuis MA, and Schouten-van Meeteren AY (2009). White matter fractional anisotropy correlates with speed of processing and motor speed in young childhood cancer survivors. Int J Radiat Oncol Biol Phys 74, 837–843. - PubMed

Publication types

MeSH terms