. 2019 Feb:123:189-200.
doi: 10.1016/j.envint.2018.11.067. Epub 2018 Dec 6.

The early-life exposome: Description and patterns in six European countries

Affiliations

The early-life exposome: Description and patterns in six European countries

Ibon Tamayo-Uria et al. Environ Int. 2019 Feb.

Abstract

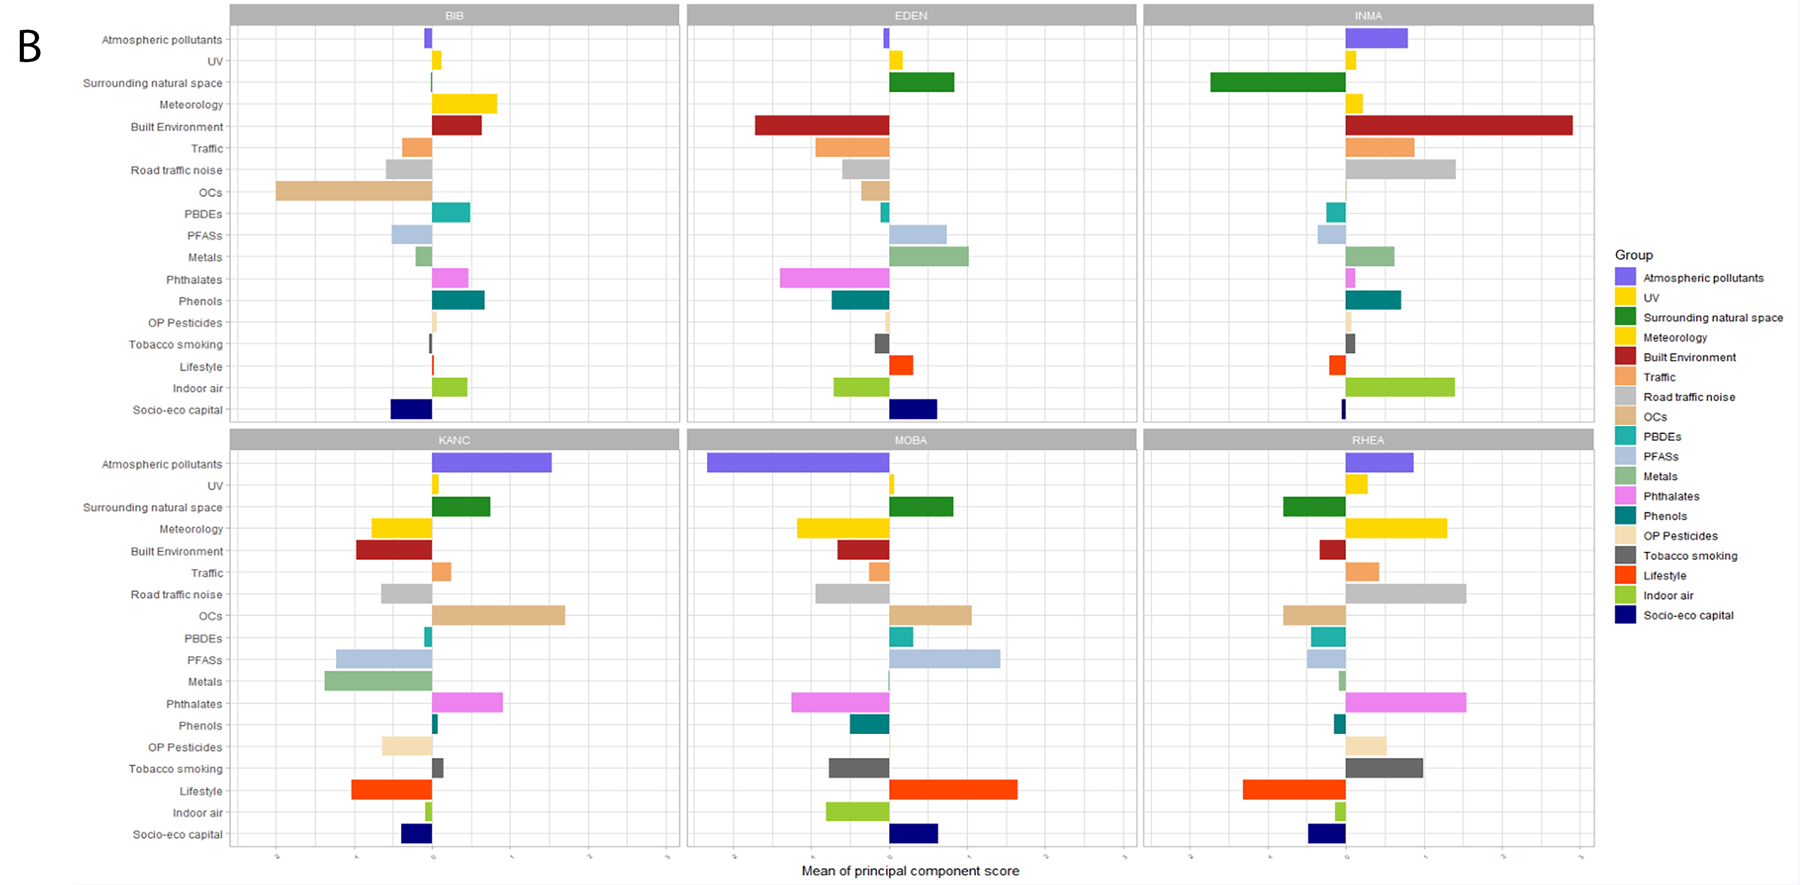
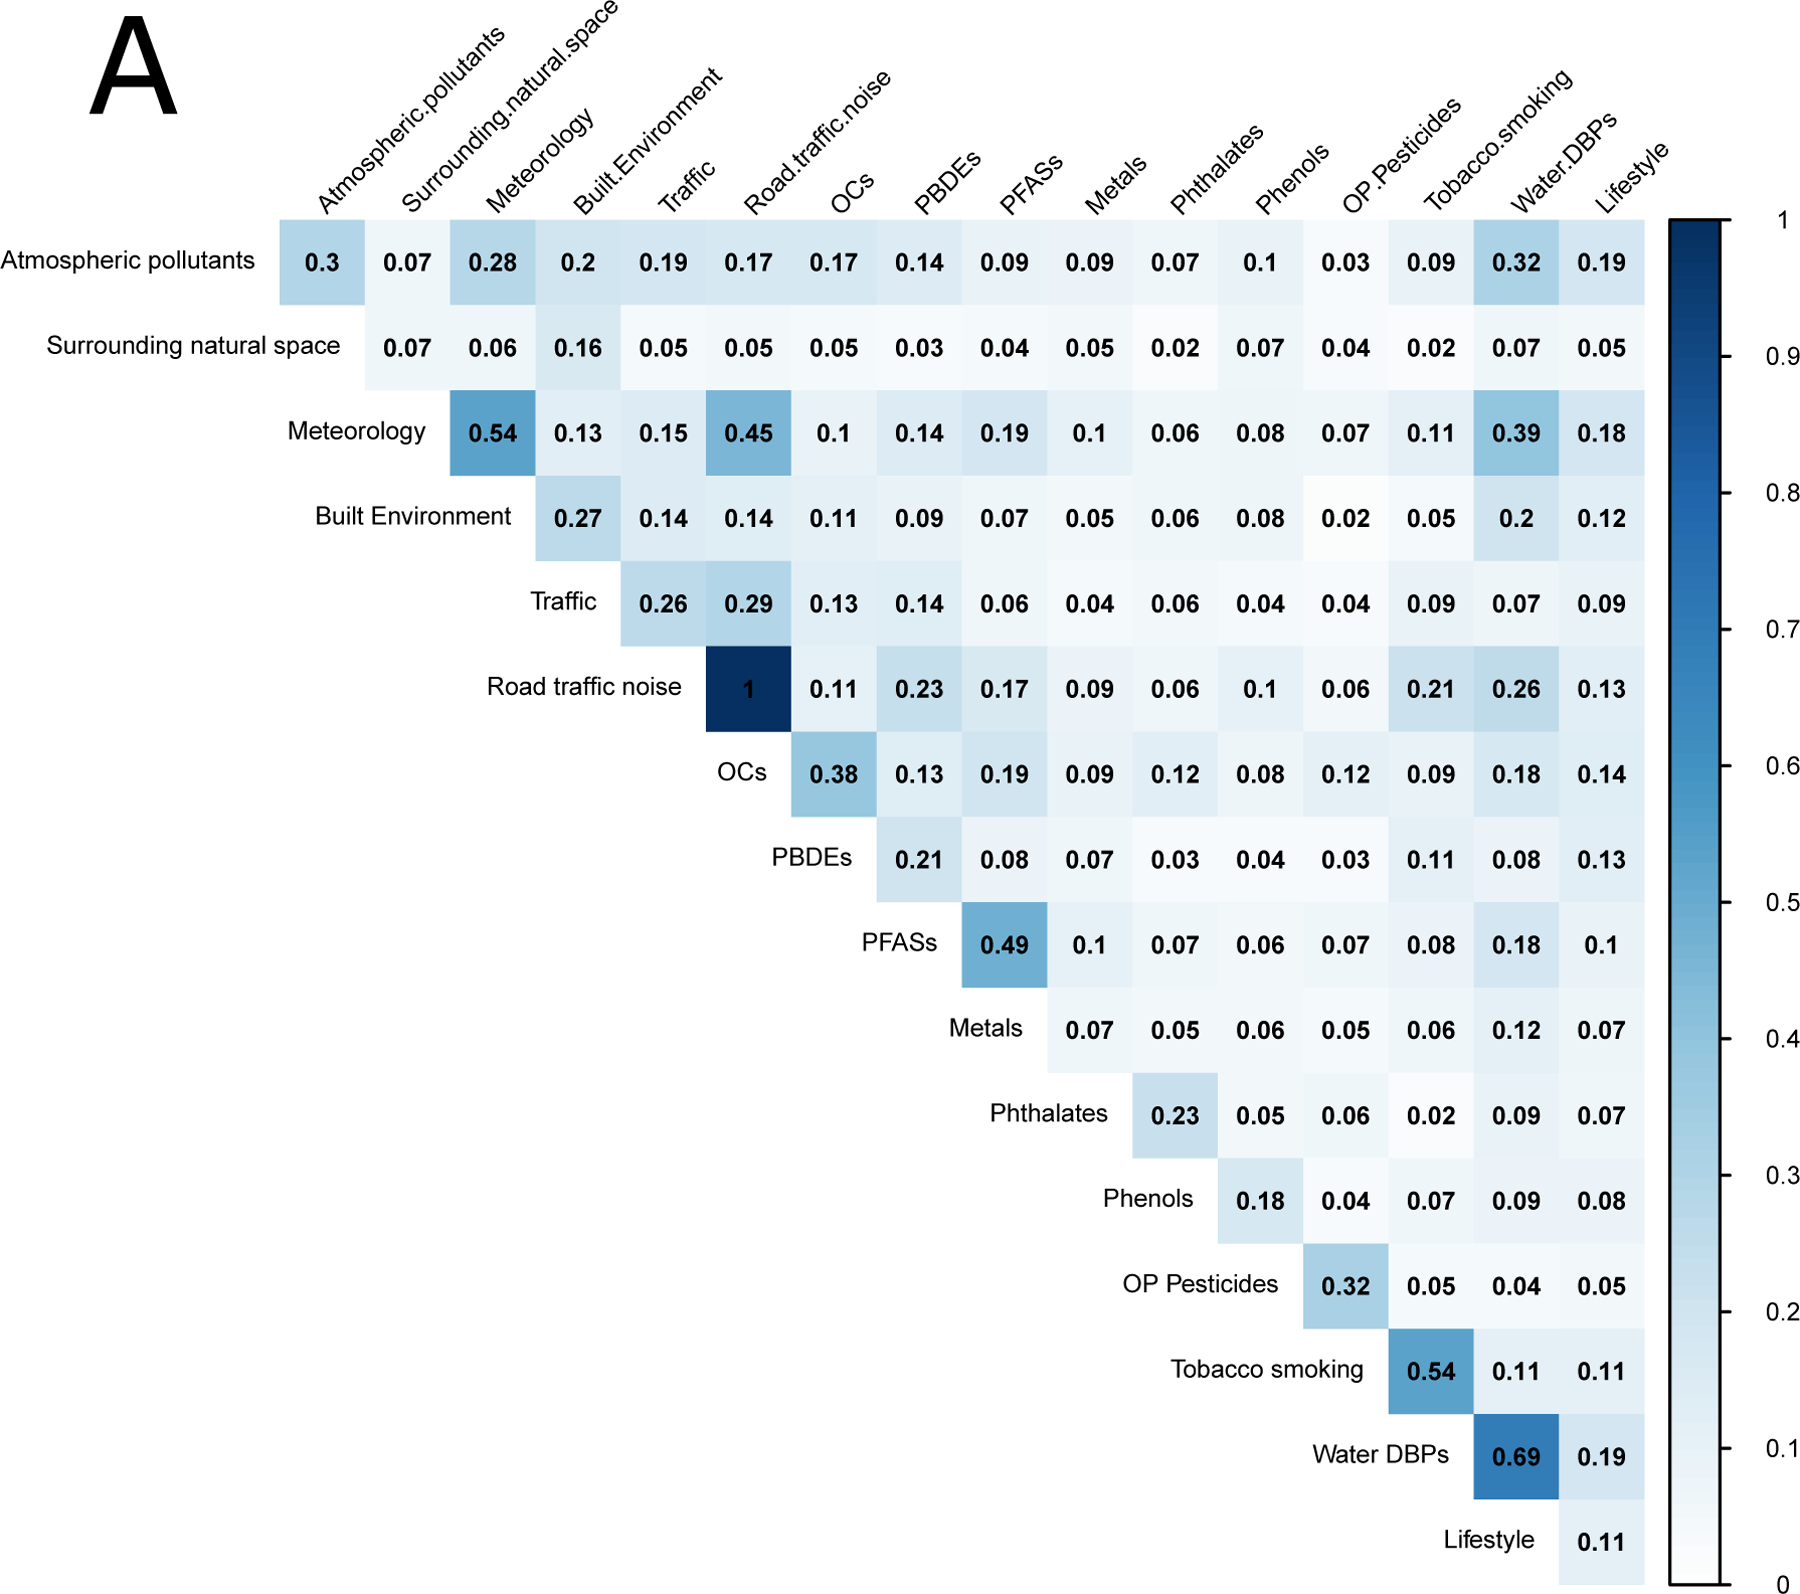
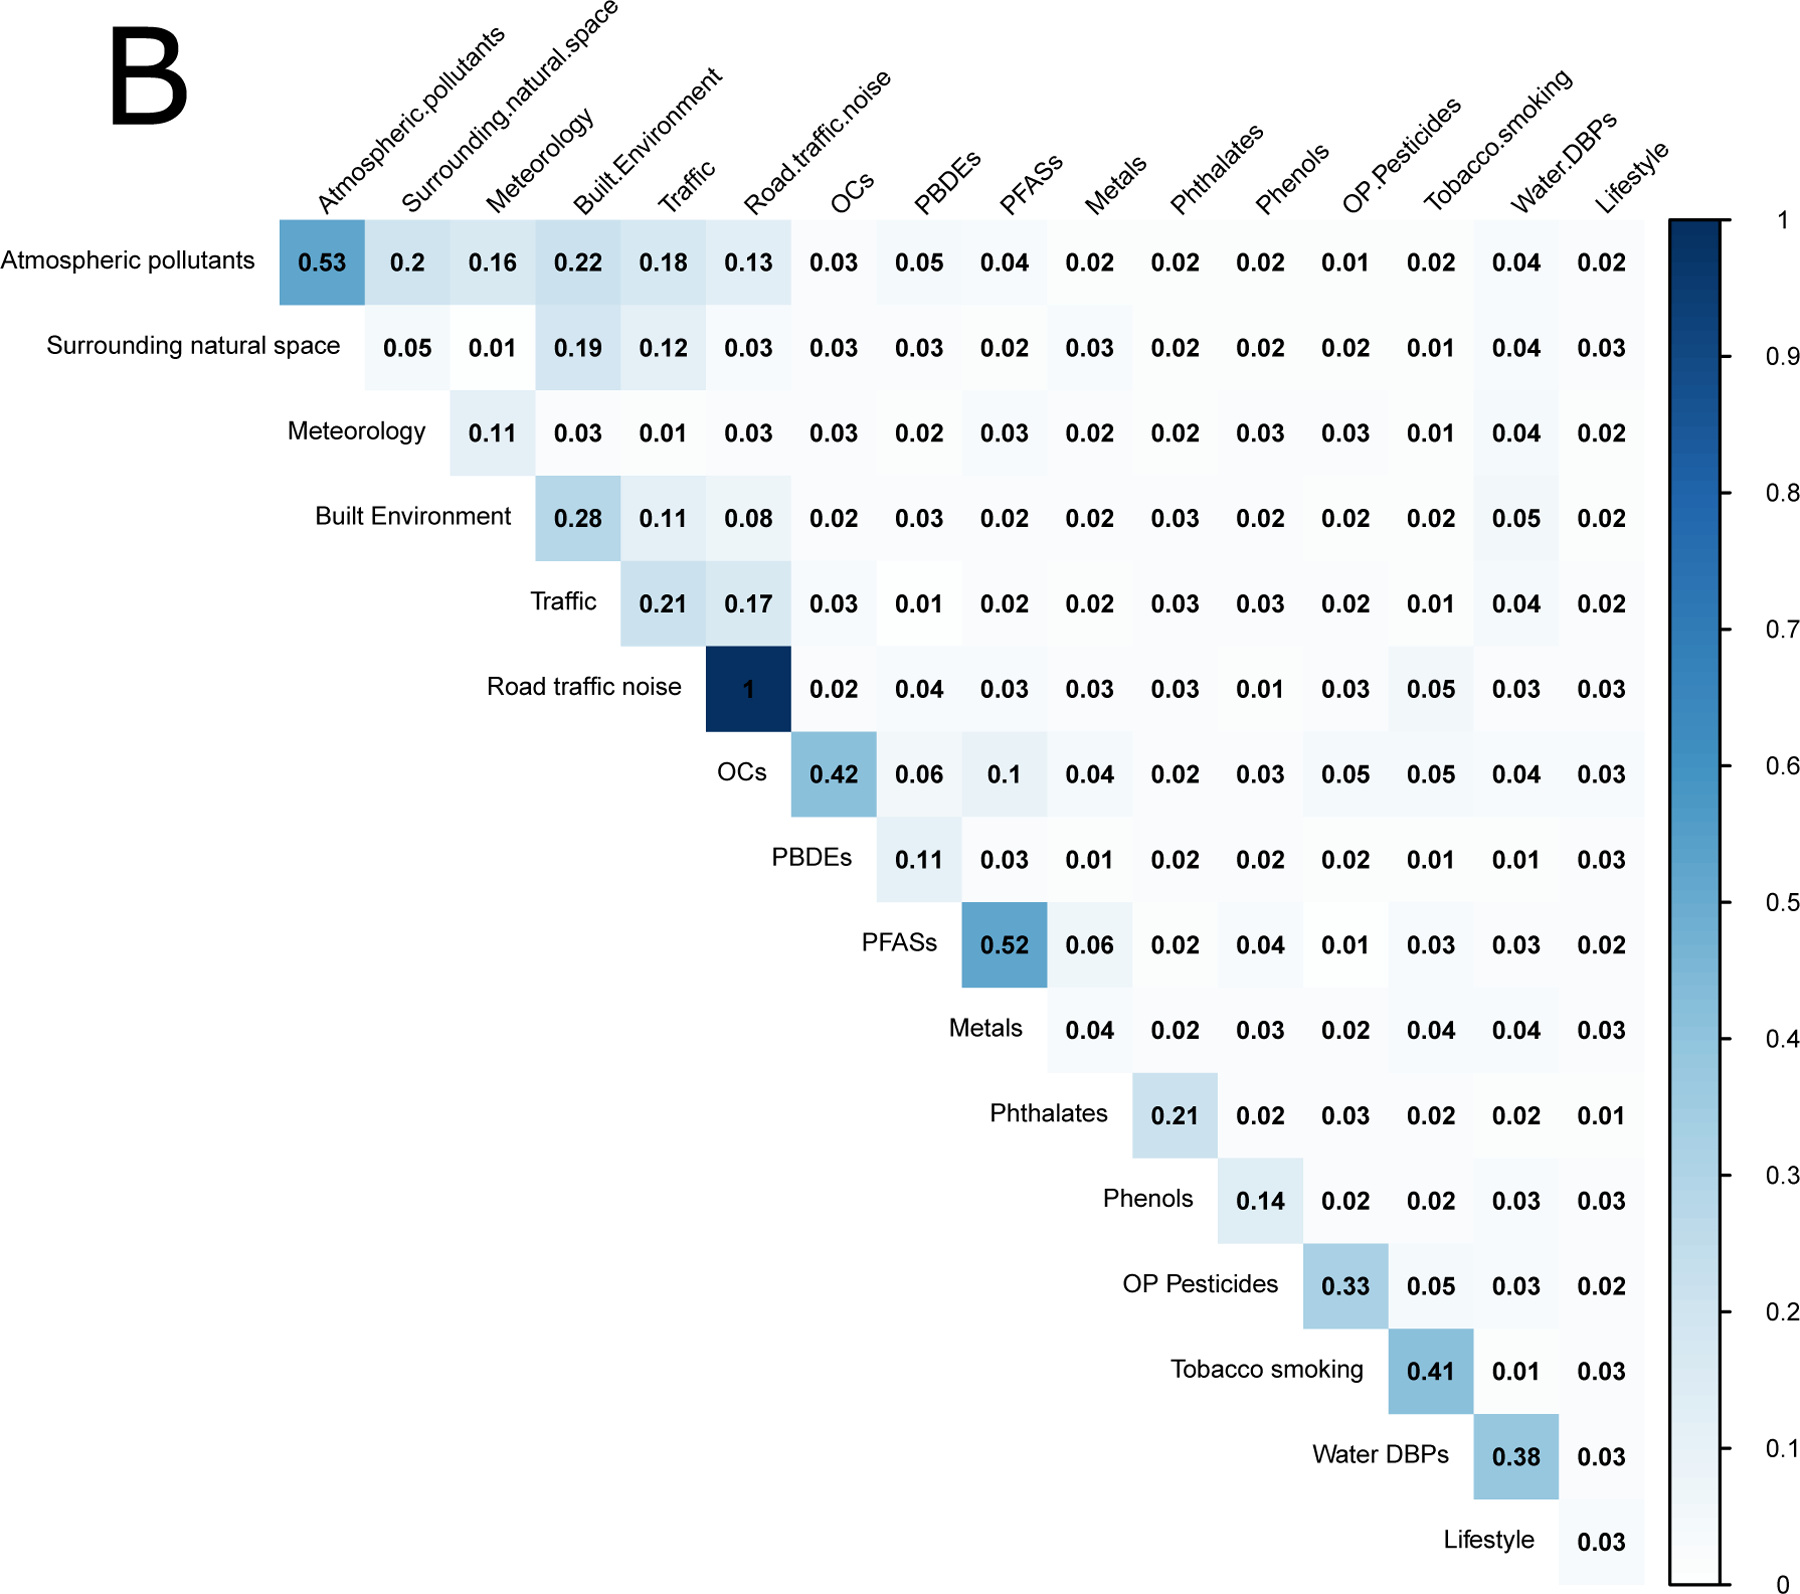
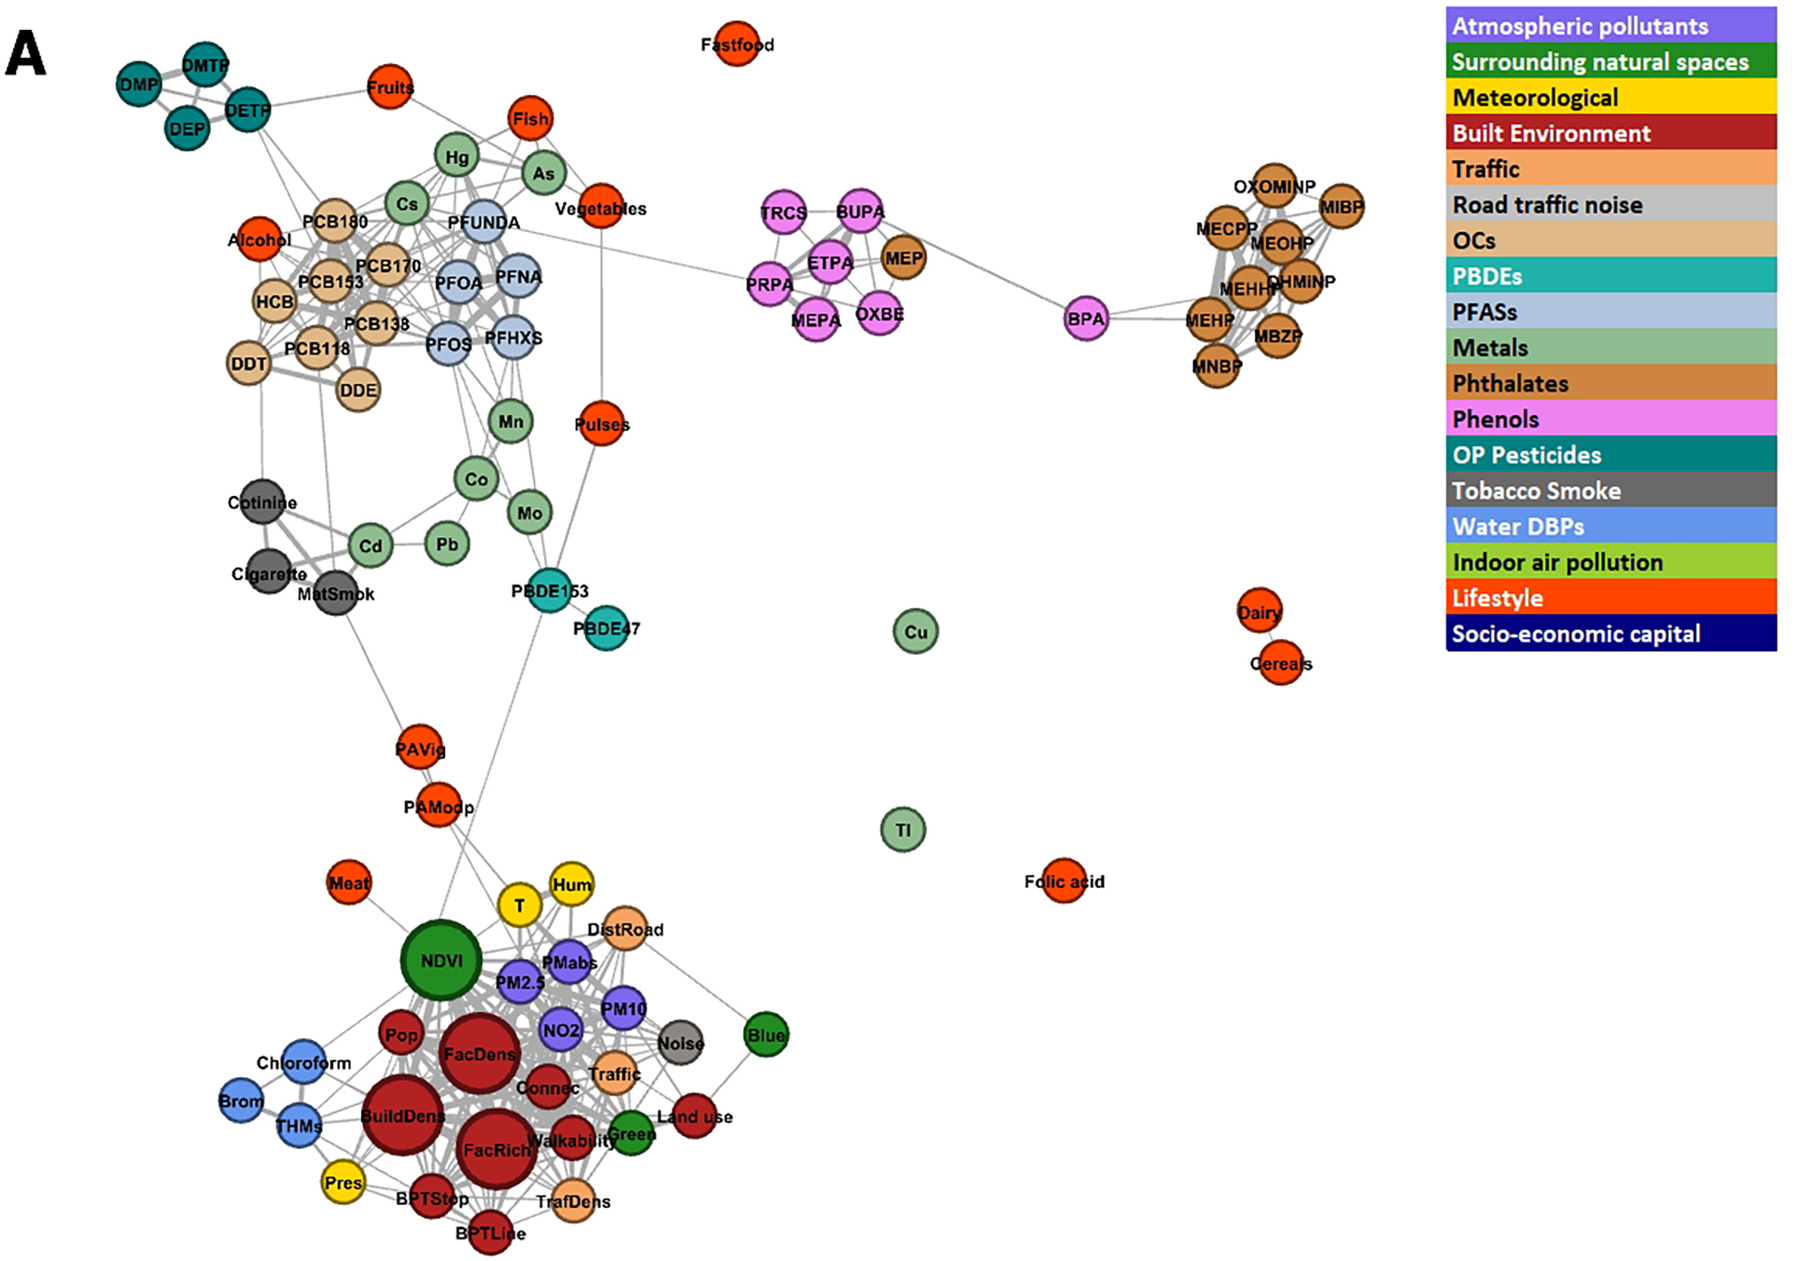
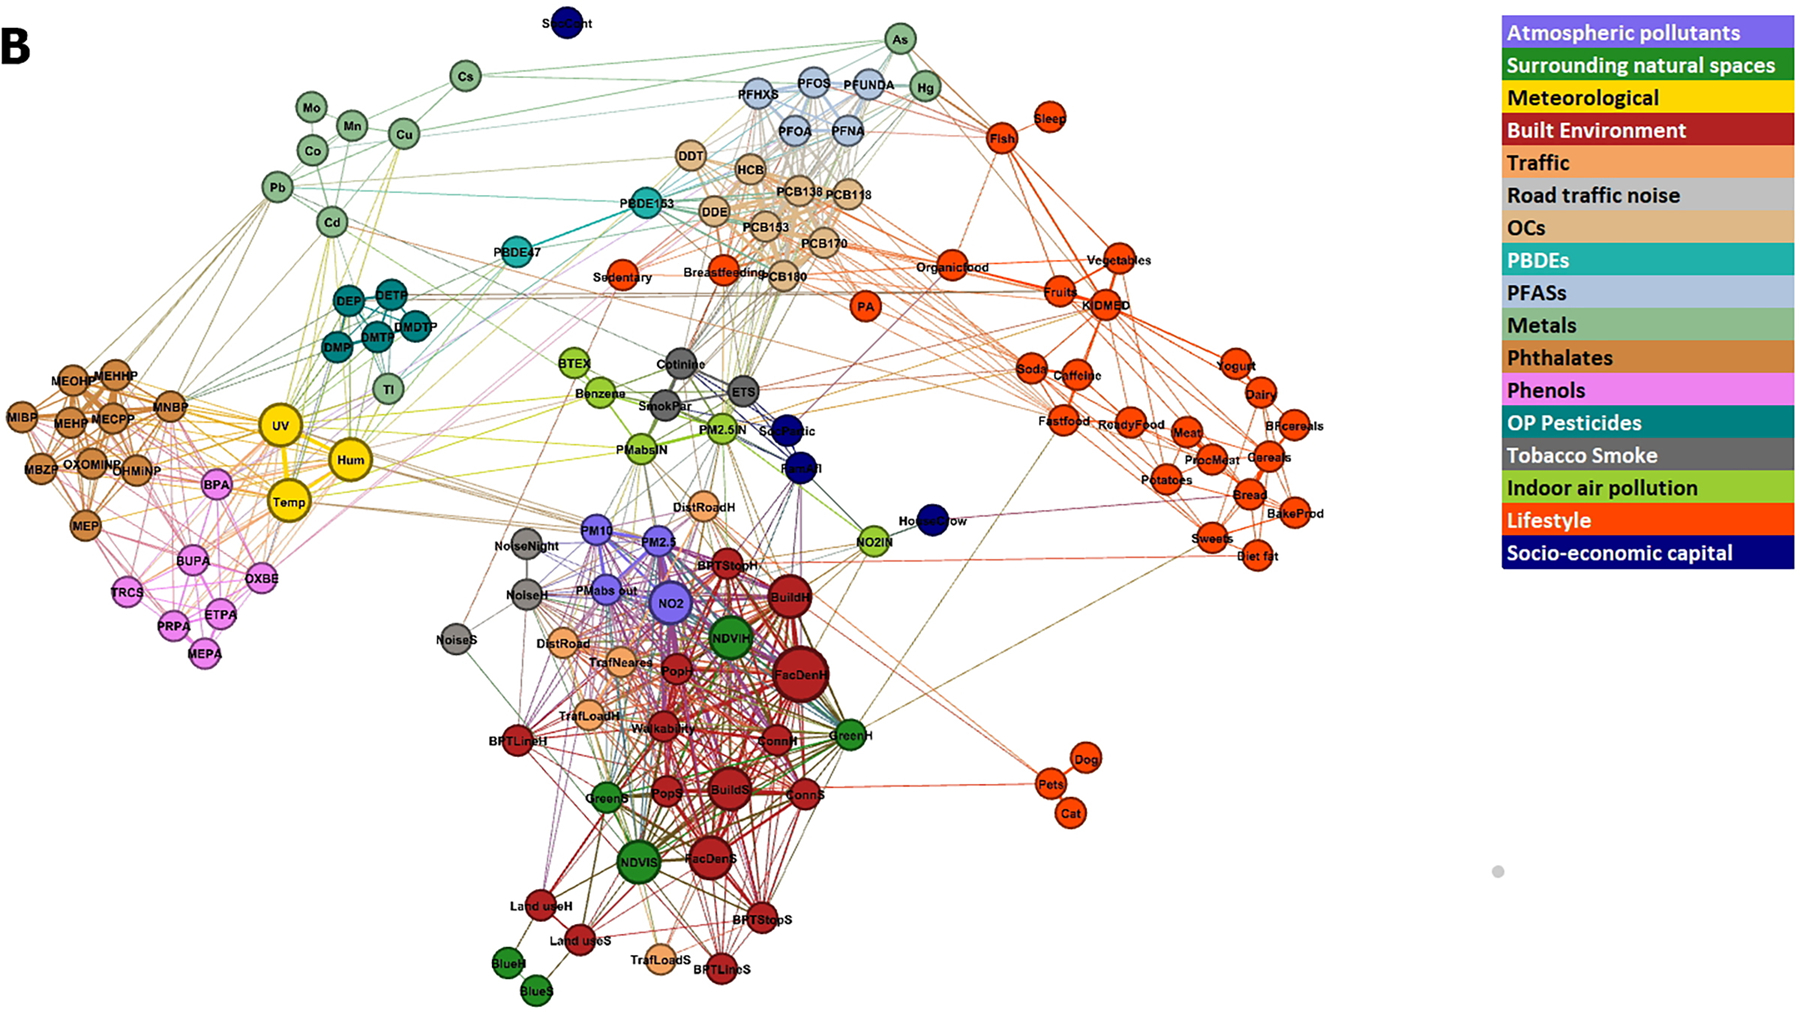
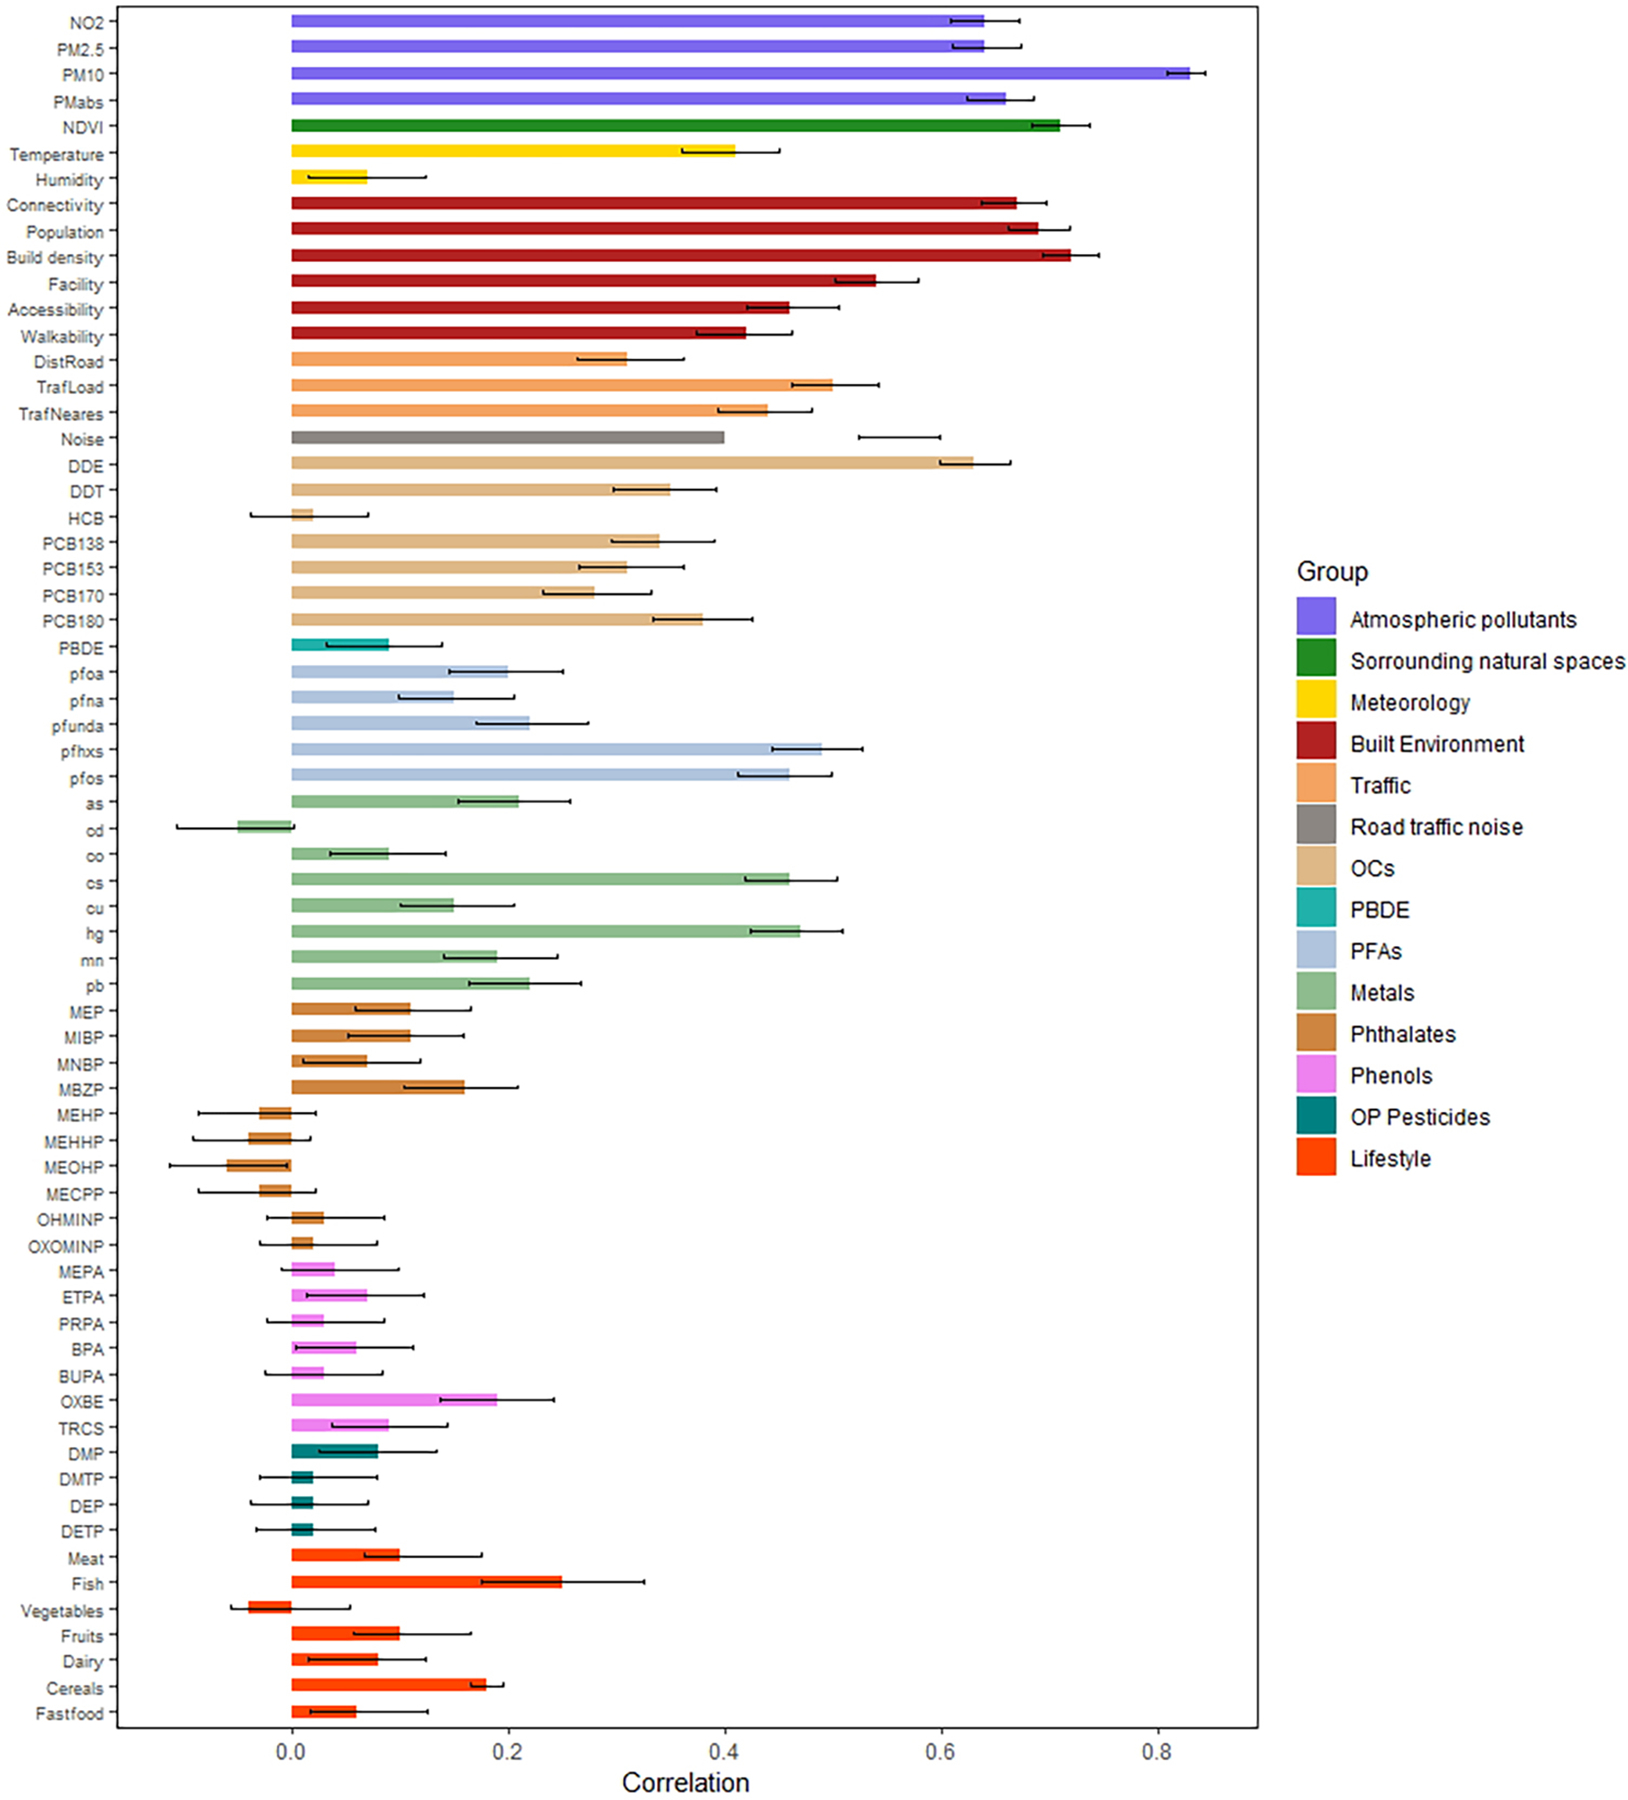
Characterization of the "exposome", the set of all environmental factors that one is exposed to from conception onwards, has been advocated to better understand the role of environmental factors on chronic diseases. Here, we aimed to describe the early-life exposome. Specifically, we focused on the correlations between multiple environmental exposures, their patterns and their variability across European regions and across time (pregnancy and childhood periods). We relied on the Human Early-Life Exposome (HELIX) project, in which 87 environmental exposures during pregnancy and 122 during the childhood period (grouped in 19 exposure groups) were assessed in 1301 pregnant mothers and their children at 6-11 years in 6 European birth cohorts. Some correlations between exposures in the same exposure group reached high values above 0.8. The median correlation within exposure groups was >0.3 for many exposure groups, reaching 0.69 for water disinfection by products in pregnancy and 0.67 for the meteorological group in childhood. Median correlations between different exposure groups rarely reached 0.3. Some correlations were driven by cohort-level associations (e.g. air pollution and chemicals). Ten principal components explained 45% and 39% of the total variance in the pregnancy and childhood exposome, respectively, while 65 and 90 components were required to explain 95% of the exposome variability. Correlations between maternal (pregnancy) and childhood exposures were high (>0.6) for most exposures modeled at the residential address (e.g. air pollution), but were much lower and even close to zero for some chemical exposures. In conclusion, the early life exposome was high dimensional, meaning that it cannot easily be measured by or reduced to fewer components. Correlations between exposures from different exposure groups were much lower than within exposure groups, which have important implications for co-exposure confounding in multiple exposure studies. Also, we observed the early life exposome to be variable over time and to vary by cohort, so measurements at one time point or one place will not capture its complexities.

Keywords: Children; Early life; Environmental exposures; Exposome; Pregnancy.


Figures

Figure 1.
Figure 1.. Profile of pregnancy* (A) and childhood** (B) exposures in the 6 cohorts according to the first component identified by PCA applied separately to each exposure group. Positive values indicate values above the overall mean, while negative values indicate values below the overall mean.
The loadings of each PCA analyses for all exposures are presented in Tables A.4.2 and A.4.3 in Annex 4. The exposures with highest loadings in each component were the following: *For the pregnancy period (exposure, loading): atmospheric pollutants (NO2, 0.95), surrounding natural space (green spaces, 0.99), meteorology (temperature, 0.94), built environment (facility richness, 0.94), traffic (inverse distance, 0.99), OCs (PCB180, 0.93), PBDEs (PBDE47, 0.99), PFASs (PFHXS, 0.92), metals (As, 0.8), phthalates (MEOHP, 0.93), phenols (ETPA, 0.95), OP pesticides (DMP, 0.93), tobacco smoking (Cotinine, 0.96), water DBPs (brominated THMs, 0.94), lifestyle (fruit 0.69). **For the childhood period (exposure, loading): atmospheric pollutants (PM2.5 0.87), surrounding natural space (NDVI school, 0.92), meteorology (temperature 0.93), built environment (population density, 0.89), traffic (inverse distance, 0.95), road traffic noise (noise all day, 0.33), OCs (PCB180, 0.97), PBDEs (PBDE153, 0.98), PFASs (PFUNDA, 0.92), metals (As, 0.96), phthalates (MEHHP, 0.97), phenols (PRPA, 0.91), OP pesticides (DMP, 0.96), tobacco smoking (ETS, 0.96), lifestyle (KIDMED score, 0.80), indoor air (indoor PM2.5, 0.96), socio-eco capital (social participation, 0.99).
Figure 2:
Figure 2:
Median absolute correlations within exposure groups (diagonal) and between exposure groups (off-diagonal) in the pregnancy period. Panel (A) shows overall correlations and panel (B) shows within-cohort correlations.
Figure 2:
Figure 2:
Median absolute correlations within exposure groups (diagonal) and between exposure groups (off-diagonal) in the pregnancy period. Panel (A) shows overall correlations and panel (B) shows within-cohort correlations.
Figure 3.
Figure 3.. Network visualization of the exposome.
The size of the nodes is proportional to the number of correlations were greater than 0.5 outside the exposure group and the length of the edges is proportional to the inverse of the correlation (the higher the correlation, the shorter the edge length) between exposures. The colour of the nodes represents the pre-defined exposure groups. The minimum absolute correlation to create an edge was 0.10. Figure 3A shows the pregnancy exposome, and Figure 3B shows the childhood exposome. Networks were built using within-cohort correlations.
Figure 4.
Figure 4.
Correlation of exposures levels between the pregnancy and childhood periods

References

    1. Agier L, Portengen L, Chadeau-Hyam M, Basagaña X, Giorgis-Allemand L, Siroux V, Robinson O, Vlaanderen J, González JR, Nieuwenhuijsen MJ, Vineis P, Vrijheid M, Slama R, Vermeulen R, 2016. A Systematic Comparison of Linear Regression–Based Statistical Methods to Assess Exposome-Health Associations. Environ. Health Perspect 124, 1848–1856. 10.1289/EHP172 - DOI - PMC - PubMed
    1. Barrera-Gómez J, Agier L, Portengen L, Chadeau-Hyam M, Giorgis-Allemand L, Siroux V, Robinson O, Vlaanderen J, González JR, Nieuwenhuijsen M, Vineis P, Vrijheid M, Vermeulen R, Slama R, Basagaña X, 2017. A systematic comparison of statistical methods to detect interactions in exposome-health associations. Environ. Health Glob. Access Sci. Source 16, 74. 10.1186/s12940-017-0277-6 - DOI - PMC - PubMed
    1. Basagaña X, Pedersen M, Barrera-Gómez J, Gehring U, Giorgis-Allemand L, Hoek G, Stafoggia M, Nieuwenhuijsen MJ, Brunekreef B, Slama R, ESCAPE Birth Outcomes working group, 2018. Analysis of multicentre epidemiological studies: contrasting fixed or random effects modelling and meta-analysis. Int. J. Epidemiol 10.1093/ije/dyy117 - DOI - PubMed
    1. Bastian M, Heymann S, Jacomy M, 2009. Gephi: an open source software for exploring and manipulating networks. Int. AAAI Conf. Weblogs Soc. Media
    1. Buuren S. van, Groothuis-Oudshoorn K, 2011. mice : Multivariate Imputation by Chained Equations in R. J. Stat. Softw 45, 1–67. 10.18637/jss.v045.i03 - DOI

Publication types