

Developmental and functional heterogeneity of white adipocytes within a single fat depot
- PMID: 30530479
- PMCID: PMC6356065
- DOI: 10.15252/embj.201899291
Developmental and functional heterogeneity of white adipocytes within a single fat depot
Abstract
Recent studies suggest that, even within a single adipose depot, there may be distinct subpopulations of adipocytes. To investigate this cellular heterogeneity, we have developed multiple conditionally immortalized clonal preadipocyte lines from white adipose tissue of mice. Analysis of these clones reveals at least three white adipocyte subpopulations. These subpopulations have differences in metabolism and differentially respond to inflammatory cytokines, insulin, and growth hormones. These also have distinct gene expression profiles and can be tracked by differential expression of three marker genes: Wilms' tumor 1, transgelin, and myxovirus 1. Lineage tracing analysis with dual-fluorescent reporter mice indicates that these adipocyte subpopulations have differences in gene expression and metabolism that mirror those observed in the clonal cell lines. Furthermore, preadipocytes and adipocytes from these subpopulations differ in their abundance in different fat depots. Thus, white adipose tissue, even in a single depot, is comprised of distinct subpopulations of white adipocytes with different physiological phenotypes. These differences in adipocyte composition may contribute to the differences in metabolic behavior and physiology of different fat depots.
Keywords: adipose tissue; development; lineage tracing; metabolic syndrome; obesity.
© 2018 The Authors.
Figures
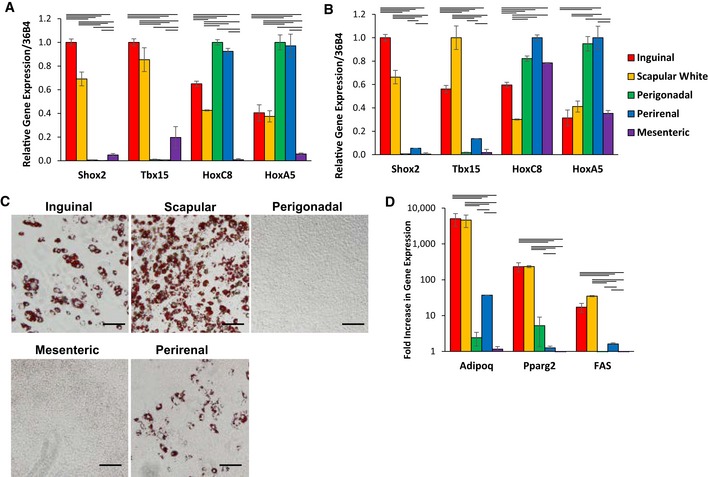
Expression level of Shox2, Tbx15, HoxC8, and HoxC5, mRNA was compared using quantitative real‐time PCR (qPCR) of RNA isolated from different fat depots. Two subcutaneous depots (inguinal and scapular white), three intra‐abdominal fat depots (perigonadal, perirenal, and mesenteric), and interscapular brown adipose tissue of 8‐week‐old male C57BL/6 mice. Data are shown as mean ± SEM of six samples.
Expression level of Shox2, Tbx15, HoxC8, and HoxC5, mRNA was compared using qPCR of RNA isolated from cultured stromovascular cells derived from adipose tissue of the Immortomouse™. The depot‐specific cell lines were made from inguinal, scapular white, perigonadal, perirenal, mesenteric, and interscapular brown adipose tissue of 8‐week‐old male mice. Data are shown as mean ± SEM of cell lines from three individual mice.
Bright‐field image of depot‐derived cell lines after in vitro adipogenic differentiation and Oil Red O staining (Lee et al, 2017a). Original photographs were taken at 10× magnification (left panel). Scale bar = 100 μm.
qPCR analysis for adiponectin (Adipoq), peroxisome proliferator‐activated receptor gamma (Pparγ2), and fatty acid synthase (FAS) in RNA isolated from depot‐derived cell lines after in vitro differentiation. Data are shown as mean ± SEM of three cell lines/group.
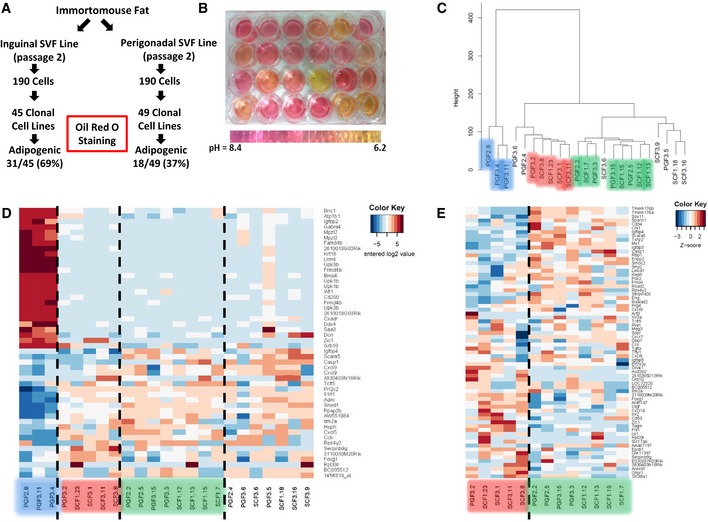
Schematic depicting the experimental design of establishing clonal cell lines from the SVF isolated from inguinal and perigonadal clonal cell lines.
Representative picture of preadipocyte clonal cell lines showing media color 48 h after last media change. Cells in all wells were 100% confluent when media was changed.
Hierarchical clustering of preadipocyte clonal cell line gene expression using Ward's agglomeration.
Heatmap depicting the 50 most variable genes among all preadipocyte clonal cell lines. Red represents high expression of genes, while blue represents low expression of genes.
Heatmap depicting the 50 most variable genes among Type 2 and 3 preadipocyte clonal cell lines. Red represents high expression of genes, while blue represents low expression of genes.
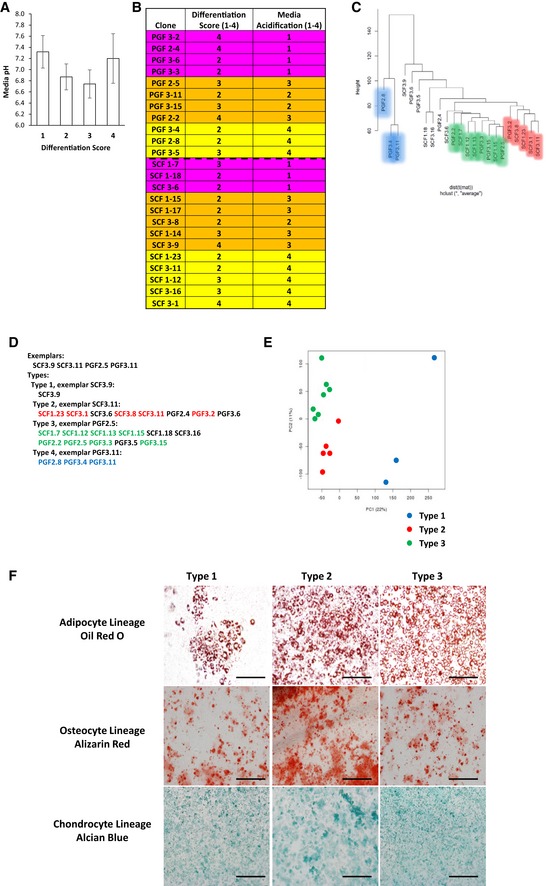
pH measurement of confluent preadipocyte cell lines with different adipogenic differentiation potential. The cells were scored on a scale from 1 to 4 for adipogenic differentiation after Oil Red O staining (1: < 25%; 2: 25–50%; 3: 50–75%, and 4: 75–100% of cells differentiated). Data are shown as mean ± SEM of 4–10 cell lines/group.
Clonal preadipocyte cell lines used for microarray analysis. Cells were scored on a scale from 1 to 4 for adipogenic differentiation after Oil Red O staining (1: < 25%; 2: 25–50%; 3: 50–75%, and 4: 75–100% of cells differentiated) and 1–4 for media acidification by media color based on scale in Fig 2B (1: pH < 6.5; 2: pH from 6.5 to 6.9; 3: pH from 7.0 to 7.6; 4: pH > 7.7). Cells were selected for differentiation scores of 2 or greater and variable media acidification rates.
Affinity propagation clustering of preadipocyte clonal cell line gene expression. Exemplars are representatives of their cluster.
Hierarchical clustering utilizing the average method of agglomeration of preadipocyte clonal cell line gene expression.
Principal component analysis of preadipocyte clonal cell line gene expression.
Bright‐field image of clonal preadipocyte lines after in vitro adipogenic, osteogenic, and chondrogenic differentiation. Adipocytes, osteocytes, and chondrocytes were stained with Oil Red O, Alizarin Red, and Alcian Blue, respectively. Original photographs were at 10× magnification (left panel). Scale bar = 100 μm.
- A–C
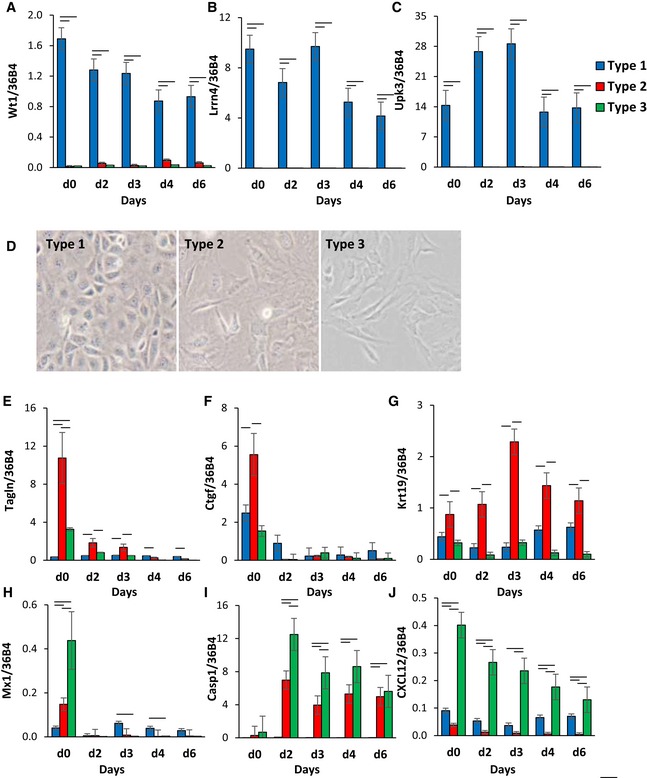
Expression of Wt1, leucine‐rich repeat neuronal 4 (Lrrn4), uroplakin 3b (Upk3b) in Immortomouse clonal cell line clusters as preadipocytes (d0) and during 6 days of adipogenic differentiation. Data are shown as mean ± SEM of 3–7 cell lines/group. Bars indicate significant differences between groups (P < 0.05; paired two‐way ANOVA).
- D
Bright‐field images of preadipocyte cell lines under standard culture conditions. The photographs were taken at 10× magnification.
- E–J
Expression of Tagln, connective tissue growth factor (Ctgf), keratin 19 (Krt19), Mx1, caspase 1 (Casp1), and C‐X‐C motif chemokine ligand 12 (Cxcl12) in Immortomouse clonal cell line clusters as preadipocytes (d0) and during 6 days of adipogenic differentiation. Data are shown as mean ± SEM of 3–7 cell lines/group. Bars indicate significant differences between groups (P < 0.05; paired two‐way ANOVA).
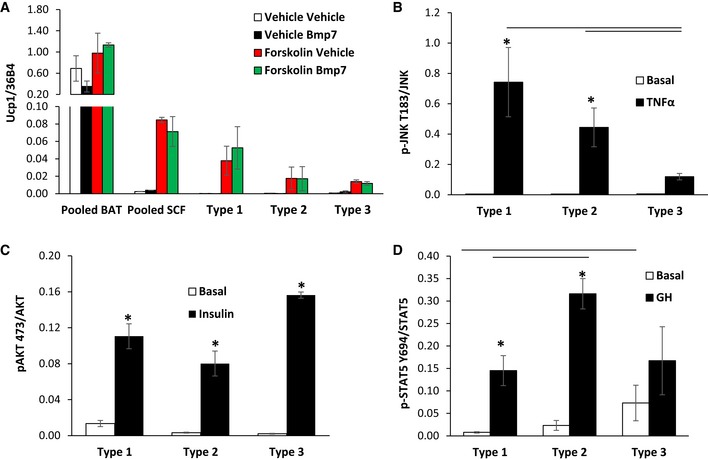
- A
qPCR analysis for Ucp1 in RNA isolated from Immortomouse adipocyte cell lines: pooled brown (BAT), pooled subcutaneous (SCF), Type 1, Type 2, and Type 3, after in vitro differentiation. Cells were treated ± 3.3 nM BMP7 for 3 days prior to differentiation or treated ± 10 μM forskolin for 4 h. Data are shown as mean ± SEM of 2–7 cell lines per group.
- B–D
Quantitation of Western blots depicted in Fig 4I. Data are shown as mean ± SEM of three independent cell lines per group; each experiment was performed at least twice. Bars indicate significant differences between groups (P < 0.05; two‐way ANOVA) in all panels. Asterisks indicate significant differences between basal and treated samples (P < 0.05; Student's t‐test).
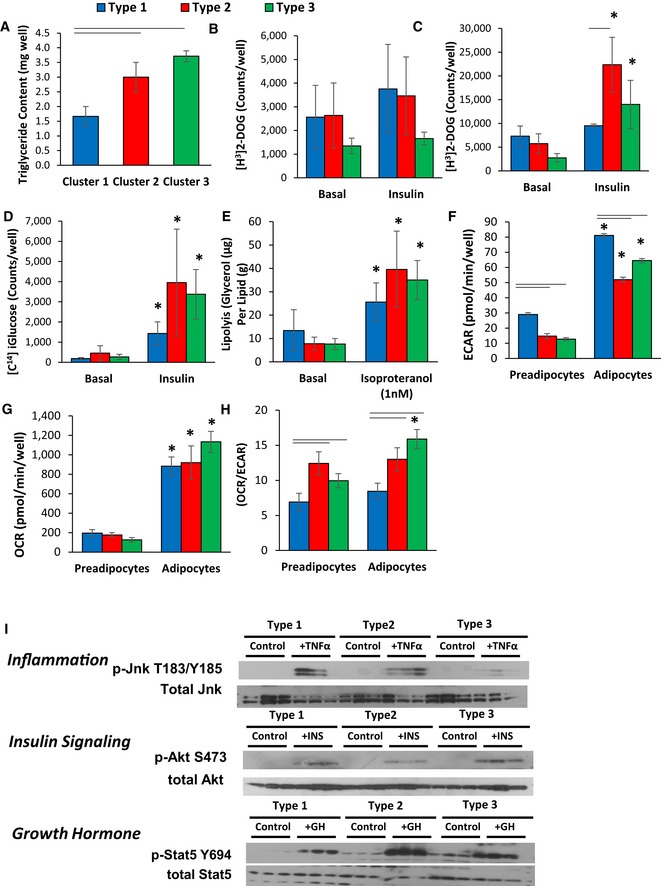
Triglyceride content of cell cultures after 6 days of differentiation using the protocol described in Materials and Methods. Data are shown as mean ± SEM of 3–7 samples, and the entire experiment was repeated twice.
[3H]‐labeled 2‐deoxyglucose uptake in preadipocyte cell lines in the basal state and after pretreatment for 20 min with 100 nM insulin. Uptake was measured for 1 h, and data are shown as mean ± SEM of 3–7 samples and repeated twice.
[3H]‐labeled 2‐deoxyglucose uptake in adipocytes after 6 days of adipogenic differentiation in the basal state and after stimulation for 20 min with 100 nM insulin. Uptake was measured for 1 h, and data are shown as mean ± SEM of 3–7 samples. The experiment was repeated twice.
[14C] D‐glucose incorporation into lipids in adipocytes after 6 days of adipogenic differentiation in the basal state and after stimulation for 20 min with 100 nM insulin. [14C] D‐glucose incorporation was measured after 3 h, and data are shown as mean ± SEM of 3–7 samples. The experiment was repeated twice.
Lipolysis rates after stimulation with 1 nM isoproterenol as measured by glycerol release from adipocytes after 6 days of adipogenic differentiation. Data are shown as mean ± SEM of 3–7 replicates and normalized by lipid content of the cells. The entire experiment was repeated twice.
Extracellular acidification rate (ECAR) of preadipocytes and adipocytes after 4 days of in vitro differentiation was determined by calculating the area under the curve (AUC) during measurements of basal respiration. The whole experiment was repeated three times. Data are shown as mean ± SEM of 3–7 cell lines per group.
Basal respiration of preadipocytes and adipocytes after 4 days of in vitro differentiation was determined by calculating the area under the curve (AUC) during measurements of oxygen consumption rate (OCR). The whole experiment was repeated three times. Data are shown as mean ± SEM of 3–7 cell lines per group.
Ratio of oxygen consumption rate (OCR) to extracellular acidification rate (ECAR) of preadipocytes and adipocytes after 4 days of in vitro differentiation. Data are shown as mean ± SEM of 3–7 cell lines per group.
Representative Western blot analysis of three independent adipocyte cell lines after 6 days of in vitro differentiation for: pJnk T183/Y185 and total Jnk after treatment with 10 nM TNFα for 15 min (Inflammation); pAkt S473 and total Akt after treatment with 100 nM insulin for 15 min (Insulin Signaling); pStat5 Y694 and total Stat5 after treatment with 500 nM GH for 20 min (Growth Hormone).
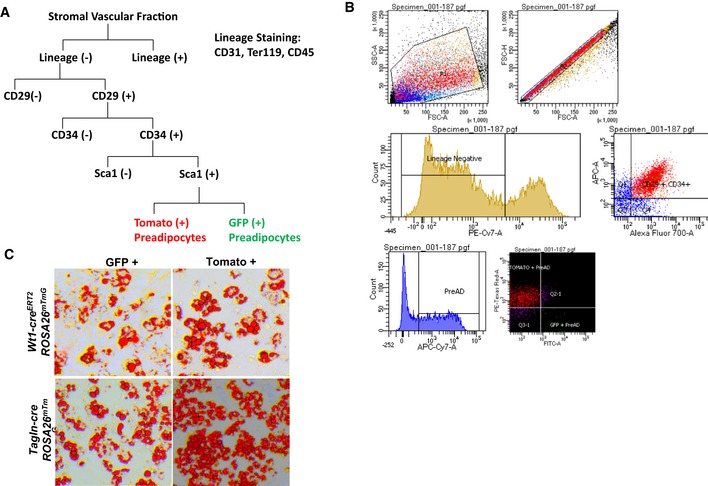
Schematic of FACS sorting for GFP‐ and Tomato‐positive preadipocytes.
Representative FACS plot of LacZ (+) APCs from the subcutaneous and perigonadal fat depots of Tbx15‐LacZ male mice at 6–8 weeks of age.
Bright‐field image of primary mGFP‐ and mTomato‐positive preadipocytes after in vitro adipogenic differentiation. Neutral lipids were stained with Oil Red O, and original photographs were at 10× magnification (left panel).
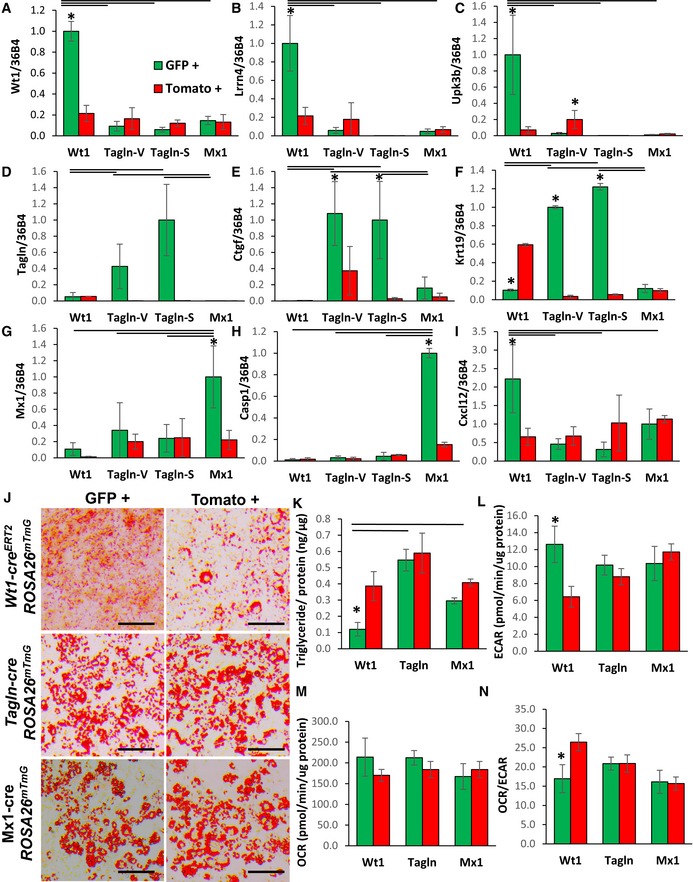
- A–I
Expression of Wt1, Lrrn4, Upk3b, Tagln, Ctgf, Krt19, Mx1, Casp1, and Cxcl12 in primary preadipocytes isolated from white adipose tissue of 5‐ to 6‐month‐old Wt1‐creERT2;Rosa26mT/mG, Tagln‐cre;Rosa26mT/mG, and Mx1‐cre;Rosa26mT/mG male mice. mGFP‐ and mTomato‐positive preadipocytes were isolated from the pooled visceral fat depots (perigonadal, perirenal, mesenteric, and pericardial) of Wt1‐creERT2;Rosa26mT/mG mice, the pooled subcutaneous fat depots (subcutaneous and scapular white) of Mx1‐cre;Rosa26mT/mG, and both the pooled visceral (Tagln–V) and subcutaneous depots (Tagln‐S) from Tagln‐cre;Rosa26mT/mG mice. Data are shown as mean ± SEM of 4‐6 mice/group.
- J
Bright‐field image of immortalized mGFP‐ and mTomato‐positive preadipocytes after in vitro adipogenic differentiation. Neutral lipoids were stained with Oil Red O, and original photographs were at 10× magnification (left panel). Scale bar = 100 μm.
- K
Triglyceride content of immortalized mGFP‐ and mTomato‐positive preadipocytes after 6 days of differentiation. Data are shown as mean ± SEM of 5–8 replicates, and the entire experiment was repeated with three independent cell lines.
- L
Basal extracellular acidification rate (ECAR) of immortalized mGFP‐ and mTomato‐positive preadipocytes was determined by calculating the area under the curve (AUC) in basal conditions. The whole experiment was repeated twice. Data are shown as mean ± SEM of three cell lines per group.
- M
Basal respiration of preadipocytes was of immortalized mGFP‐ and mTomato‐positive preadipocytes determined by calculating the area under the curve (AUC) during measurements of oxygen consumption rate (OCR). The whole experiment was repeated twice. Data are shown as mean ± SEM of three cell lines per group.
- N
Ratio of basal oxygen consumption rate (OCR) to basal extracellular acidification rate (ECAR) of immortalized mGFP‐ and mTomato‐positive preadipocytes. Data are shown as mean ± SEM of three cell lines per group.
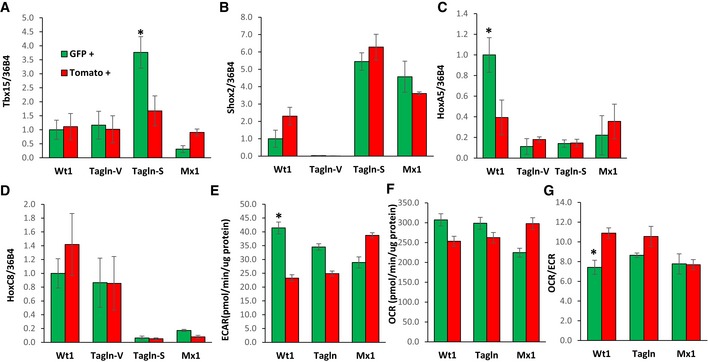
- A–D
Expression levels of Shox2, Tbx15, HoxC8, and HoxC5 mRNA were compared using quantitative real‐time PCR (qPCR) in primary preadipocytes isolated from white adipose tissue of 5‐ to 6‐month‐old Wt1‐creERT2;Rosa26mT/mG, Tagln‐cre;Rosa26mT/mG, and Mx1‐cre;Rosa26mT/mG male mice. mGFP‐ and mTomato‐positive preadipocytes were isolated from the pooled visceral fat depots (perigonadal, perirenal, mesenteric, and pericardial) of Wt1‐creERT2;Rosa26mT/mG mice, the pooled subcutaneous fat depots (subcutaneous and scapular white) of Mx1‐cre;Rosa26mT/mG, and both the pooled visceral (Tagln–V) and subcutaneous depots (Tagln‐S) from Tagln‐cre;Rosa26mT/mG mice. Data are shown as mean ± SEM of 4‐6 mice/group.
- E
Maximal extracellular acidification rate (ECAR) of immortalized mGFP‐ and mTomato‐positive preadipocytes was determined by calculating the area under the curve (AUC) during measurements of maximal extracellular acidification rate. The whole experiment was repeated twice. Data are shown as mean ± SEM of three cell lines per group.
- F
Maximal respiration of preadipocytes was of immortalized mGFP‐ and mTomato‐positive preadipocytes determined by calculating the area under the curve (AUC) during measurements maximal of oxygen consumption rate (OCR). The whole experiment was repeated twice. Data are shown as mean ± SEM of three cell lines per group.
- G
Ratio of maximal oxygen consumption rate (OCR) to maximal extracellular acidification rate (ECAR) of immortalized mGFP‐ and mTomato‐positive preadipocytes.
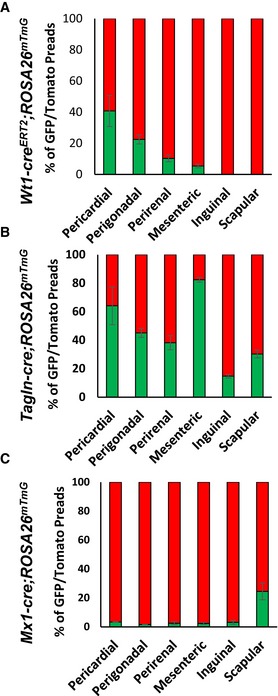
- A–C
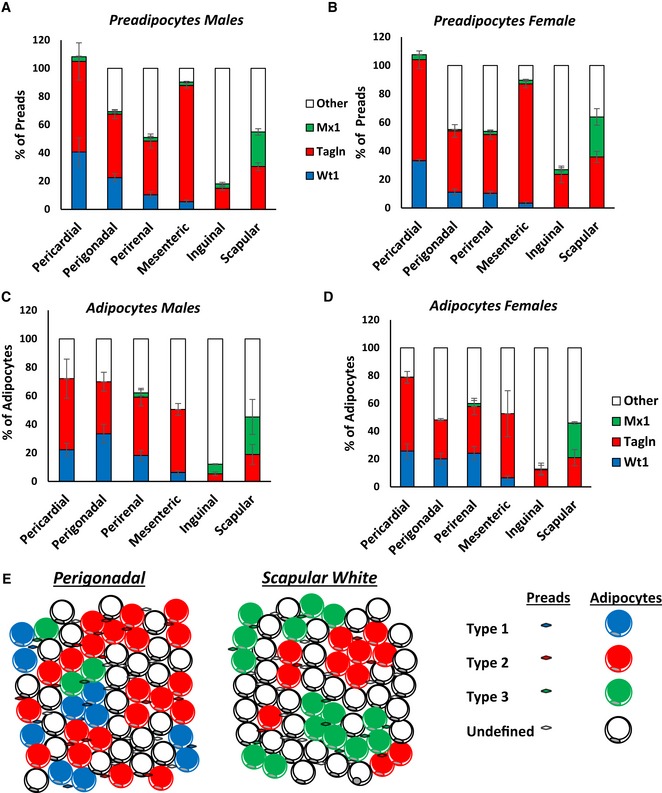
Number of mGFP‐ and mTomato‐positive preadipocytes isolated by FACS from the indicated white adipose depots from 5‐ to 6‐month‐old male Wt1‐creERT2;Rosa26mT/mG, Tagln‐cre;Rosa26mT/mG, and Mx1‐cre;Rosa26mT/mG mice. Data are shown as mean ± SEM of 4–9 mice.
- A–C
Number of mGFP‐ and mTomato‐positive preadipocytes isolated by FACS from each of the indicated white adipose depots from 5‐ to 6‐month‐old female Wt1‐creERT2;Rosa26mT/mG, Tagln‐cre;Rosa26mT/mG, and Mx1‐cre;Rosa26mT/mG mice. Data are shown as mean ± SEM of 4–9 mice.
- D–F
Quantitation of mGFP‐ and mTomato‐positive adipocytes from each of the indicated white adipose depots from 5‐ to 6‐month‐old female Wt1‐creERT2;Rosa26mT/mG, Tagln‐cre;Rosa26mT/mG, and Mx1‐cre;Rosa26mT/mG mice. Adipocytes were counted from four non‐overlapping images/depot/mouse. Data are shown as mean ± SEM of 4–9 mice.
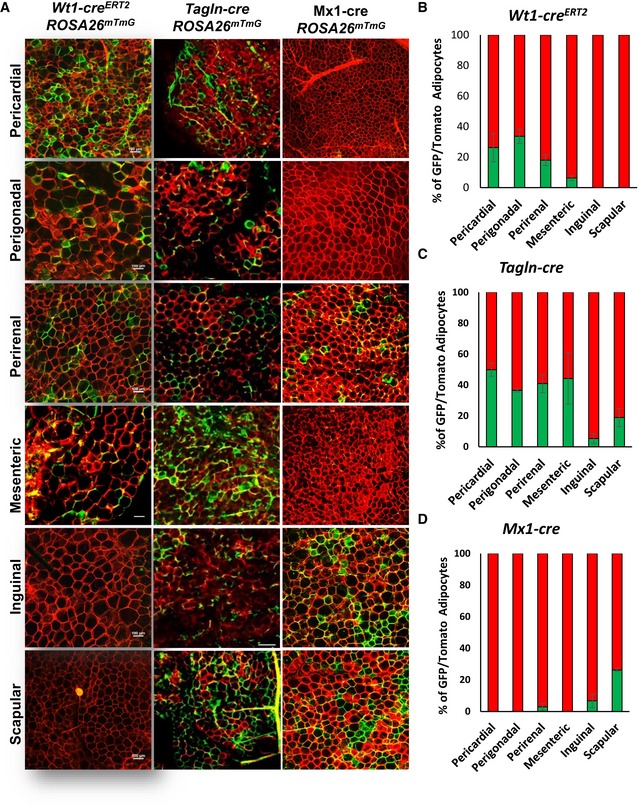
- A
Representative images of whole‐mount preparations of the indicated white adipose tissue depots of 5‐ to 6‐month‐old Wt1‐creERT2;Rosa26mT/mG, Tagln‐cre;Rosa26mT/mG, and Mx1‐cre;Rosa26mT/mG male mice. The photographs were taken at 10× magnification. Scale bar = 100 μm.
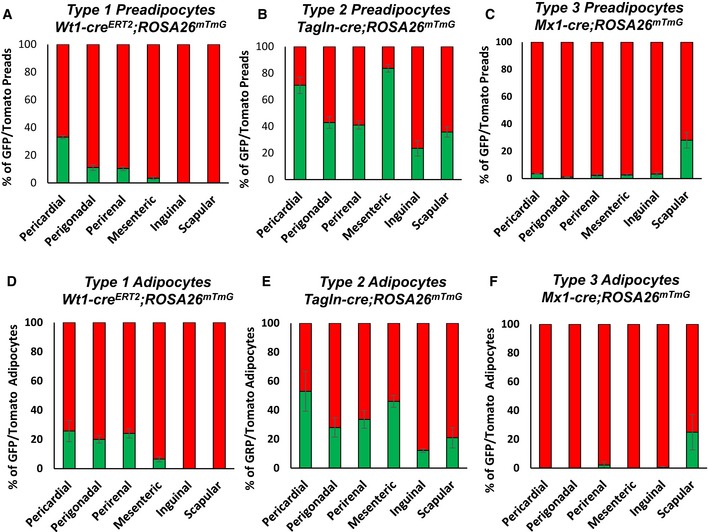
- B–D
Quantitation of mGFP‐ and mTomato‐positive adipocytes from each of the indicated white adipose depots from 5‐ to 6‐month‐old male Wt1‐creERT2;Rosa26mT/mG, Tagln‐cre;Rosa26mT/mG, and Mx1‐cre;Rosa26mT/mG mice. Adipocytes were counted from four non‐overlapping images per depot per mouse. Data are shown as mean ± SEM of 4–9 mice.
- A, B
Number of mGFP‐positive preadipocytes isolated by FACS from each of the indicated white adipose depots from 5‐ to 6‐month‐old Wt1‐creERT2, Tagln‐cre, and Mx1‐cre crossed to Rosa26mT/mG mice from the experiment shown in Fig 6B. Data are shown as mean ± SEM of 4–9 mice.
- C, D
Number of mGFP‐positive adipocytes from each of the indicated white adipose depots from 5‐ to 6‐month‐old Wt1‐creERT2, Tagln‐cre, and Mx1‐cre crossed to Rosa26mT/mG mice. Four separate non‐overlapping images/depot/mouse from the experiment shown in Fig 6C. Data are shown as mean ± SEM of 4–9 mice.
- E
Model of adipose tissue heterogeneous within a single fat depot. Each adipose tissue depot is comprised of a mix of Types 1–3 and uncharacterized preadipocytes and adipocytes.
References
-
- Bluher M, Patti ME, Gesta S, Kahn BB, Kahn CR (2004) Intrinsic heterogeneity in adipose tissue of fat‐specific insulin receptor knock‐out mice is associated with differences in patterns of gene expression. J Biol Chem 279: 31891–31901 - PubMed
-
- Bodenhofer U, Kothmeier A, Hochreiter S (2011) APCluster: an R package for affinity propagation clustering. Bioinformatics 27: 2463–2464 - PubMed
-
- Chau YY, Bandiera R, Serrels A, Martinez‐Estrada OM, Qing W, Lee M, Slight J, Thornburn A, Berry R, McHaffie S, Stimson RH, Walker BR, Chapuli RM, Schedl A, Hastie N (2014) Visceral and subcutaneous fat have different origins and evidence supports a mesothelial source. Nat Cell Biol 16: 367–375 - PMC - PubMed
Publication types
MeSH terms
Substances
Grants and funding
LinkOut - more resources
Full Text Sources
Molecular Biology Databases
Research Materials
