. 2019 Jan 15;202(2):514-526.
doi: 10.4049/jimmunol.1800422. Epub 2018 Dec 7.

Development of Inflammatory Hypoxia and Prevalence of Glycolytic Metabolism in Progressing Herpes Stromal Keratitis Lesions

Affiliations

Development of Inflammatory Hypoxia and Prevalence of Glycolytic Metabolism in Progressing Herpes Stromal Keratitis Lesions

Pushpa Rao et al. J Immunol. .

Abstract

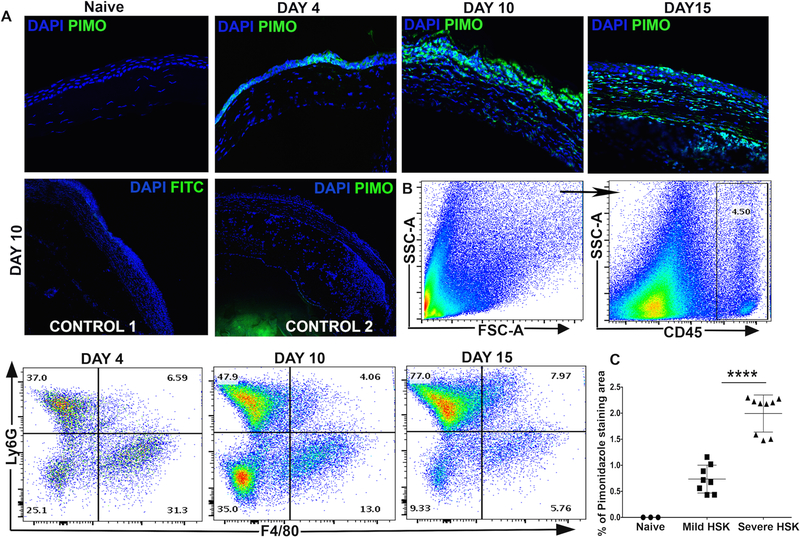
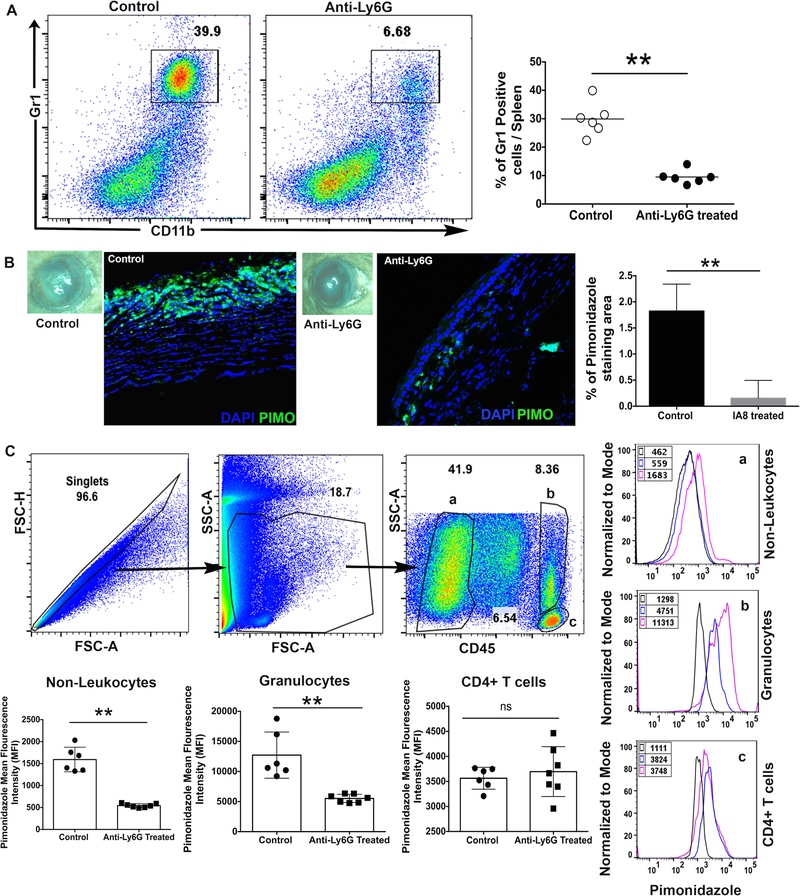
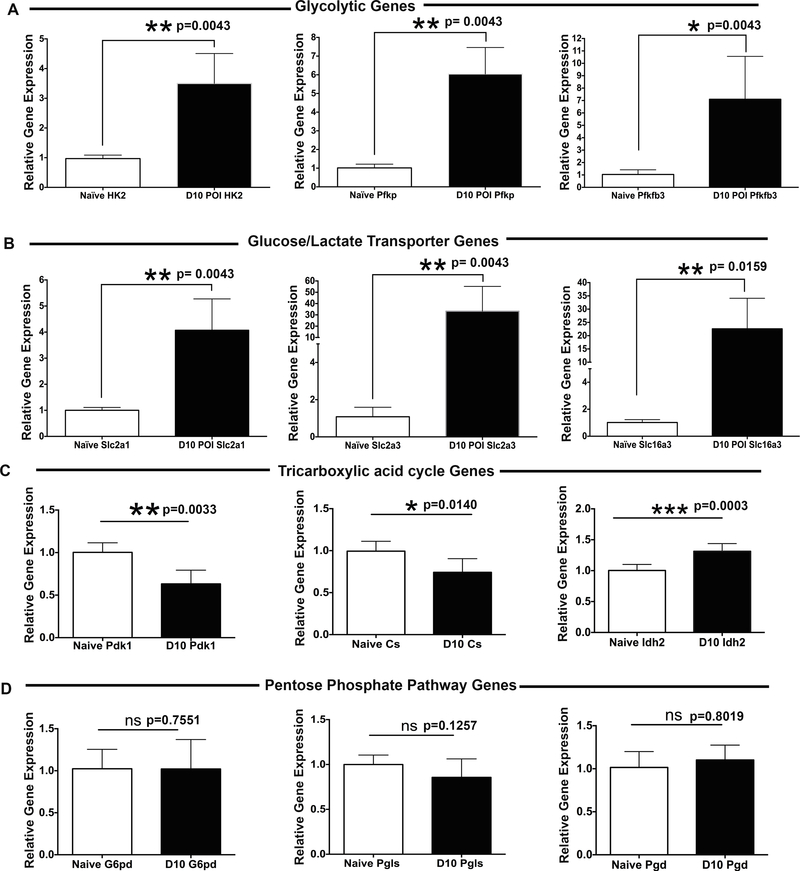
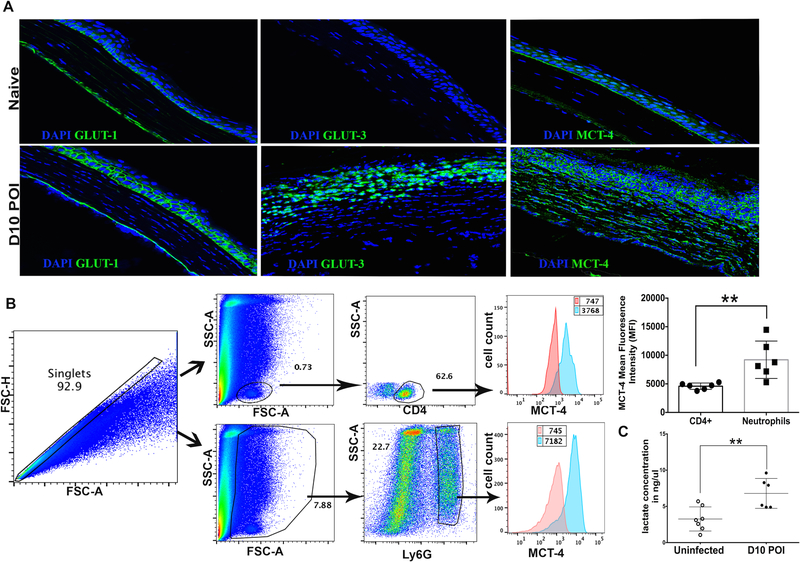
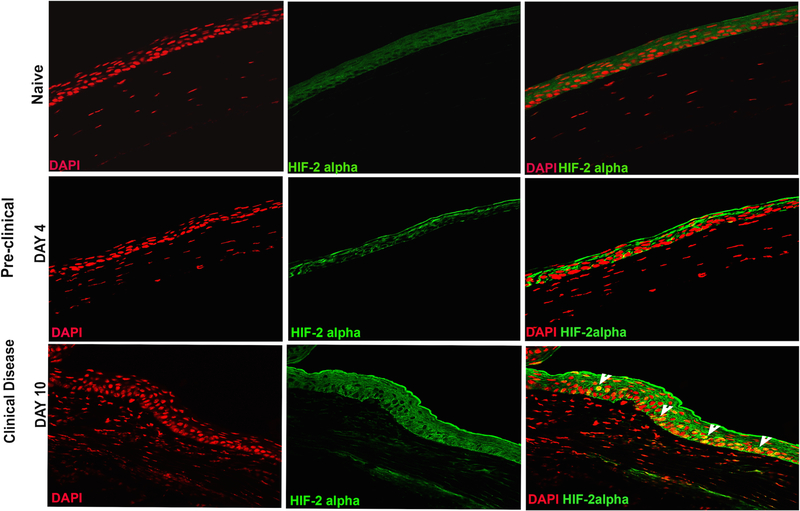
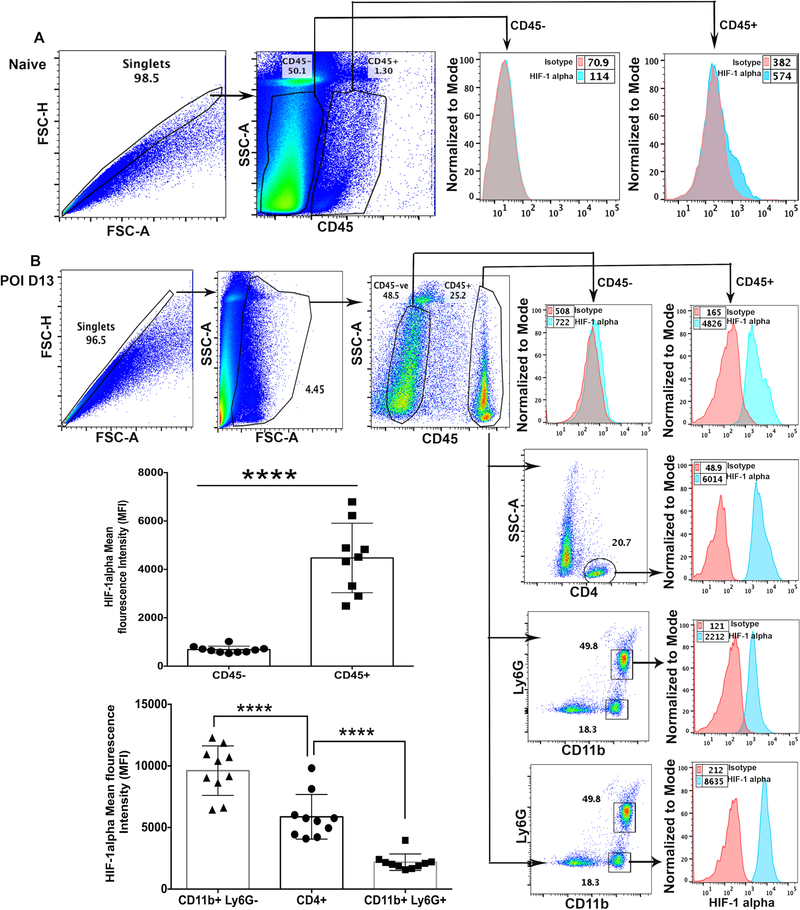
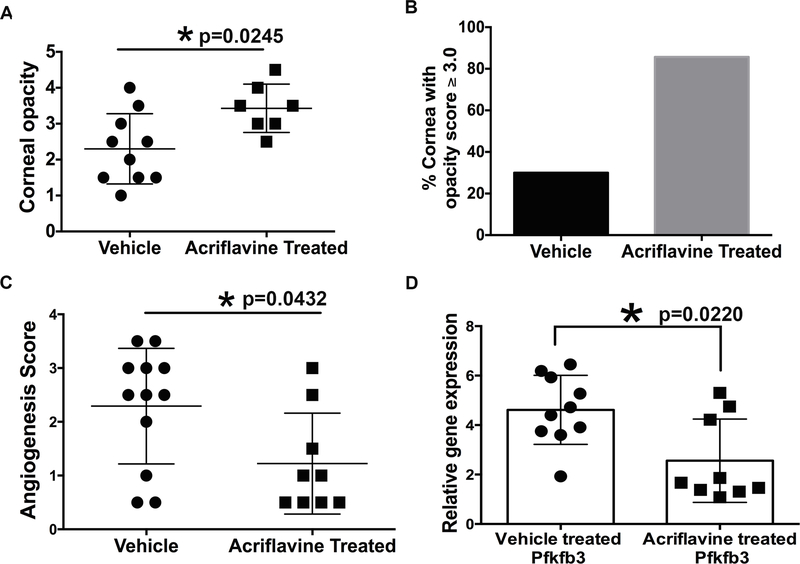
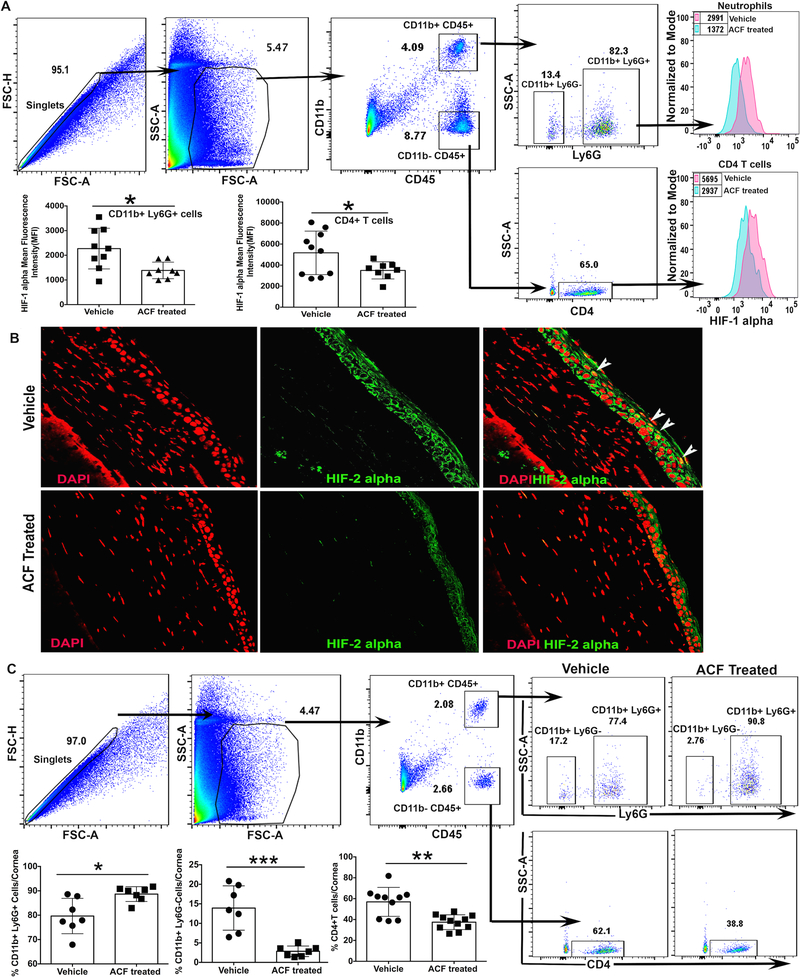
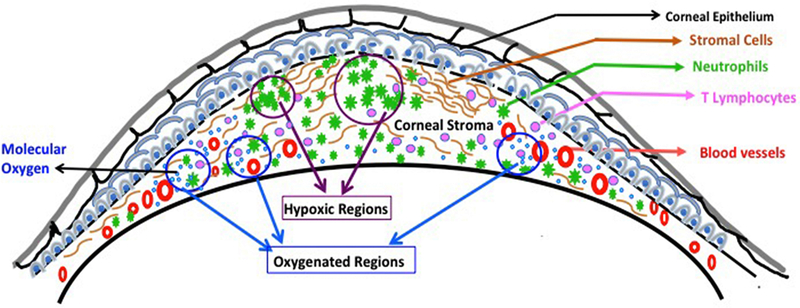
Chronic inflammation in tissues often causes the development of hypoxia. Herpes stromal keratitis (HSK) is a corneal chronic inflammatory condition that develops in response to recurrent HSV-1 infection. In this study, we investigated the development of hypoxia, the expression of hypoxia-associated glycolytic genes in HSV-1 infected corneas, and the outcome of blocking hypoxia-inducible factor (HIF) dimerization on the severity of HSK. Our results showed the development of hypoxia, an elevated expression of hypoxia-associated glycolytic genes, and an increased level of lactate in corneas with progressing HSK lesions. The magnitude of hypoxia correlated with the extent of neutrophils infiltrating the infected corneas, and the depletion of neutrophils reduced the development of hypoxia in infected corneas. Additionally, in progressing HSK lesions, nuclear localization of HIF-2α protein was detected in corneal epithelial cells, whereas HIF-1α protein stabilization was observed in infiltrating immune cells. Administration of acriflavine drug to HSV-1-infected mice inhibited nuclear accumulation of HIF-1α and HIF-2α protein in immune cell types and epithelial cells, respectively, in infected corneas. As a result, a decreased influx of CD4 T cells and nongranulocytic myeloid cells, but an increased influx of neutrophils, was noted in developing HSK lesions. Interestingly, acriflavine treatment given during the clinical disease period decreased neovascularization but increased the opacity in HSV-1-infected corneas. Taken together, the results of our study lay the foundation to dissect the role of inflammatory hypoxia and hypoxia-associated genes in the pathogenesis of HSK.


Figures

Figure 1.
Figure 1.
Development of inflammatory hypoxia relates with the influx of neutrophils in HSV-1 infected corneas. (A) Representative frozen corneal sections show pimonidazole (PIMO) staining in uninfected (naive) cornea and HSV-1 infected cornea at 4-, 10-, and 15-day post ocular infection (POI). Prominent pimonidazole adduct staining (in green) is detected in infected corneas during the clinical disease period (10-day and 15-day POI). DAPI nuclear staining is shown in blue. The images shown were acquired with the 40x objective. Control 1 shows FITC-conjugated mouse IgG isotype staining in the frozen corneal section of an eye enucleated at 10-day POI. Control 2 shows staining with anti-pimonidazole antibody in the corneal section of an eye enucleated from infected mouse, which was not injected with pimonidazole drug. Control 1 and control 2 images were acquired with the 10x objective. Pimonidazole staining shown are representative of two independent experiments (n=5–6 corneas or mice per group). (B) Representative FACS plots show a progressive increase in the frequency of neutrophils (Ly6G+ cells), but a decrease in the frequency of macrophages (F4/80+ cells) in infected corneas during the clinical disease period. FACS plots are derived from total CD45+ cells in the infected cornea. Data shown is representative of two similar experiments. N= 4 mice at each time-point. (C) Scatter plot shows the magnitude of hypoxic regions in naive and the infected corneas with severe or mild HSK at 10-day POI, (n=3 naive corneas, n=8 corneas with mild HSK, and n=9 corneas for severe HSK). Data shown is representative of two similar experiments and was analyzed using nonparametric Mann-Whitney test (*p=0.0159).
Figure 2.
Figure 2.
Neutrophil depletion significantly reduced the development of hypoxia in HSV-1 infected cornea. (A) Representative FACS plots denote the frequency of Gr1+CD11b+ cell population in the splenocytes obtained from isotype control and anti-Ly6G antibody treated groups of infected mice on day 12 post-infection. FACS plots were derived from singlets and live gated cells. Scatter plot denotes the frequency of CD11b+GR1+ cells in individual spleen samples from both groups of infected mice. Each circle represents an individual spleen sample. Data shown is derived from two experiments and n=6 mice in each group. (B) Representative eye-image from control and anti-Ly6G treated group of mice demonstrate the severity of HSK and pimonidazole staining in respective corneal section at day 12 post-infection. Bar graph denotes the percentage of pimonidazole stained area in infected corneas from both groups of mice. Quantification was carried out using NIH imageJ software. Pimonidazole staining shown are representative of two independent experiments (n=5 corneas or mice per group). DAPI nuclear staining is in blue and pimonidazole adduct staining is shown in green. Magnification x400. (C) Representative FACS plots denote the gating strategy of singlets and live gated cells in infected corneal samples from both groups of mice at 12-day post-infection. Three different cell population in FACS plot is gated as non-leukocytes (a), granulocytes (b), and CD4 T cells (c). Representative histogram FACS plots demonstrate mean fluorescence intensity (MFI) of pimonidazole adduct staining in control (___line) and anti-Ly6G treated (___line) groups. Isotype control is shown as black line in histogram FACS plot. Scatter plots denote pimonidazole MFI in three different cell population from both groups. Data derived is shown from two similar experiments with n= 6–7 corneas or mice/per group. p values were calculated using unpaired non-parametric t-test. **p<0.01
Figure 3.
Figure 3.
Enhanced expression of glycolytic genes in the corneas with HSK. RT-qPCR was carried out on individual uninfected (naive) and HSV-1 infected cornea samples. Bar graphs document the fold change in the level of expression of (A) glycolytic genes (HK2, PFKP, and PFKFB3); (B) glucose/lactate transporters (Slc2a1, Slc2a3, and Slc16a3); (C) tricarboxylic acid cycle genes (PdK1, CS, and Idh2); and (D) pentose phosphate pathway genes (G6Pd, Pgls, Pgd) in infected individual corneas at 10-day post ocular infection (POI) in comparison to naive corneas. Data shown is representative of two similar experiments (n=5 corneal or mice samples per group). Statistical significance was calculated using parametric two-tailed student’s t-test.
Figure 4.
Figure 4.
Prevalence of glycolytic metabolism in the corneas with progressing HSK lesions. (A) Representative images of frozen corneal section document weak GLUT-1 and MCT-4, but no GLUT-3 staining in the corneal epithelium of naive corneas (top row). Intense membrane bound GLUT-1 staining is evident in the corneal epithelium of infected eyes, whereas GLUT-3 and MCT4 staining was seen in the epithelial and stromal region of infected corneas at 10-day POI (bottom row). GLUT-1, GLUT-3 and MCT-4 staining is shown in green and DAPI nuclear staining is shown in blue color. Image magnification is at 400X. Immunofluorescence images shown are representative of two independent experiments (n= 4–6 corneas or mice per group). (B) Representative histogram FACS plots are denoting the level of MCT4 protein in CD4 T cells and Ly6G+ neutrophils in HSK corneas at 10-day POI. Bar graph shows the MFI of MCT4 protein in CD4 T cells and neutrophils in individual corneas at 10-day POI. Results shown are representative of two independent experiments. (n= 6 corneas/mice in each group). ** p=0.0065 was calculated with two-tailed student’s t-test. (C) Scatter plot shows the amount of L (+)-Lactate in individual uninfected corneas and HSV-1 infected corneas at 10-day POI, as measured with a lactate colorimetric assay kit. Results shown are representative of three independent experiments. N= 6–7 corneas or mice in each group). ** p= 0.0058 was calculated by unpaired parametric t test.
Figure 5.
Figure 5.
Nuclear localization of hypoxia inducible factor-2α (HIF-2α) in epithelial cells of infected corneas during clinical disease period. Representative immunofluorescence images of frozen corneal sections show HIF-2α staining in naive cornea (top panel) and HSK developing cornea during pre-clinical (middle panel, 4-day POI) and clinical phase (bottom panel, 10-day POI) of disease. The top and bottom panel from left to right, show nuclear staining with DAPI (in red), HIF-2α staining (in green), and the merged images with nuclear localization of HIF-2α (in yellow). Arrowheads in the bottom row indicate the epithelial cells with nuclear localization of HIF-2α in yellow. Image magnification is at 400X. Immunofluorescence images shown are representative of five corneas at each time-point. Data is derived from two independent experiments.
Figure 6.
Figure 6.
Hypoxia inducible factor-1α (HIF-1α) protein accumulation in immune cell subsets in HSK developing corneas. (A) Representative pseudocolor FACS plot of five pooled naive corneas denote the gating strategy employed for CD45- non-leukocytes and CD45+ leukocytes. Representative histogram FACS plot (right) shows isotype control and the level of intracellular HIF-1α protein in CD45- and CD45+ cell populations, respectively. Data shown is derived from two independent experiments. (B) Representative FACS plots showing HSV-1 infected corneas at 13-day POI demonstrate gating strategy employed for CD45- non-leukocytes, CD45+ leukocytes, CD4 T cells, CD11b+Ly6G+ neutrophils, and CD11b+Ly6G- non-granulocytic myeloid cells. Representative histogram FACS plots (from top to bottom) show isotype control and an intracellular level of HIF-1α protein in non-leukocytes, leukocytes, CD4 T cells, neutrophils, and myeloid cells in infected cornea. Scatter plot/bar graph demonstrates the MFI of HIF-1α protein in non-leukocytes vs leukocytes and in three different leukocyte cell subsets in individual infected corneas at 13-day POI. Data shown is derived from two similar experiments with n= 5 mice /group in each experiment. Statistical significance was calculated using unpaired non-parametric t-test and one-way ANOVA test. **** p<0.0001.
Figure 7.
Figure 7.
Acriflavine treatment exacerbates the opacity, but significantly reduces hemangiogenesis in the corneas with HSK. (A) Scatter plot is showing the opacity score of individual corneas from the vehicle treated, and acriflavine treated groups of HSV-1 infected mice at 10-day POI. Eyes with a score of zero are excluded from both the groups of infected mice. (B) Bar diagram is showing the incidence of eyes with HSK score ≥3.0 between both groups of infected mice. C. Scatter plot shows hemangiogenesis score of individual corneas from both groups of infected mice at 10-day POI. D. Scatter plot/bar graph shows the expression of PFKFB3 gene in individual corneas from vehicle, and acriflavine treated groups of infected mice at 10-day POI. Data shown is derived from two similar experiments. N= 5–6 infected mice/group in each experiment. Statistical significance was calculated using nonparametric Mann-Whitney test.
Figure 8.
Figure 8.
Acriflavine treatment to HSV-1 infected mice reduce HIF accumulation in non-immune and immune cell subsets in HSK developing cornea. (A) Representative FACS plots demonstrate gating strategy employed on single cell corneal samples obtained from HSV-1 infected mice at 12-day post-infection. HIF-1α protein levels in neutrophils (Ly6g+) and CD4 T cells in HSK developing corneas from vehicle and acriflavine treated group of mice are shown as histogram plots. Scatter plots denote the level of HIF-1α protein in neutrophils and CD4 T cells in individual corneas from both groups of mice at 12-day post-infection. Data shown is pooled from two similar experiments. N= 5 mice/group in each experiment. (B) Representative immunofluorescence images of frozen corneal sections from both groups of mice show nuclear accumulation of HIF-2α protein in corneal epithelial cells at 12-day post-infection. Top and bottom panel from left to right show nuclear staining with DAPI (in red), HIF-2α staining (in green), and the merged images with nuclear localization of HIF-2α (in yellow). Arrowheads indicate epithelial cells with nuclear localization of HIF-2α in yellow. Magnification x400. Images shown are representative of five infected corneas/mice from each group and are derived from two independent experiments. (C) Representative FACS plots denote gating strategy employed for singlets, leukocytes, neutrophils (CD11b+Ly6g+), non-granulocytic myeloid cells (CD11b+Ly6g-), and infiltrating CD4 T cells in HSK developing corneas from both groups of mice at 12-day post-infection. Scatter plot demonstrate frequency of three different leukocyte subsets in individual corneas from both groups of mice. Data shown is derived from two similar experiments and n= 5 mice/group in each experiment. p values were calculated using unpaired t-test. *p<0.05, **p<0.01, ***p<0.001.
Figure 9.
Figure 9.
A proposed model to depict the development of inflammatory hypoxia in HSV-1 infected cornea with HSK lesion. The model shows the presence of both oxygenated and hypoxic regions in HSK lesions. Neovascularization of HSV-1 infected cornea will supply molecular oxygen, whereas the massive influx of neutrophils in HSK lesions could reduce the molecular oxygen into reactive oxygen species (ROS) and shape the development of inflammatory hypoxia.

References

    1. Rowe AM, St Leger AJ, Jeon S, Dhaliwal DK, Knickelbein JE, and Hendricks RL 2013. Herpes keratitis. Prog Retin Eye Res 32: 88–101. - PMC - PubMed
    1. Biswas PS, and Rouse BT 2005. Early events in HSV keratitis--setting the stage for a blinding disease. Microbes Infect 7: 799–810. - PubMed
    1. Royer DJ, and Carr DJ 2016. A STING-dependent innate-sensing pathway mediates resistance to corneal HSV-1 infection via upregulation of the antiviral effector tetherin. Mucosal Immunol 9: 1065–1075. - PMC - PubMed
    1. Leib DA, Harrison TE, Laslo KM, Machalek MA, Moorman NJ, and Virgin HW 1999. Interferons regulate the phenotype of wild-type and mutant herpes simplex viruses in vivo. J Exp Med 189: 663–672. - PMC - PubMed
    1. Conrady CD, Zheng M, Mandal NA, van Rooijen N, and Carr DJ 2013. IFN-alpha-driven CCL2 production recruits inflammatory monocytes to infection site in mice. Mucosal Immunol 6: 45–55. - PMC - PubMed

Publication types

MeSH terms

Substances