. 2019 Feb 1;79(3):452-460.
doi: 10.1158/0008-5472.CAN-18-2077. Epub 2018 Dec 10.

Radiosensitivity Is an Acquired Vulnerability of PARPi-Resistant BRCA1-Deficient Tumors

Affiliations

Radiosensitivity Is an Acquired Vulnerability of PARPi-Resistant BRCA1-Deficient Tumors

Marco Barazas et al. Cancer Res. .

Abstract

The defect in homologous recombination (HR) found in BRCA1-associated cancers can be therapeutically exploited by treatment with DNA-damaging agents and PARP inhibitors. We and others previously reported that BRCA1-deficient tumors are initially hypersensitive to the inhibition of topoisomerase I/II and PARP, but acquire drug resistance through restoration of HR activity by the loss of end-resection antagonists of the 53BP1/RIF1/REV7/Shieldin/CST pathway. Here, we identify radiotherapy as an acquired vulnerability of 53BP1;BRCA1-deficient cells in vitro and in vivo. In contrast to the radioresistance caused by HR restoration through BRCA1 reconstitution, HR restoration by 53BP1 pathway inactivation further increases radiosensitivity. This highlights the relevance of this pathway for the repair of radiotherapy-induced damage. Moreover, our data show that BRCA1-mutated tumors that acquire drug resistance due to BRCA1-independent HR restoration can be targeted by radiotherapy. SIGNIFICANCE: These findings uncover radiosensitivity as a novel, therapeutically viable vulnerability of BRCA1-deficient mouse mammary cells that have acquired drug resistance due to the loss of the 53BP1 pathway.


Conflict of interest statement

Disclosure of Potential Conflicts of Interest

No potential conflicts of interest were disclosed

Figures

Figure 1
Figure 1. Radioresistance in KB1P tumors is not accompanied by HR restoration. See also Supplementary Figure 1 and Supplementary Figure 2.
A. Schematic overview of the serial transplantation model to test the radiotherapy sensitivity. Tumors derived from the spontaneous KP or KB1P tumor model were allografted in syngeneic FVB mice and treated with fractionated radiotherapy when tumors reached 500 mm3. Radiotherapy was delivered locally using a high precision irradiator dedicated for mice and equipped with a cone-beam CT scanner. This allowed accurate localization and treatment of the tumor. Example images are shown with the tumor highlighted by a white dashed line. B. Radiotherapy response of KB1P compared to KP tumors. Radiotherapy was delivered to established tumors as 36Gy/9fr in 3 weeks. Tumor volumes were compared at the end of treatment. Data are plotted as mean ± SD. Significance was calculated by unpaired two-tailed students t-test. C. Example of a KB1P6 tumor in which radiotherapy resistance was induced by continuous treatment until 40-60% response was measured (13fr/2Gy). Treatment was reinitiated when the tumor had regrown to its starting volume and this was repeated until the tumor stopped responding (KB1P-RR). KB1P-RR and its matched KB1P-N tumors were allografted in syngeneic FVB mice and treated with fractionated radiotherapy when tumors reached 500 mm3 (36Gy/9fr in 3 weeks). The volume post treatment was compared to the volume at treatment start and are plotted as mean ± SD. Significance was calculated by unpaired two-tailed students t-test. D. Example immunofluorescence images of RAD51 IRIF formation on KP-N, KB1P-N and KB1P-RR tumors before or after 15Gy of IR.
Figure 2
Figure 2. 53BP1 pathway inactivation in KB1P-G3 tumor cells enhances radiosensitivity. See also Supplementary Figure 3 and Supplementary Figure 4.
A. The radiotherapy response of CRISPR/spCas9 targeted KB1P-G3 tumor cell lines were determined by clonogenic survival assay. Cells were plated as single cells, irradiated with the indicated dose immediately after plating and fixed and stained 10 days later. The number of colonies was counted manually using an inverted microscope. Quantifications were performed blinded. Data represent at least two independent experiments and were plotted as mean ± SD and fitted to the LQ-model using GraphPad Prism software. Statistics were calculated using CFAssay in R. B. Schematic overview of the FUCCI experiment in which the radiotherapy response was analyzed per stage of the cell cycle. Cells were FACS sorted, plated and irradiated directly after plating. C. The radiotherapy response of sorted KB1P-G3 parental, sgTrp53bp1-targeted or BRCA1-reconstituted tumor cells in which the FUCCI system was introduced. Plates were fixed and quantified 10 days later as in Fig. 2A. Data represent three independent experiments and were plotted as in Fig. 2A. Statistics were calculated as in Fig. 2A.
Figure 3
Figure 3. PARPi-resistant KB1P-G3 tumor cells can be depleted by radiotherapy.
A. Schematic overview of the competition assay using polyclonal CRISPR/SpCas9-targeted starting populations. The allele distribution was quantified by TIDE before and after treatment with olaparib (75 nM), AZD2461 (250 nM) or IR (3fr/4Gy/wk). Cells were passaged and re-plated in equal cell amounts every 10 days for a total of 30 days. Untreated populations were taken along to assess the evolution in a neutral setting. B. TIDE quantifications of the indicated targeted populations at treatment initiation and after the last indicated treatment (day 30).
Figure 4
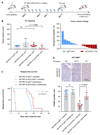
Figure 4. KB1PM7-N sgTrp53bp1 targeted tumors show an enhanced radiotherapy response.
A. Schematic overview depicting the RT treatment schedule. B. KB1PM7-N sgNT and KB1PM7-N sgTrp53bp1 targeted tumor pieces were orthotopically transplanted in mice and were treated with radiotherapy (40Gy/10fr in 2 weeks) when tumors reached 50-100mm3. The tumor volume at the end of treatment was compared to the volume at the start of treatment. Data are plotted as mean ± SD. Significance was calculated by unpaired two-tailed students t-test. In the right panel the data are presented in a Waterfall plot as relative change in tumor volume after treatment compared to treatment start. C. Kaplan-Meier curve showing that sgTrp53bp1 targeted KB1PM7-N tumors have a prolonged time to relapse upon radiotherapy treatment, defined as five times the tumor volume compared to treatment initiation. Significance was calculated by Log-Rank (Mantel-Cox) test in Graphpad Prism. D. IHC for 53BP1 on KB1PM7-N sgNT and sgTrp53bp1 targeted end-stage tumors that were left untreated or received radiotherapy. The percentage of 53BP1-positive cells was quantified by two independent animal pathologists and the average percentage is plotted per tumor. Significance was calculated by Mann-Whitney test. See also Supplementary Table S1.

References

    1. Knijnenburg TA, Wang L, Zimmermann MT, Chambwe N, Gao GF, Cherniack AD, et al. Genomic and Molecular Landscape of DNA Damage Repair Deficiency across The Cancer Genome Atlas. Cell reports. 2018;23:239–54.e6. - PMC - PubMed
    1. Kaelin WG., Jr The concept of synthetic lethality in the context of anticancer therapy. Nature reviews Cancer. 2005;5:689–98. - PubMed
    1. Lord CJ, Ashworth A. PARP inhibitors: Synthetic lethality in the clinic. Science. 2017;355:1152–8. - PMC - PubMed
    1. Bunting SF, Callen E, Wong N, Chen HT, Polato F, Gunn A, et al. 53BP1 inhibits homologous recombination in Brca1-deficient cells by blocking resection of DNA breaks. Cell. 2010;141:243–54. - PMC - PubMed
    1. Chapman JR, Barral P, Vannier JB, Borel V, Steger M, Tomas-Loba A, et al. RIF1 is essential for 53BP1-dependent nonhomologous end joining and suppression of DNA double-strand break resection. Molecular cell. 2013;49:858–71. - PMC - PubMed

Publication types

MeSH terms