

Comprehensive Transcriptional Profiling of the Gastrointestinal Tract of Ruminants from Birth to Adulthood Reveals Strong Developmental Stage Specific Gene Expression
- PMID: 30530642
- PMCID: PMC6385975
- DOI: 10.1534/g3.118.200810
Comprehensive Transcriptional Profiling of the Gastrointestinal Tract of Ruminants from Birth to Adulthood Reveals Strong Developmental Stage Specific Gene Expression
Abstract
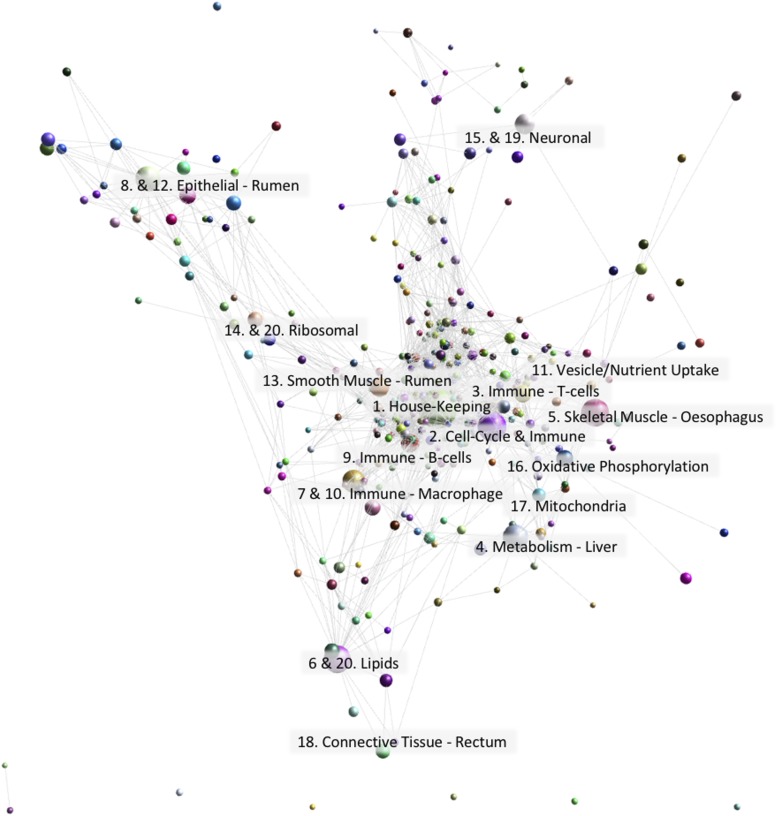
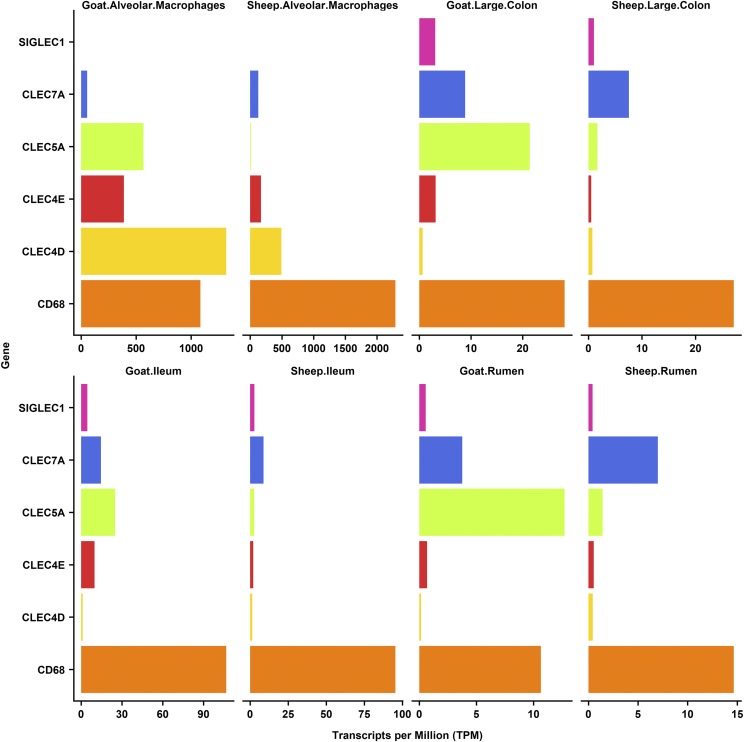
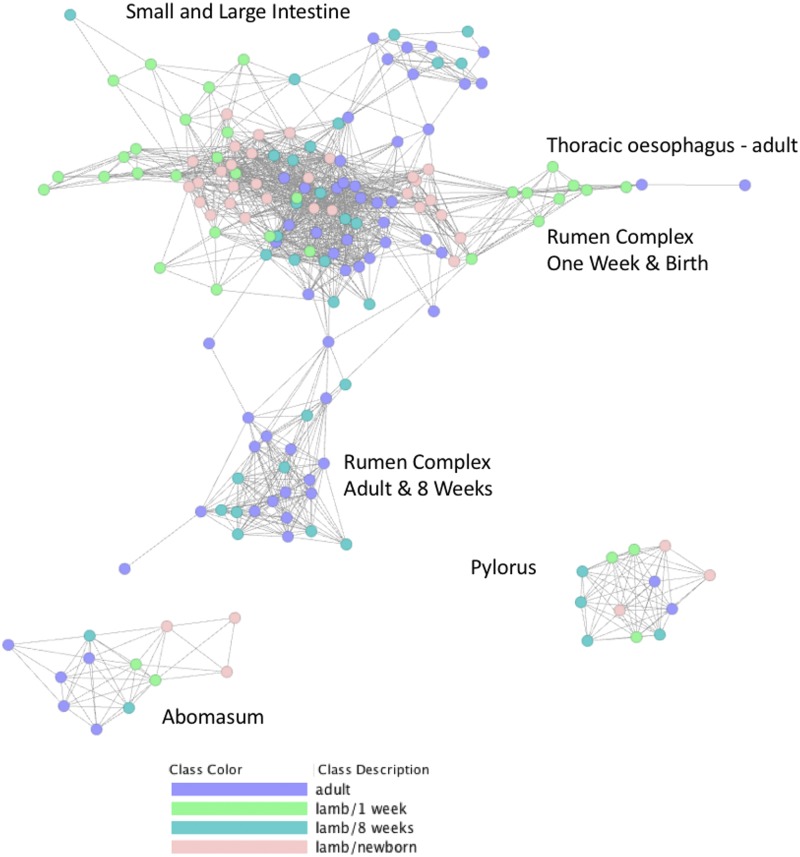
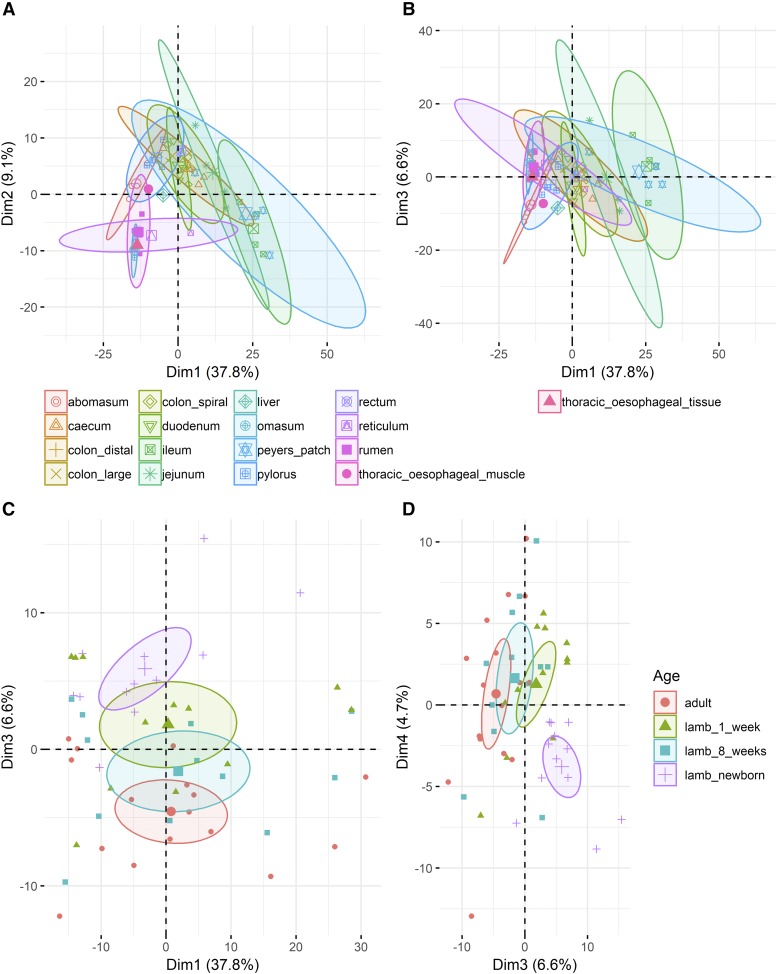
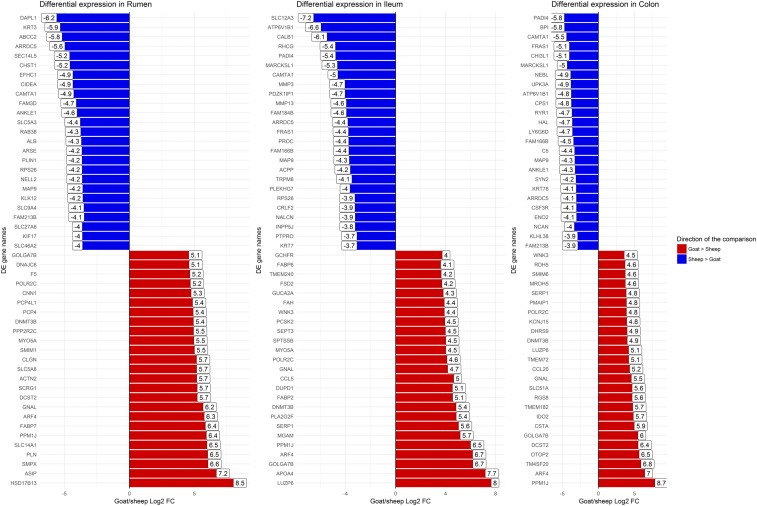
One of the most significant physiological challenges to neonatal and juvenile ruminants is the development and establishment of the rumen. Using a subset of RNA-Seq data from our high-resolution atlas of gene expression in sheep (Ovis aries) we have provided the first comprehensive characterization of transcription of the entire gastrointestinal (GI) tract during the transition from pre-ruminant to ruminant. The dataset comprises 164 tissue samples from sheep at four different time points (birth, one week, 8 weeks and adult). Using network cluster analysis we illustrate how the complexity of the GI tract is reflected in tissue- and developmental stage-specific differences in gene expression. The most significant transcriptional differences between neonatal and adult sheep were observed in the rumen complex. Comparative analysis of gene expression in three GI tract tissues from age-matched sheep and goats revealed species-specific differences in genes involved in immunity and metabolism. This study improves our understanding of the transcriptomic mechanisms involved in the transition from pre-ruminant to ruminant by identifying key genes involved in immunity, microbe recognition and metabolism. The results form a basis for future studies linking gene expression with microbial colonization of the developing GI tract and provide a foundation to improve ruminant efficiency and productivity through identifying potential targets for novel therapeutics and gene editing.
Keywords: RNA-Seq; development; gastrointestinal tract; gene expression; goat; immunity; macrophage; ruminant; sheep; transcription.
Copyright © 2019 Bush et al.
Figures

References
-
- Agilent Technologies (2016) Technical Overview: Comparison of RIN and RINe algorithms for the Agilent 2100 BioAnalyzer and the Agilent 2200 Tapestation Systems.
-
- Alexa, A., and J. Rahnenfuhrer, (2010) topGO: Enrichment analysis for Gene Ontology. URL http://www.bioconductor.org/packages/release/bioc/html/topGO.html.
MeSH terms
Associated data
Grants and funding
LinkOut - more resources
Full Text Sources