. 2018 Dec 26;115(52):E12245-E12254.
doi: 10.1073/pnas.1805829115. Epub 2018 Dec 7.

Profiling proliferative cells and their progeny in damaged murine hearts

Affiliations

Profiling proliferative cells and their progeny in damaged murine hearts

Kai Kretzschmar et al. Proc Natl Acad Sci U S A. .

Abstract

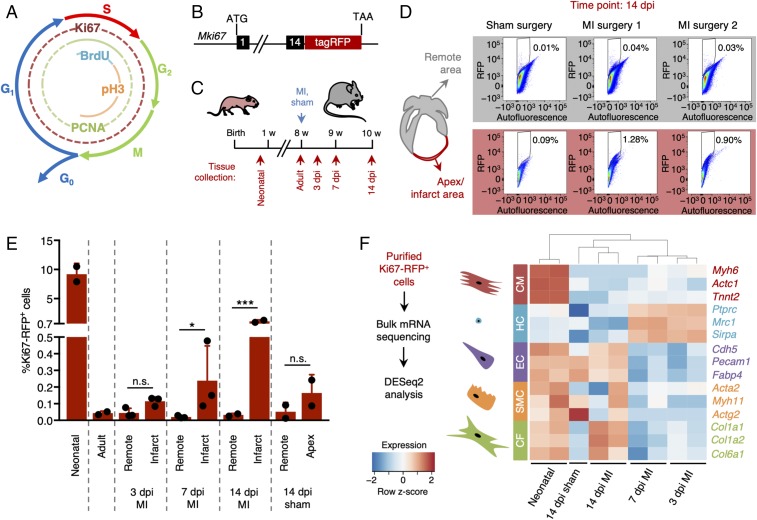
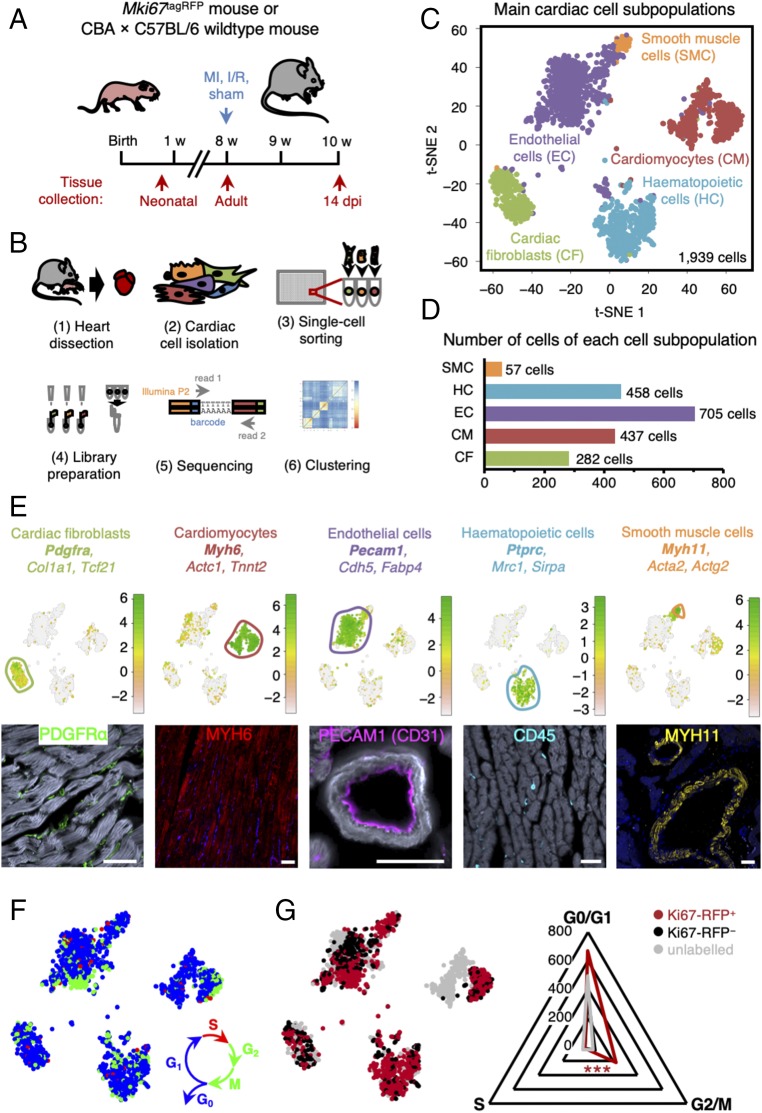
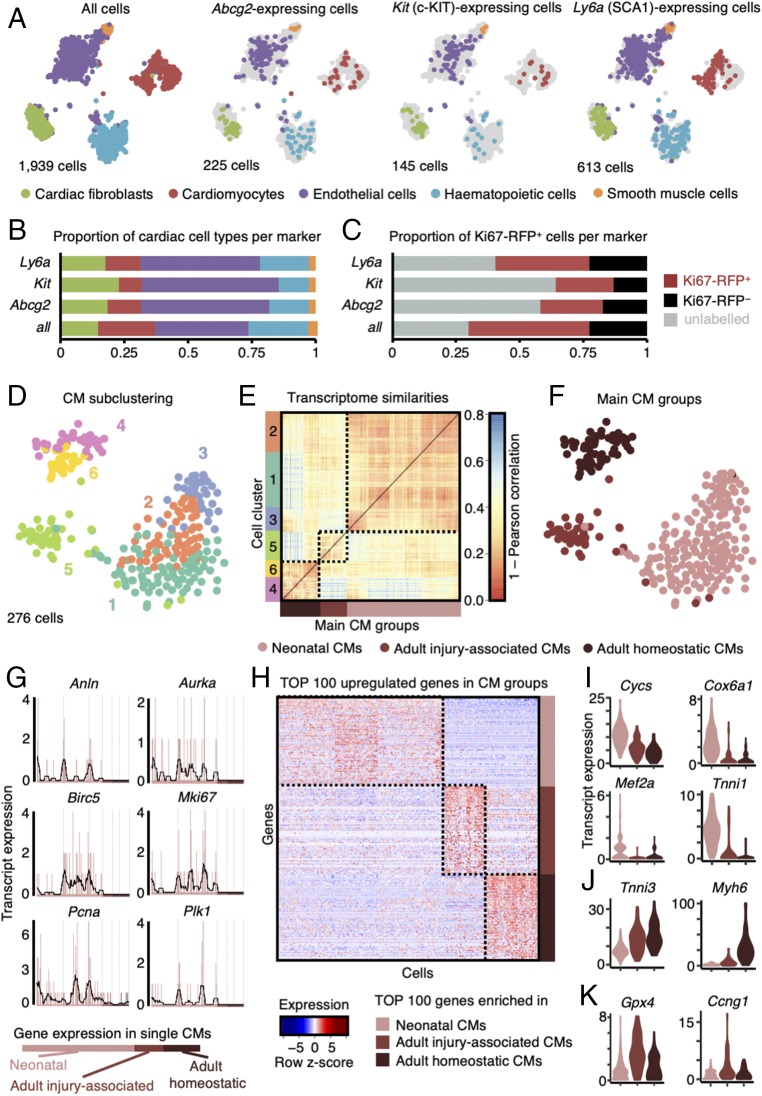
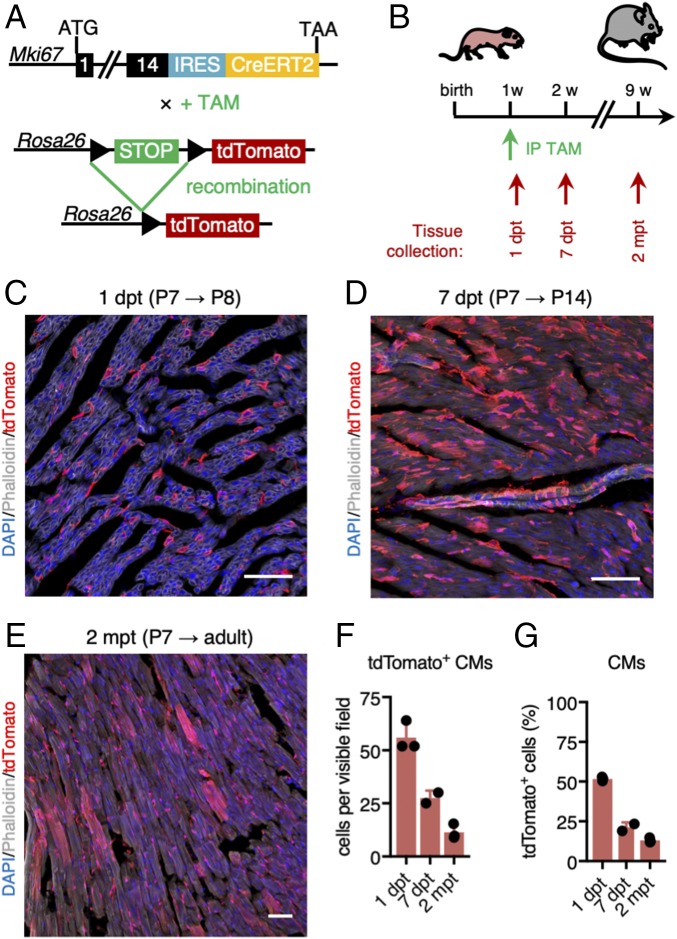
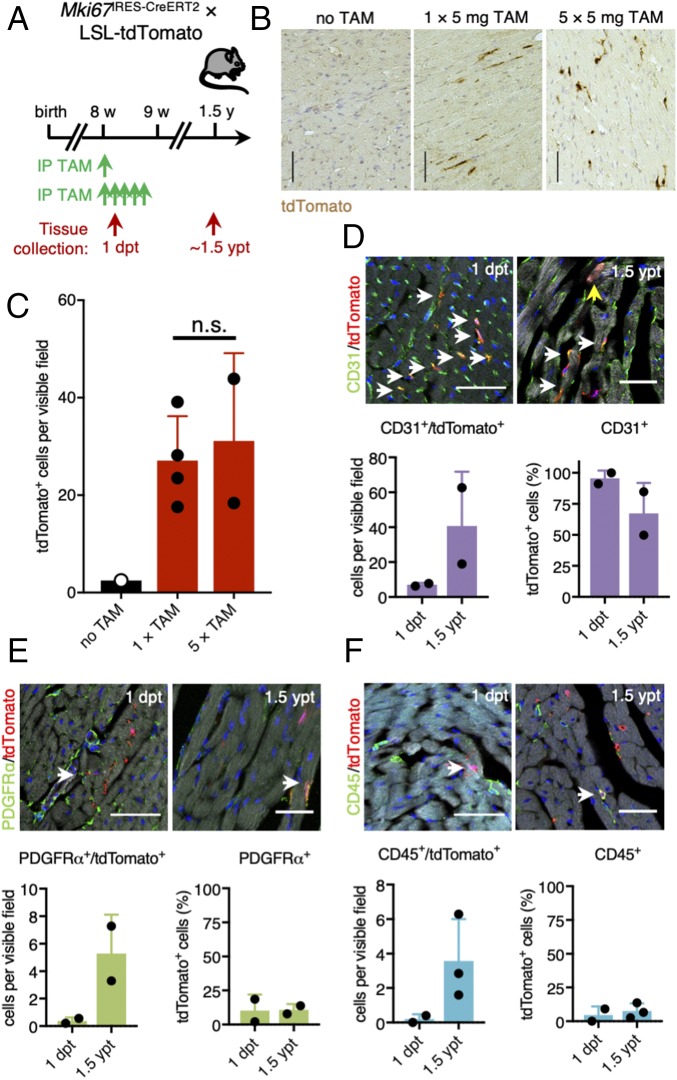
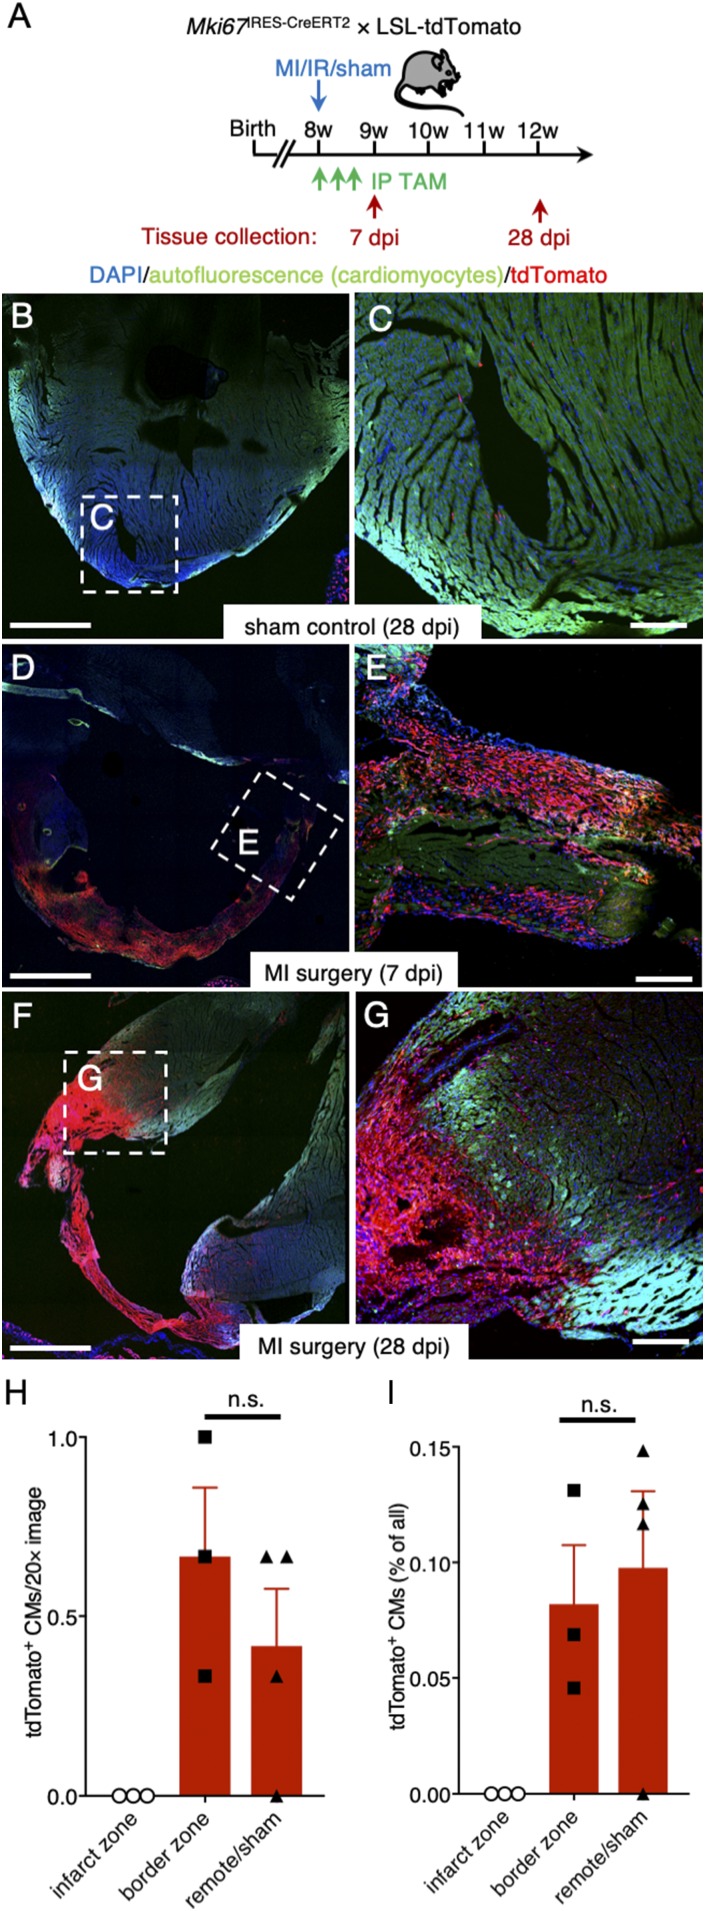
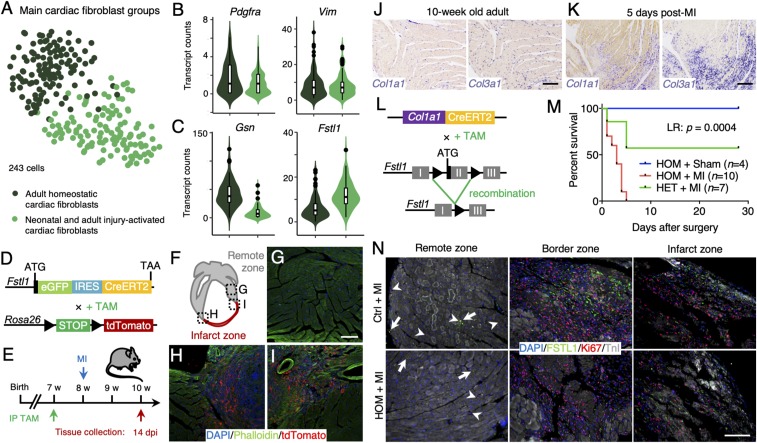
The significance of cardiac stem cell (CSC) populations for cardiac regeneration remains disputed. Here, we apply the most direct definition of stem cell function (the ability to replace lost tissue through cell division) to interrogate the existence of CSCs. By single-cell mRNA sequencing and genetic lineage tracing using two Ki67 knockin mouse models, we map all proliferating cells and their progeny in homoeostatic and regenerating murine hearts. Cycling cardiomyocytes were only robustly observed in the early postnatal growth phase, while cycling cells in homoeostatic and damaged adult myocardium represented various noncardiomyocyte cell types. Proliferative postdamage fibroblasts expressing follistatin-like protein 1 (FSTL1) closely resemble neonatal cardiac fibroblasts and form the fibrotic scar. Genetic deletion of Fstl1 in cardiac fibroblasts results in postdamage cardiac rupture. We find no evidence for the existence of a quiescent CSC population, for transdifferentiation of other cell types toward cardiomyocytes, or for proliferation of significant numbers of cardiomyocytes in response to cardiac injury.

Keywords: cardiac regeneration; fibroblasts; lineage tracing; single-cell transcriptomics; stem cells.


Conflict of interest statement

Conflict of interest statement: H.C. is co-principal investigator (co-PI) on a Dutch grant on organs-on-a-chip with C.L.M. as co-PI, however, on an unrelated topic.

Figures

Fig. 1.
Fig. 1.
Quantification and characterization of cardiac cell proliferation following injury. (A) Diagram showing the markers of the different phases of the cell cycle. (B) Schematic representation of the reporter mouse model expressing RFP-tagged Ki67 (Mki67TagRFP). (C) Experimental timeline of myocardial infarction (MI) surgery and tissue collection 3, 7, and 14 d post-MI injury (dpi). (D and E) Quantification of Ki67-RFP+ cells after MI or sham surgery in both remote (gray) and infarcted zone (red). The gating and sorting strategies are described in SI Appendix, Fig. S1. (D) Representative flow cytometry scatter plots 14 dpi. (E) Quantification of Ki67-RFP+ cells in neonatal, adult, infarct, remote and apex areas 3, 7, and 14 dpi (n = 2–3 mice per condition). All error bars represent ±SD. Asterisks indicate significance (Student’s t test: n.s., not significant, P ≥ 0.05; *P < 0.05; ***P < 0.001). (F) Bulk mRNA sequencing strategy and gene expression levels of different cardiac cell types identified in the purified Ki67-RFP+ populations. Cardiomyocytes were enriched in neonatal hearts. Hematopoietic cells were enriched 3 and 7 dpi, while resident lineages such as endothelial cells and fibroblasts were more abundant 14 dpi. CF, cardiac fibroblasts; CM, cardiomyocytes; EC, endothelial cells; HC, hematopoietic cells; SMC, smooth muscle cells.
Fig. 2.
Fig. 2.
Single-cell transcriptome analysis uncovers distinct proliferative populations within the murine heart. (A) Experimental timeline for tissue collection of hearts from wild-type and Mki67RFP mice, either neonatal or adults, 14 d after sham, ischemia/reperfusion (I/R), or MI surgery (n = 2–4 mice per condition). (B) Schematic representation of SORT-seq workflow. Hearts were isolated (1) and digested into single-cell suspension (2), and Ki67-RFP+ and Ki67-RFP cells were sorted into 384-well plates containing primers, dNTPs, and spike-ins (3). Retrotranscription mix was distributed using Nanodrop II, and material was pooled and amplified (4) before pair-end sequencing (5). Cells were clustered using RaceID2 (6). (C) Clustering of cardiac cells and cell-to-cell distances visualized by t-distributed stochastic neighbor-embedding (t-SNE) map, highlighting identified major cardiac cell types. (D) Numbers of cells assigned to each cardiac cell lineage. (E) t-SNE map highlighting identified cell types based on previously described cellular markers (logarithmic scale of transcript expression). Markers expression is shown in Lower panel by immunofluorescent staining. (Scale bars: 50 μm.) (F) t-SNE map displaying cell cycle stage of each cell [S (red), G2/M (green), G0/G1 (blue)] assigned by the cyclone algorithm. (G) t-SNE map showing the Ki67-RFP status from the flow cytometry data; Ki67-RFP+ (red), Ki67-RFP (black), or Mki67wt/wt cells without TagRFP construct (gray) and radar plot showing Ki67-RFP+ cells enriched for the cycling G2/M stage according to the cyclone algorithm. Asterisks indicate significance (χ2 test: ***P < 0.001).
Fig. 3.
Fig. 3.
Expression patterns of putative CSC markers and cardiomyocytes. (A) t-SNE map displaying stem cell marker (Abcg2, Kit, and Ly6a) expressing cells in major cell type clusters; CF, cardiac fibroblasts; CM, cardiomyocytes; EC, endothelial cells; HC, hematopoietic cells; SMC, smooth muscle cells. (B) Quantification of marker-based cell fraction per cell type reveals most stem cell markers cover endothelial cells but can be found in all resident populations. (C) Quantification of marker-based cell fraction in sorted populations (unlabeled, Ki67-RFP+, and Ki67-RFP). (D) t-SNE map of cardiomyocyte subclusters (n = 6) identified using the RaceID2 algorithm. (E) Heatmap representation of the transcriptome similarities between cardiomyocytes from the six identified subclusters combined into three main groups of cardiomyocytes. (F) t-SNE map highlighting the cells assigned to each of the three main groups of cardiomyocyte subclusters. (G) Expression profile of representative proliferation markers in neonatal and adult (homoeostatic or injury-associated) cardiomyocytes. Gene expression is shown on the y axis as transcript counts per cell on x axis with the running mean in black. (H) Heatmap representation of top 100 up-regulated genes in neonatal and adult (homoeostatic or injury-associated) cardiomyocytes. (IK) Violin plots showing the expression of representative genes up-regulated in neonatal cardiomyocytes (I), adult homoeostatic cardiomyocytes (J), and adult injury-associated cardiomyocytes (K).
Fig. 4.
Fig. 4.
Ki67 lineage tracing demonstrates de novo generation of cardiomyocytes in the neonatal murine heart. (A) Genetic cross between Mki67IRES-CreERT2 and LSL-tdTomato reporter mice to lineage trace Mki67-expressing cells. TAM, tamoxifen. (B) Neonatal hearts were collected 1 and 7 d post tamoxifen (dpt) as well as 8 wk post tamoxifen injection. Tamoxifen was injected at the age of 1 wk. IP, i.p. injection. (CE) tdTomato labeling 1 d (C), 7 d (D), and 2 mo (E) after tamoxifen injection at postnatal day 7 (P7). Nuclei were stained with DAPI (blue). Phalloidin (green or gray) was used to stain polymerized F-actin. (Scale bars: 500 μm.) (F and G) Number of tdTomato+ cardiomyocytes per visible field (F) and percentage of tdTomato+ cardiomyocytes of all tdTomato+ cells (G) at 1 dpt (P8; n = 3 mice), 7 dpt (P14; n = 2 mice), and 2 mo post tamoxifen (mpt) (n = 3 mice).
Fig. 5.
Fig. 5.
Continuous cellular turnover of noncardiomyocyte lineages during adult homoeostasis of the murine heart. (A) Timeline of tamoxifen injection and tissue collection in adult Mki67IRES-CreERT2 × LSL-tdTomato mice. (B and C) Representative images of stained paraffin sections (B) and corresponding quantification (C) of tdTomato labeling 1.5 y after tamoxifen exposure (1.5 ypt). Mice were either injected once with 5 mg of tamoxifen (n = 4 mice) or five times with 5 mg of tamoxifen (n = 2 mice). Noninjected mice were used as control (n = 1 mouse). (Scale bars: 100 μm.) (DF) Representative images and quantification of costainings of tdTomato-traced cells (red) at 1 dpt and 1.5 ypt and CD31+ (D), PDGFRα+ (E), or CD45+ cells (F) (green) (n = 2–3 mice). ypt, years post tamoxifen. White arrows point at double-positive cells. The yellow arrow shows one of the tdTomato-labeled cardiomyocytes we found across sections. Nuclei were counterstained with DAPI (blue). Phalloidin (gray) was used to stain polymerized F-actin. [Scale bars: 50 μm (Upper) and 30 μm (Lower).]
Fig. 6.
Fig. 6.
Ki67 lineage tracing reveals proliferative response following ischemic injury. (A) Experimental timeline. (B and C) Visualization of rare tdTomato+ cells in cryosections of sham control mice 28 dpi (n = 1 mouse). (DG) Large accumulation of tdTomato+ cells in the infarct zone 7 dpi (D and E; n = 2 mice) and 28 dpi (F and G; n = 3 mice). The myocardium was visualized using cardiomyocyte autofluorescence; CM (green); nuclei were counterstained with DAPI (blue). (H) Quantification of tdTomato+ cardiomyocytes (CMs) per section scored (n = 3–4 mice). Student’s t test: n.s., not significant. (I) Percentage of tdTomato+ cardiomyocytes (n = 3–4 mice). Student’s t test: n.s. [Scale bars: 1 mm (B, D, and F) and 200 μm (C, E, and G).]
Fig. 7.
Fig. 7.
FSTL1 expression is characteristic to a population of injury-activated fibroblasts and is crucial in preventing cardiac rupture upon damage. (A) t-SNE map of cardiac fibroblast subclusters identified using the RaceID2 algorithm projecting the different experimental conditions. (B and C) Violin plots showing the expression of Pdgfra, Vim (B), and Gsn and Fstl1 (C) in neonatal and injury-activated fibroblasts (light green) and homoeostatic adult fibroblasts (dark green). (D) Schematic representation of the generation of mice expressing eGFP and CreERT2 by cassette insertion within the Fstl1 protein coding region, enabling lineage tracing by crossing it with LSL-tdTomato mice. (E) Experimental timeline. (FI) Progeny (red) of Fstl1-expressing fibroblasts is enriched in the scar tissue 14 dpi (H and I), while tdTomato labeling in the remote area remains low (G). Nuclei were counterstained with DAPI (blue) and F-actin visualized by phalloidin (green). (J and K) In situ hybridization of Col1a1 and Col3a1 in adult homoeostatic heart (J) and 5 d after MI (K). (L) Schematic representation of the generation of conditional knockout (cKO) mice by crossing Col1a1-CreERT2 mice with Fstl1flox/flox mice, resulting in the depletion of Fstl1 exon 2 upon tamoxifen induction. (M) Kaplan–Meier survival curve of homozygous cKO mice after MI (red), homozygous cKO mice after sham surgery (blue), and heterozygous cKO mice after MI (green) over the course of 30 d. (N) Immunofluorescence stainings of FSTL1 (green), Ki67 (red), and TnI (white) in damaged control and homozygous cKO hearts in remote, border, and infarct zone. Nuclei were counterstained with DAPI (blue). (Scale bars: 100 μm.)

References

    1. Alkass K, et al. No evidence for cardiomyocyte number expansion in preadolescent mice. Cell. 2015;163:1026–1036. - PubMed
    1. Soonpaa MH, et al. Cardiomyocyte cell-cycle activity during preadolescence. Cell. 2015;163:781–782. - PubMed
    1. Naqvi N, et al. A proliferative burst during preadolescence establishes the final cardiomyocyte number. Cell. 2014;157:795–807. - PMC - PubMed
    1. Beltrami AP, et al. Adult cardiac stem cells are multipotent and support myocardial regeneration. Cell. 2003;114:763–776. - PubMed
    1. Senyo SE, et al. Mammalian heart renewal by pre-existing cardiomyocytes. Nature. 2013;493:433–436. - PMC - PubMed

Publication types

MeSH terms

Substances