

Virus-inclusive single-cell RNA sequencing reveals the molecular signature of progression to severe dengue
- PMID: 30530648
- PMCID: PMC6310786
- DOI: 10.1073/pnas.1813819115
Virus-inclusive single-cell RNA sequencing reveals the molecular signature of progression to severe dengue
Abstract
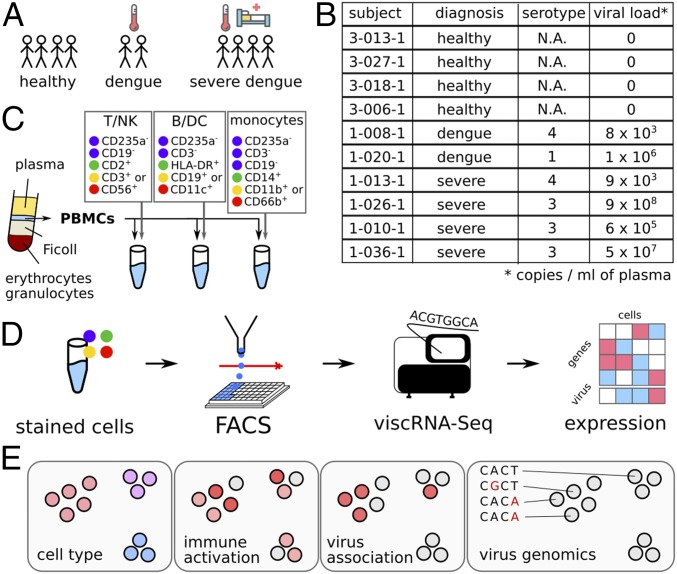
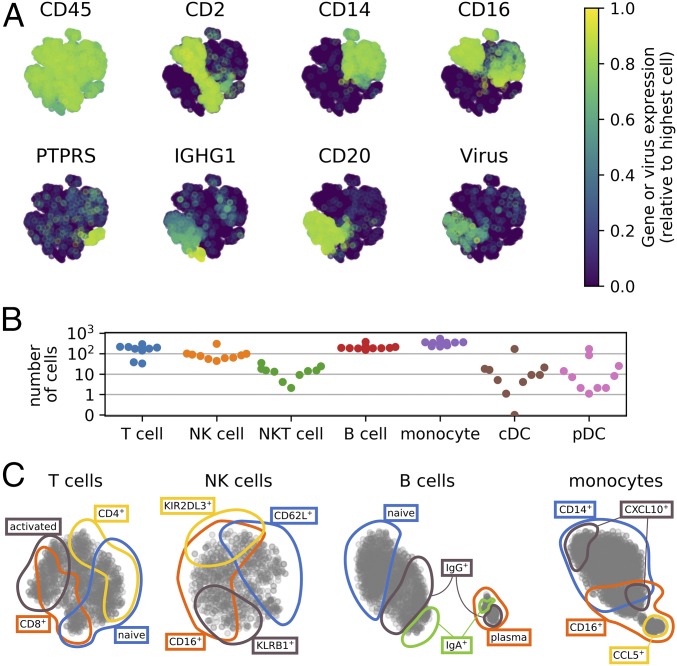
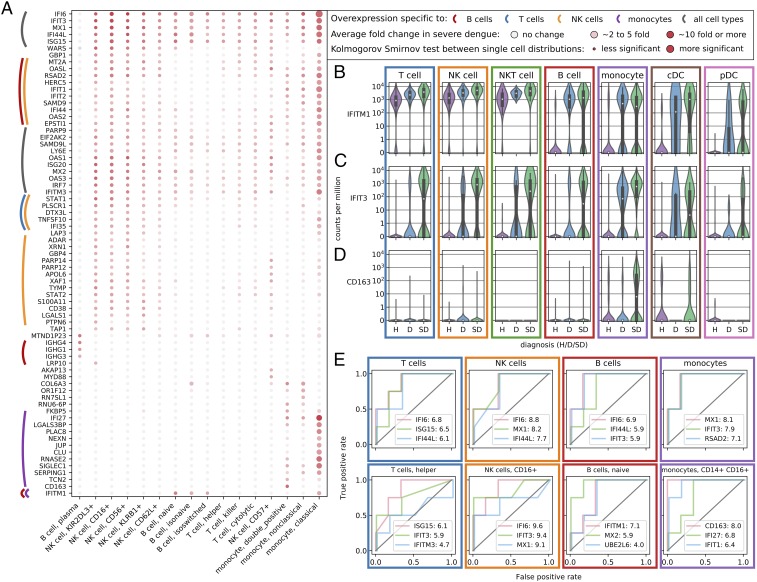
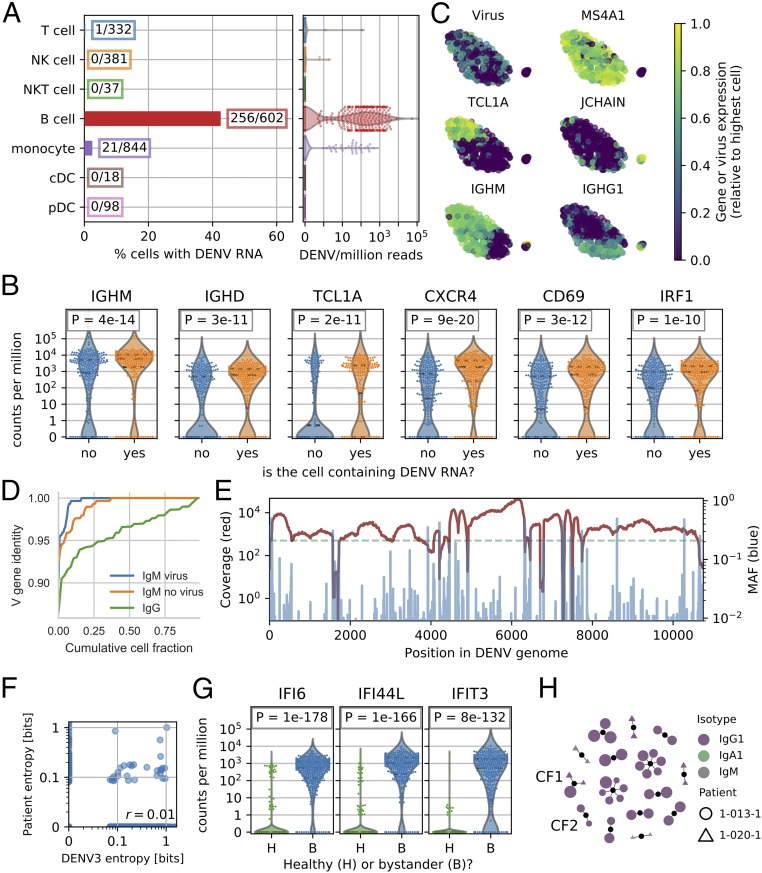
Dengue virus (DENV) infection can result in severe complications. However, the understanding of the molecular correlates of severity is limited, partly due to difficulties in defining the peripheral blood mononuclear cells (PBMCs) that contain DENV RNA in vivo. Accordingly, there are currently no biomarkers predictive of progression to severe dengue (SD). Bulk transcriptomics data are difficult to interpret because blood consists of multiple cell types that may react differently to infection. Here, we applied virus-inclusive single-cell RNA-seq approach (viscRNA-Seq) to profile transcriptomes of thousands of single PBMCs derived early in the course of disease from six dengue patients and four healthy controls and to characterize distinct leukocyte subtypes that harbor viral RNA (vRNA). Multiple IFN response genes, particularly MX2 in naive B cells and CD163 in CD14+ CD16+ monocytes, were up-regulated in a cell-specific manner before progression to SD. The majority of vRNA-containing cells in the blood of two patients who progressed to SD were naive IgM B cells expressing the CD69 and CXCR4 receptors and various antiviral genes, followed by monocytes. Bystander, non-vRNA-containing B cells also demonstrated immune activation, and IgG1 plasmablasts from two patients exhibited clonal expansions. Lastly, assembly of the DENV genome sequence revealed diversity at unexpected sites. This study presents a multifaceted molecular elucidation of natural dengue infection in humans with implications for any tissue and viral infection and proposes candidate biomarkers for prediction of SD.
Keywords: biomarkers; dengue; single cell; transcriptomics; virus–host interactions.
Copyright © 2018 the Author(s). Published by PNAS.
Conflict of interest statement
Conflict of interest statement: F.Z., M.L.R., D.C., L.G., S.R.Q., and S.E. have filed US Provisional Application No. 62/715,628 related to this manuscript. S.R.Q. and A.K.S. are coauthors on a 2017 review article.
Figures
Similar articles
-
The expression profile of human peripheral blood mononuclear cell miRNA is altered by antibody-dependent enhancement of infection with dengue virus serotype 3.Virol J. 2018 Mar 22;15(1):50. doi: 10.1186/s12985-018-0963-1. Virol J. 2018. PMID: 29566761 Free PMC article.
-
Analysis of cell-associated DENV RNA by oligo(dT) primed 5' capture scRNAseq.Sci Rep. 2020 Jun 3;10(1):9047. doi: 10.1038/s41598-020-65939-5. Sci Rep. 2020. PMID: 32493997 Free PMC article.
-
Integrative bulk and single-cell transcriptome profiling analysis reveals IFI27 as a novel interferon-stimulated gene in dengue.J Med Virol. 2023 Apr;95(4):e28706. doi: 10.1002/jmv.28706. J Med Virol. 2023. PMID: 36971141
-
The Transactions of NS3 and NS5 in Flaviviral RNA Replication.Adv Exp Med Biol. 2018;1062:147-163. doi: 10.1007/978-981-10-8727-1_11. Adv Exp Med Biol. 2018. PMID: 29845531 Review.
-
Mechanisms of monocyte cell death triggered by dengue virus infection.Apoptosis. 2018 Dec;23(11-12):576-586. doi: 10.1007/s10495-018-1488-1. Apoptosis. 2018. PMID: 30267240 Review.
Cited by
-
Single-cell RNA-sequencing data analysis reveals a highly correlated triphasic transcriptional response to SARS-CoV-2 infection.Commun Biol. 2022 Nov 27;5(1):1302. doi: 10.1038/s42003-022-04253-4. Commun Biol. 2022. PMID: 36435849 Free PMC article.
-
The east coast districts are the possible epicenter of severe dengue in Sabah.J Physiol Anthropol. 2020 Aug 14;39(1):19. doi: 10.1186/s40101-020-00230-0. J Physiol Anthropol. 2020. PMID: 32795350 Free PMC article.
-
Interferome signature dynamics during the anti-dengue immune response: a systems biology characterization.Front Immunol. 2023 Aug 10;14:1243516. doi: 10.3389/fimmu.2023.1243516. eCollection 2023. Front Immunol. 2023. PMID: 37638052 Free PMC article.
-
Mobilization and Activation of the Innate Immune Response to Dengue Virus.Front Cell Infect Microbiol. 2020 Nov 3;10:574417. doi: 10.3389/fcimb.2020.574417. eCollection 2020. Front Cell Infect Microbiol. 2020. PMID: 33224897 Free PMC article. Review.
-
Single-cell temporal analysis of natural dengue infection reveals skin-homing lymphocyte expansion one day before defervescence.iScience. 2022 Mar 5;25(4):104034. doi: 10.1016/j.isci.2022.104034. eCollection 2022 Apr 15. iScience. 2022. PMID: 35345453 Free PMC article.
References
-
- Guzman MG, Kouri G. Dengue and dengue hemorrhagic fever in the Americas: Lessons and challenges. J Clin Virol. 2003;27:1–13. - PubMed
-
- Khursheed M, et al. A comparison of WHO guidelines issued in 1997 and 2009 for dengue fever–Single centre experience. J Pak Med Assoc. 2013;63:670–674. - PubMed
-
- World Health Organization . Dengue Guidelines for Diagnosis, Treatment, Prevention and Control: New Edition. World Health Organization Press; Geneva: 2009. - PubMed
-
- World Health Organization 2018 Dengue and Severe Dengue. Available at www.who.int/news-room/fact-sheets/detail/dengue-and-severe-dengue. Accessed June 25, 2018.
Publication types
MeSH terms
Substances
Associated data
Grants and funding
LinkOut - more resources
Full Text Sources
Other Literature Sources
Medical
Molecular Biology Databases
Research Materials
