. 2018 Dec 11;115(50):12608-12615.
doi: 10.1073/pnas.1800485115.

Scientific prize network predicts who pushes the boundaries of science

Affiliations

Scientific prize network predicts who pushes the boundaries of science

Yifang Ma et al. Proc Natl Acad Sci U S A. .

Abstract

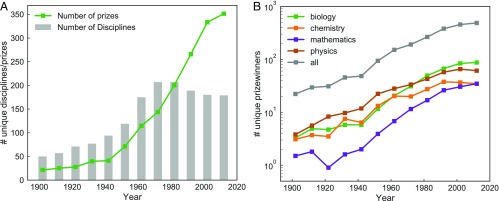
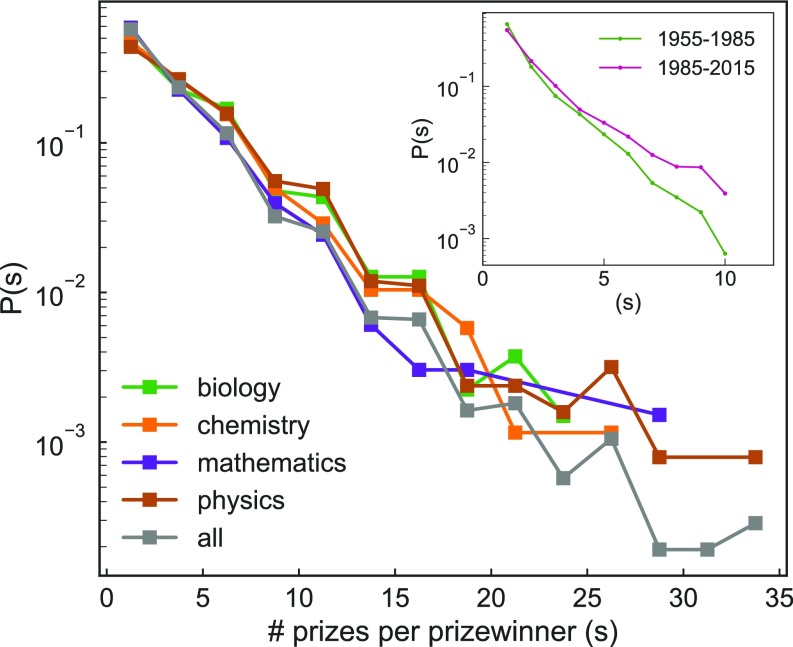
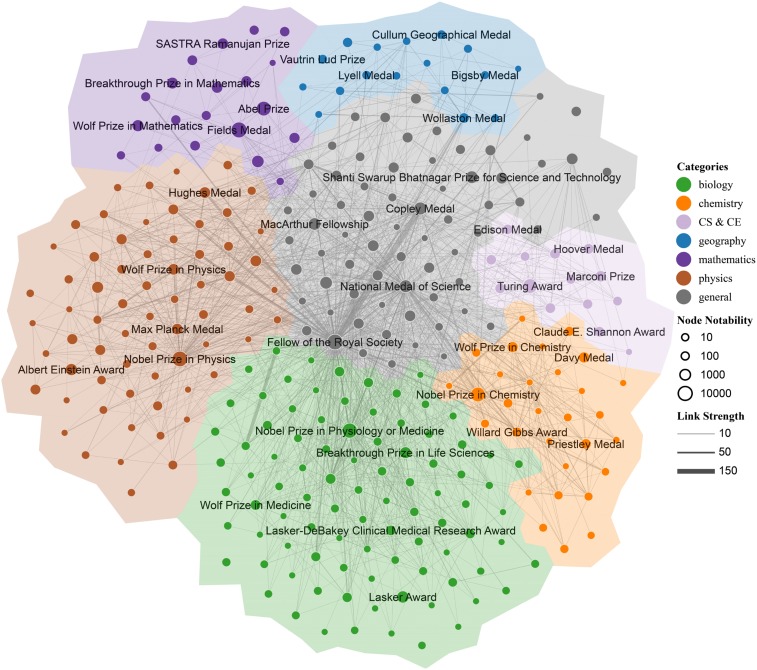
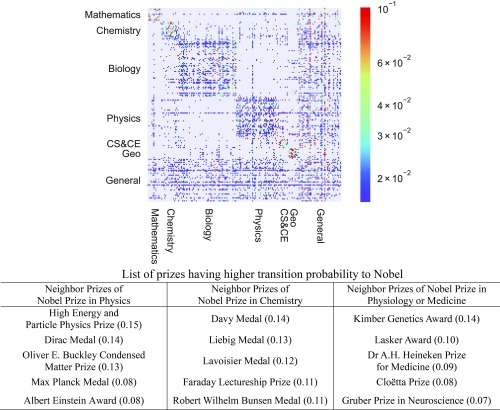
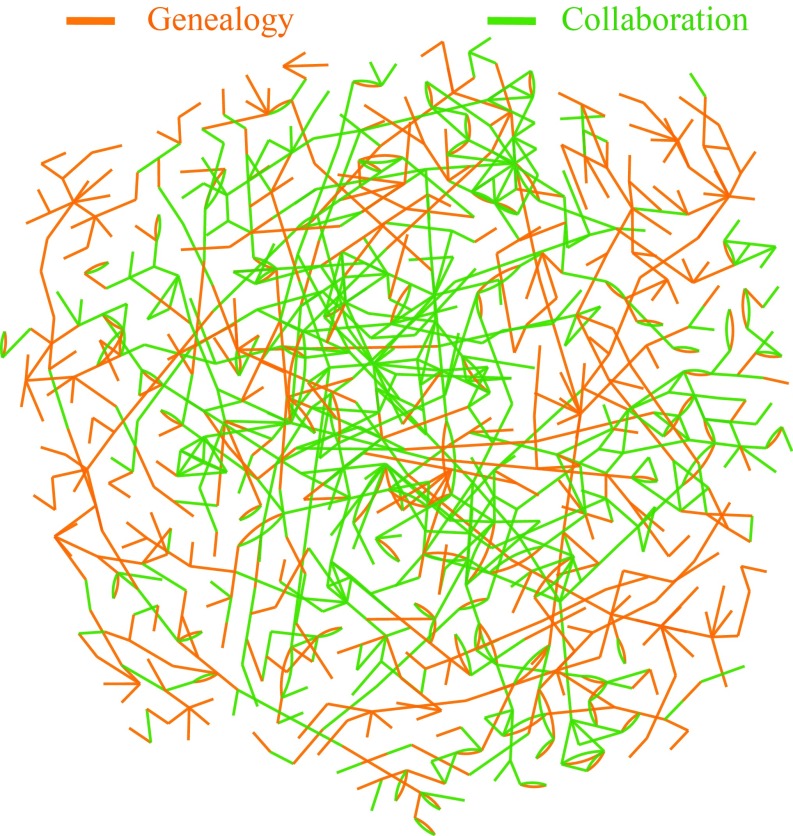
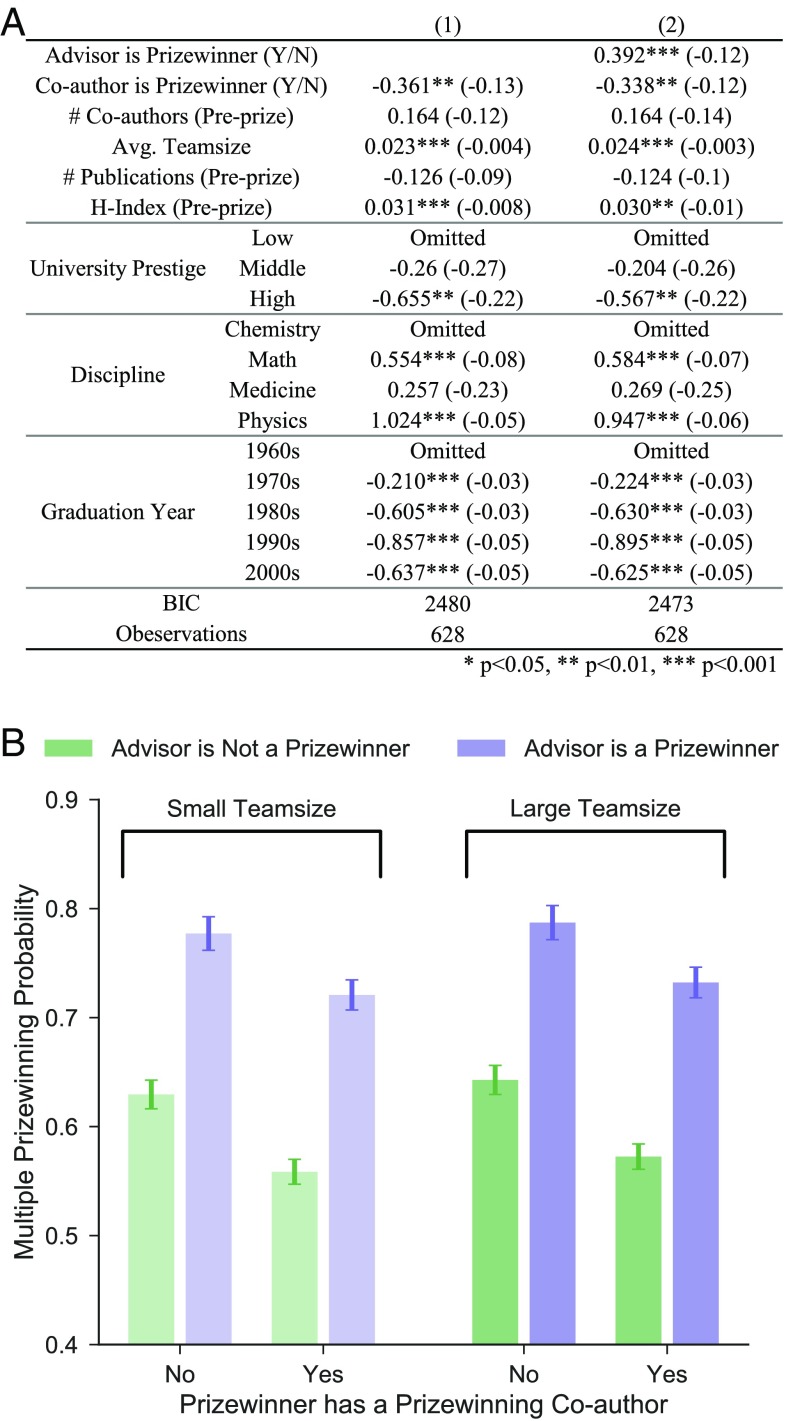
Scientific prizes confer credibility to persons, ideas, and disciplines, provide financial incentives, and promote community-building celebrations. We examine the growth dynamics and interlocking relationships found in the worldwide scientific prize network. We focus on understanding how the knowledge linkages among prizes and scientists' propensities for prizewinning relate to knowledge pathways between disciplines and stratification within disciplines. Our data cover more than 3,000 different scientific prizes in diverse disciplines and the career histories of 10,455 prizewinners worldwide for over 100 years. We find several key links between prizes and scientific advances. First, despite an explosive proliferation of prizes over time and across the globe, prizes are more concentrated within a relatively small group of scientific elites, and ties among elites are highly clustered, suggesting that a relatively constrained number of ideas and scholars push the boundaries of science. For example, 64.1% of prizewinners have won two prizes and 13.7% have won five or more prizes. Second, certain prizes strongly interlock disciplines and subdisciplines, creating key pathways by which knowledge spreads and is recognized across science. Third, genealogical and coauthorship networks predict who wins multiple prizes, which helps to explain the interconnectedness among celebrated scientists and their pathbreaking ideas.

Keywords: Nobel; computational social science; genealogy; science of science; social networks.


Conflict of interest statement

The authors declare no conflict of interest.

Figures

Fig. 1.
Fig. 1.
A century of scientific prizes. A and B represent the relative proliferation of scientific prizes (A) and prizewinners (B) from 1900 to 2015. A shows the proliferation of prizes and the proliferation of separate scientific (sub)disciplines. Before 1980, there is a similar proliferation rate for disciplines and prizes, although there were nearly twice as many scientific disciplines as prizes; after 1980, prizes continue to proliferate at the pre-1980 rate and by 2015 outnumber the number of scientific fields at a 2:1 ratio.
Fig. 2.
Fig. 2.
The exponential distribution of scientific prizewinning. Plot and Inset show the number of prizes per prizewinner and the change in the distribution of prizes per winner before and after 1985, the midpoint of our data. The distribution on prizes per prizewinner fits an exponential distribution and indicates that many different prizes are won by a relatively small number of scholars. For example, over 60% of prizewinners are two-time winners of different prizes and about 15% are five-time winners of different prizes. The Inset shows that this heavy concentration of diverse prizes among a relatively small scientific elite has intensified. Despite there being nearly twice as many prizes after 1985 than before 1985, fewer scientists win a larger share of available prizes.
Fig. 3.
Fig. 3.
The scientific prize network. In the network, nodes denote prizes, and node size reflects the prize’s relative notability within its discipline. Links are formed between a pair of prizes when the same scientist wins both prizes. The link weight is proportional to the number of scientists who won both prizes. Most prizes cluster within a discipline, but certain prizes create knowledge interlocks between disciplines.
Fig. 4.
Fig. 4.
Scientific prize transition matrix. When two different prizes are won by the same scholar(s), they form an interlock between prizes. The interlock designates a pathway of knowledge flows within and between subdisciplines. Interlocks also represent the propensity for winning a prize conditional on winning another prize. These propensities are represented by the values in the transition matrix of the prize network. Chemistry and physics have relatively high transition probabilities among prizes relative to math and biology. General prizes play the unique role of integrating diverse sciences. The table below the transition matrix shows the prizes with the highest transition propensities to the Nobel prizes (the transition probabilities are shown in brackets).
Fig. 5.
Fig. 5.
Social network of prizewinners. Nodes (not shown) represent prizewinners, and links represent the presence of genealogical or collaborative relationships between winners. Network shown here contains 830 winners, in which only strong coauthorship ties (links with more than three coauthored papers) are shown. Genealogical relationships, which are a scholar’s primary, formative relationships, are more evenly distributed throughout the network than are coauthorship ties, which are noticeably concentrated in the dense center of the network and continue to grow in number throughout most scholars’ careers.
Fig. 6.
Fig. 6.
Ordered logistic regression estimates of the propensity to win multiple prizes, 1960–2015. (A) The table reports estimates of a scientist’s propensity for winning multiple prizes conditional on having won one prize. The independent variables include a scientist’s genealogical and coauthorship networks, individual human capital variables, and controls for discipline, university prestige, and graduation date (SEs are shown in brackets). (B) The predicted probabilities to win multiple prizes if a scientist has a prizewinning coauthor or prizewinning genealogy by small or large average team size as measured by number of authors on a paper.
Fig. 7.
Fig. 7.
Statistics of Wikipedia page views. In A, each gray line is the monthly page views of a prize, and the colored line with SE is the average over prizes in the field. In B, distributions of the average monthly views for each prize are shown; dots represent the fraction of prizes in each binned set of prizes by their page views, and lines are the probability distributions estimated from the Gauss kernel density function.

References

    1. Zuckerman H. Stratification in American science. Sociol Inq. 1970;40:235–257.
    1. Rzhetsky A, Foster JG, Foster IT, Evans JA. Choosing experiments to accelerate collective discovery. Proc Natl Acad Sci USA. 2015;112:14569–14574. - PMC - PubMed
    1. Foster JG, Rzhetsky A, Evans JA. Tradition and innovation in scientists’ research strategies. Am Sociol Rev. 2015;80:875–908.
    1. Azoulay P, Graff Zivin JS, Manso G. Incentives and creativity: Evidence from the academic life sciences. Rand J Econ. 2011;42:527–554.
    1. Cole S, Cole JR. Scientific output and recognition: A study in the operation of the reward system in science. Am Sociol Rev. 1967;32:377–390. - PubMed

Publication types