. 2018 Dec 26;115(52):13276-13281.
doi: 10.1073/pnas.1811364115. Epub 2018 Dec 10.

Experimental accuracy in protein structure refinement via molecular dynamics simulations

Affiliations

Experimental accuracy in protein structure refinement via molecular dynamics simulations

Lim Heo et al. Proc Natl Acad Sci U S A. .

Abstract

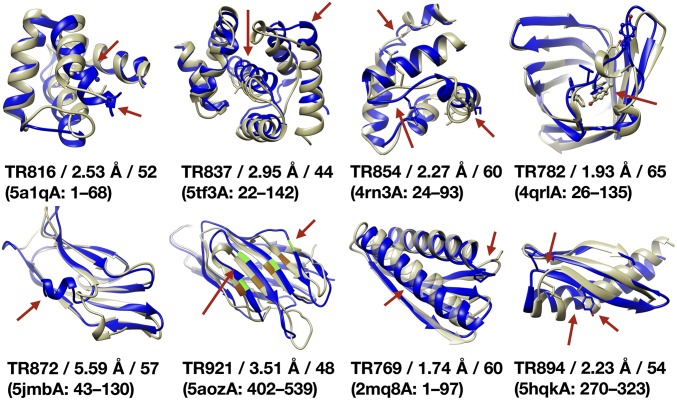
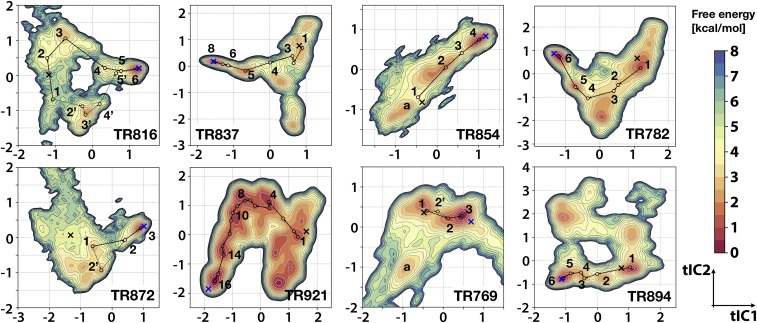
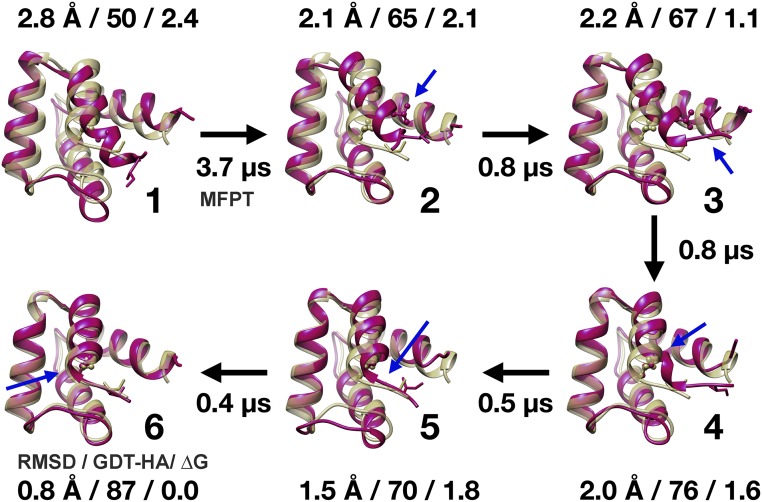
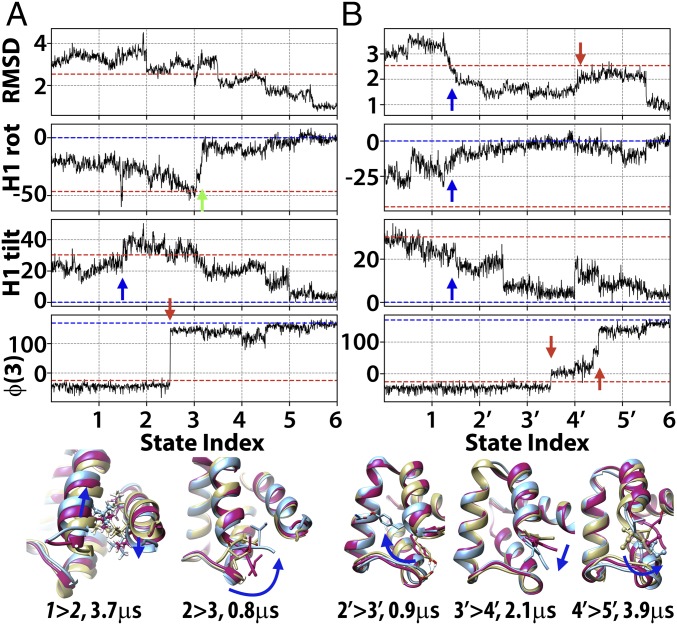
Refinement is the last step in protein structure prediction pipelines to convert approximate homology models to experimental accuracy. Protocols based on molecular dynamics (MD) simulations have shown promise, but current methods are limited to moderate levels of consistent refinement. To explore the energy landscape between homology models and native structures and analyze the challenges of MD-based refinement, eight test cases were studied via extensive simulations followed by Markov state modeling. In all cases, native states were found very close to the experimental structures and at the lowest free energies, but refinement was hindered by a rough energy landscape. Transitions from the homology model to the native states require the crossing of significant kinetic barriers on at least microsecond time scales. A significant energetic driving force toward the native state was lacking until its immediate vicinity, and there was significant sampling of off-pathway states competing for productive refinement. The role of recent force field improvements is discussed and transition paths are analyzed in detail to inform which key transitions have to be overcome to achieve successful refinement.

Keywords: Markov state model; conformational sampling; energy landscape; force field; protein structure prediction.


Conflict of interest statement

The authors declare no conflict of interest.

Figures

Fig. 1.
Fig. 1.
Protein test set. Experimental structures (yellow) and homology models (blue) with CASP ID, PDB ID of the experimental structure, residue ranges, and deviations in Cα-RMSD and GDT-HA. Red arrows and stick representations identify modeling errors and key residues. For TR921, the highlighted residues M66, N75, D40, and E119 indicate alignment errors.
Fig. 2.
Fig. 2.
Free energy landscapes and refinement pathways. Potentials of mean force projected onto the first two tIC principal coordinates according to the color bar. Contour lines are drawn for every 0.5 kcal/mol up to 8.0 kcal/mol. For TR816, TR872, and TR769, the maps focus on the major regions relevant for refinement. The entire maps for these systems are shown in SI Appendix, Fig. S3. Projections of the experimental structures and initial homology models are indicated with blue and black Xs, respectively. Refinement pathways and intermediate states identified from the MSM analysis are marked with arrows and numbered circles. Alternative pathways are indicated with dashed lines, and additional off-pathway states discussed in Free Energy Landscapes are labeled with lowercase letters.
Fig. 3.
Fig. 3.
Refinement path transition in TR816. Ensemble-averaged structures for MSM states during refinement transitions (magenta) are compared with experimental structures (yellow) for one of two paths. The alternative path is shown in SI Appendix, Fig. S6. The numbering of states corresponds to the states identified in Fig. 2. Cα-RMSD values, GDT-HA scores, and free energies in kilocalories per mole are given for each state, and mean first passage times (MFPT) refer to transitions toward the native state. Blue arrows indicate key structural changes after each transition.
Fig. 4.
Fig. 4.
Structural transitions during refinement of TR816. Progress in terms of Cα-RMSD, rotation, and tilt angles of the N-terminal helix (H1, residues 4 to 15) with respect to the experimental structure, and φ backbone torsion for residue 3 along subsampled refinement trajectories. Two alternative paths are shown in A and B along states numbered as in Figs. 2 and 3. Key transitions are indicated with arrows. Dashed lines show values in the experimental structure (blue) and the initial homology model (red). Selected transition states are shown in molecular detail (magenta) with structures before (yellow) and after (blue). Colored arrows are referred to in Kinetics of Transitions from Initial to Native States. Additional details are shown in SI Appendix, Fig. S13.

References

    1. Kolodny R, Pereyaslavets L, Samson AO, Levitt M. On the universe of protein folds. Annu Rev Biophys. 2013;42:559–582. - PubMed
    1. Zhang Y, Hubner IA, Arakaki AK, Shakhnovich E, Skolnick J. On the origin and highly likely completeness of single-domain protein structures. Proc Natl Acad Sci USA. 2006;103:2605–2610. - PMC - PubMed
    1. Westbrook J, Feng Z, Chen L, Yang H, Berman HM. The Protein Data Bank and structural genomics. Nucleic Acids Res. 2003;31:489–491. - PMC - PubMed
    1. Bonneau R, Baker D. Ab initio protein structure prediction: Progress and prospects. Annu Rev Biophys Biomol Struct. 2001;30:173–189. - PubMed
    1. Wu S, Skolnick J, Zhang Y. Ab initio modeling of small proteins by iterative TASSER simulations. BMC Biol. 2007;5:17. - PMC - PubMed

Publication types