. 2019 Jan 31;133(5):457-469.
doi: 10.1182/blood-2018-05-850412. Epub 2018 Dec 10.

Single-cell analyses demonstrate that a heme-GATA1 feedback loop regulates red cell differentiation

Affiliations

Single-cell analyses demonstrate that a heme-GATA1 feedback loop regulates red cell differentiation

Raymond T Doty et al. Blood. .

Abstract

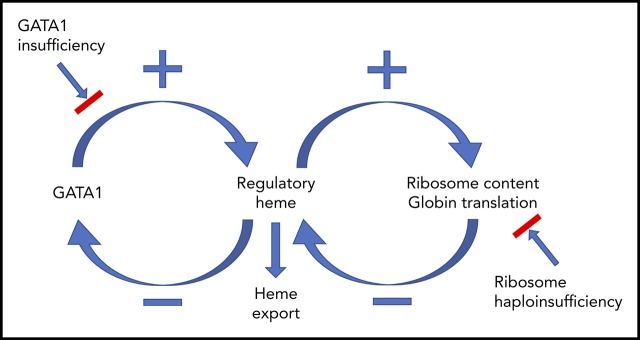
Erythropoiesis is the complex, dynamic, and tightly regulated process that generates all mature red blood cells. To understand this process, we mapped the developmental trajectories of progenitors from wild-type, erythropoietin-treated, and Flvcr1-deleted mice at single-cell resolution. Importantly, we linked the quantity of each cell's surface proteins to its total transcriptome, which is a novel method. Deletion of Flvcr1 results in high levels of intracellular heme, allowing us to identify heme-regulated circuitry. Our studies demonstrate that in early erythroid cells (CD71+Ter119neg-lo), heme increases ribosomal protein transcripts, suggesting that heme, in addition to upregulating globin transcription and translation, guarantees ample ribosomes for globin synthesis. In later erythroid cells (CD71+Ter119lo-hi), heme decreases GATA1, GATA1-target gene, and mitotic spindle gene expression. These changes occur quickly. For example, in confirmatory studies using human marrow erythroid cells, ribosomal protein transcripts and proteins increase, and GATA1 transcript and protein decrease, within 15 to 30 minutes of amplifying endogenous heme synthesis with aminolevulinic acid. Because GATA1 initiates heme synthesis, GATA1 and heme together direct red cell maturation, and heme stops GATA1 synthesis, our observations reveal a GATA1-heme autoregulatory loop and implicate GATA1 and heme as the comaster regulators of the normal erythroid differentiation program. In addition, as excessive heme could amplify ribosomal protein imbalance, prematurely lower GATA1, and impede mitosis, these data may help explain the ineffective (early termination of) erythropoiesis in Diamond Blackfan anemia and del(5q) myelodysplasia, disorders with excessive heme in colony-forming unit-erythroid/proerythroblasts, explain why these anemias are macrocytic, and show why children with GATA1 mutations have DBA-like clinical phenotypes.


Conflict of interest statement

Conflict-of-interest disclosure: The authors declare no competing financial interests.

Figures

None
Graphical abstract
Figure 1.
Figure 1.
Early committed erythroid progenitors (BFU-E to basophilic erythroblasts) separate into 4 transcriptional groups correlating with Ter119 staining intensity. (A) Flow cytometry assessment of marrow cells from wild-type, Flvcr1-deleted, and EPO-treated mice. B220Gr1CD11b marrow cells were divided into populations I-V as before., Single erythroid precursors from populations I and II were analyzed as described in the Materials and methods. In wild-type mice, the hemoglobin (HGB) equals 13.8 ± 0.7, and mean corpuscular volume (MCV) equals 44.8 ± 3.1; in Flvcr1-deleted mice, the HGB is 6.2 ± 1.3 and MCV is 72.2 ± 1.9, and in EPO-treated mice, the HGB is 15.9 ± 1.1 and MCV is 53.9 ± 0.9. The percentages of erythroid cells with given Ter119 intensities varied substantially; for example, Ter119neg cells comprised 0.93%, 4.39%, and 1.69% of cells from wild-type, Flvcr1-deleted, and EPO-treated mice, respectively. (B) Method validation. Transcription (RPKM) of α-globin (Hba-a1) closely correlated with β-globin (Hbb-bs) (r = 0.98), reflecting their coordinate regulation. The RNA-to-protein correlation of Glya to Ter119 (r = 0.56) was high, whereas Tfrc to CD71 (r = 0.41) was lower, as anticipated, as transferrin is a highly recycled protein. CD44 staining did not correlate with Cd44 expression (r = 0.15), indicating that Cd44 transcription decreases before or very early after erythroid commitment and protein levels and then decreases with successive cell divisions., (C) A plot of the Ter119 staining intensity of cells from wild-type mice identified 4 distinct cell groups, labeled A-D. This established the Ter119 staining intensity cutoffs that were then applied to cells isolated from Flvcr1-deleted and EPO-treated mice to identify developmentally equivalent cell groups in an unbiased manner. (D) Normalized Ter119 expression levels of individual cells from wild-type control, Flvcr1-deleted, and EPO-treated mice grouped A-D, using the cutoffs of panel C. Flvcr1-deleted cluster A cells are further separated into A (alive) and Ad (dying) subsets. Mean values ± SD are presented.
Figure 2.
Figure 2.
PCA reveals a distinct transcriptional program in cells from Flvcr1-deleted mice. (A) α-globin (Hba-a1, left) and β-globin (Hbb-bs, right) gene expression levels (RPKM) grouped by Ter119-based clusters (A-D) for each marrow sample. Cells from Flvcr1-deleted mice have significantly higher globin transcript levels than either control, showing that heme, but not EPO, increases globin transcription. Mean values ± SD are presented. Differences in gene expression levels between the cell clusters from wild-type control mice and Flvcr1-deleted or EPO-treated mice were identified by t test. *P ≤ .05; **P ≤ .01; ***P ≤ .001. (B) Two-component PCA of all gene expression with the mean gene expression trajectory of each cell cluster A-D shown as individual vectors for cell clusters from wild-type mice (indicated WA-WD) and Flvcr1-deleted mice (indicated DA-DD). Group A cells from both mice (WA and DA) are transcriptionally similar, as shown by their colocalization; however, their subsequent differentiation follows different trajectories. The erythroid cells from wild-type mice (WB to WD) progress clockwise, whereas cells from Flvcr1-deleted mice (DB to DD) progress counterclockwise. As anticipated, the dying cluster A cells (DAd) are transcriptionally distinct. Erythroid differentiation genes were generally distributed along the y-axis, whereas proliferation genes were generally distributed along the x-axis. Some genes with large projections are identified. (C) An independent 2-component PCA of cell clusters from EPO-treated mice (indicated EA-ED) shows that the erythroid differentiation of these clusters tracks comparably to clusters from wild-type mice (WA-WD). The same genes are highlighted as in panel B to facilitate comparison. Together, the analyses show that erythroid cells from wild-type and EPO-treated mice are transcriptionally similar throughout differentiation, whereas the transcriptional profile of erythroid cells from Flvcr1-deleted mice differs from both controls.
Figure 3.
Figure 3.
Heme increases ribosomal protein content in early erythroid cells. (A) GSEA enrichment plot of the KEGG ribosome pathway. Nominal P values for individual cells in clusters A-D of wild-type control, EPO-treated, and Flvcr1-deleted mice are shown. (B) Transcript expression levels (RPKM) of ribosomal protein genes. Mean values ± SD for each cluster are graphed. Differences in gene expression levels between the cell clusters from wild-type control mice and Flvcr1-deleted or EPO-treated mice were identified by t test. (C-F) Studies in early human erythroid cells (CD36+GlyA) treated with or without 0.5 mM ALA for up to 30 minutes. ALA rapidly increases intracellular heme content (C), resulting in elevated ROS (D) and the increased expression of RPS19, RPS24, and RPS26 protein and mRNA (E). Representative western blots are in supplemental Figure 5. Levels of 18s and 28s rRNA also increase (F). The expression levels of experimental samples were normalized relative to the untreated control samples collected at the same time. Mean values ± SEM for 3 to 4 independent studies are shown. Differences relative to untreated (T0) were evaluated by 1-way ANOVA with a post hoc Tukey’s test. *(mRNA) or †(protein) P ≤ .05; ** or ††P ≤ .01; ***P ≤ .001.
Figure 4.
Figure 4.
Heme regulates both GATA1 mRNA and protein in erythroid cells. (A) GSEA enrichment plot of the hallmark heme metabolism pathway. Nominal P values for individual cells in clusters A-D of wild-type control, EPO-treated, and Flvcr1-deleted mice are shown. The hallmark heme metabolism pathway includes genes involved in both erythroid differentiation and heme synthesis. (B) Transcript expression levels (RPKM) of Gata1. Mean values ± SD for each cluster are graphed. Differences in gene expression levels between the cell clusters from wild-type control mice and Flvcr1-deleted or EPO-treated mice were identified by t test. (C-D) GSEA enrichment plots of genes in the GATA1 cluster (supplemental Table 5). Nominal P values for individual cells in clusters A-D of wild-type and Flvcr1-deleted mice (C) or cells in clusters A-D from wild-type, EPO-treated, and Flvcr1-deleted mice (D) are shown. GSEA is a nondeterminant method that calculates the reference baseline from all cells in the analysis. This reference baseline varies depending on the cells that are included. Inclusion of the cells from EPO-treated mice thus alters the GSEA reference baseline, which increases the nominal P value for many individual cells when panel D is compared with panel C. Cells from the Flvcr1-deleted mice show significantly less upregulation of GATA1 cluster genes than cells from either wild-type or EPO-treated mice. (E) Heat map showing changes in expression of GATA1 cluster genes. Log2 transformed relative expression levels of each of the 150 genes in the GATA1 cluster in individual cells grouped by cluster A-D isolated from either wild-type control or Flvcr1-deleted mice. (F) Studies in early (CD36+GlyA) and intermediate-late (CD36+GlyA+) human erythroid cells treated with or without 0.5 mM ALA for up to 30 minutes. GATA1 protein and mRNA concurrently decrease within 15 minutes after adding ALA. Representative western blot images are below (RI, relative band intensity; in parenthesis are the values normalized to actin). Normalized expression levels are presented relative to untreated samples collected at the same time. Western blot band intensities were within the linear sensitivity range of the digital detection system. Additional representative blots are in supplemental Figure 12. This time course is informative, as these normal human erythroid marrow cells express FLVCR and will export excess heme induced by ALA treatment, effectively restoring homeostasis without affecting cell viability. Because of this, we limited these studies to 30 minutes or less. Data are presented as mean values ± SEM of 3 to 6 independent experiments. Differences relative to untreated (T0) were evaluated by 1-way ANOVA with the post hoc Tukey’s test. *(mRNA) P ≤ .05; ** or ††(protein) P ≤ .01; †††P ≤ .001.
Figure 5.
Figure 5.
Heme synthesis rapidly downregulates GATA1 and upregulates β-globin in K562 cells. (A) K562 cells were treated with or without 0.5 mM ALA or ALA and 0.5 mM succinylacetone and analyzed for heme content, ROS levels, GATA1 protein, and β-globin protein content. Normalized expression levels are presented relative to untreated samples collected at the same time. As expected, within 15 minutes after ALA addition, heme content, ROS and β-globin protein increased and GATA1 protein decreased. These changes fail to occur when ALA (which bypasses the first step in heme synthesis) and succinylacetone (which blocks the second step in heme synthesis) were both added, thus demonstrating that the outcomes are heme-dependent. (B) Representative western blots for GATA1 and β-globin protein quantitation (RI, relative band intensity; in parenthesis are the values normalized to actin) at 15 minutes. NT, no treatment. An additional representative blot is in supplemental Figure 16. (C) K562 cells transduced with a heme reporter construct containing wild-type β-globin enhancer and promoter elements driving luciferase or a negative control construct containing mutant MARE elements were treated with 0.5 mM ALA for up to 30 minutes and assayed for luciferase expression. Luciferase expression is a measure of regulatory heme, as it quantitates heme-dependent transcription. Relative luciferase levels are presented as fold over the negative control construct harvested at the same time. All data are presented as mean values ± SEM of 3 to 4 independent experiments. Differences relative to untreated (T0) samples were identified by t test analysis. *P ≤ .05; **P ≤ .01; ***P ≤ .001.
Figure 6.
Figure 6.
Erythroid failure caused by excess heme is independent of p53. Peripheral blood analysis of RBC, HGB, MCV, and marrow colony assays of CFU-E, BFU-E, or CFU-GM from control Trp53-null (PP ++ Mx, N = 5), Flvcr1-deleted (++ FF Mx, N = 4), or double-mutant (PP FF Mx, N = 4) mice. There was no improvement in any erythroid parameter in mice lacking both p53 and FLVCR1 compared with those only lacking FLVCR1. Analysis of 130 embryos from Flvcr1:Trp53 double-mutant breeding did not reveal any double Flvcr1-null Trp53-null embryos, whereas Trp53-null embryos were present at the expected frequency. Flvcr1-null embryos die because of failed erythropoiesis, and this further demonstrates that erythroid failure in mice lacking FLVCR is independent of p53. Data are presented as mean values ± SD. Differences relative to wild-type control (PP ++ Mx) mice were evaluated by 1-way ANOVA with the post hoc Tukey’s test. *P ≤ .05; **P ≤ .01; ***P ≤ .001.
Figure 7.
Figure 7.
Model describing how heme and GATA1 might coordinately regulate erythroid differentiation. (A) Normal erythropoiesis and (B) erythropoiesis in Flvcr1-deleted mice, patients with DBA, and patients with del(5q) MDS. When erythropoiesis begins, GATA1 upregulates ALAS2 and heme synthesis intensifies. Heme and GATA1 then coregulate erythroid gene expression and differentiation. During normal erythropoiesis (A), heme accumulates late when FLVCR is low. This excessive heme downregulates GATA1 and mitotic spindle proteins to ensure red cell differentiation terminates appropriately. In the absence of FLVCR (B), the quantity of heme exceeds the capacity of globin and other metabolic needs during the CFU-E/proerythroblast stage. This excessive heme then prematurely downregulates GATA1 and mitotic spindle proteins, prematurely terminating differentiation. Effective erythropoiesis requires the quick and efficient upregulation of heme and the facile coordination of heme with globin. In DBA, del(5q) MDS, and potentially other disorders in which protein synthesis is decreased (also B), heme synthesis likewise exceeds the capacity of globin and other hemoproteins in CFU-E/proerythroblasts. This also leads to the premature termination of erythropoiesis, and a clinical phenotype similar to Flvcr1-deleted mice. EB, erythroblast. This figure was illustrated with the Biology PPT Drawing Toolkit (Motifolio Inc).

References

    1. Kumar S, Bandyopadhyay U. Free heme toxicity and its detoxification systems in human. Toxicol Lett. 2005;157(3):175-188. - PubMed
    1. Dixon SJ, Lemberg KM, Lamprecht MR, et al. Ferroptosis: an iron-dependent form of nonapoptotic cell death. Cell. 2012;149(5):1060-1072. - PMC - PubMed
    1. Dixon SJ, Stockwell BR. The role of iron and reactive oxygen species in cell death. Nat Chem Biol. 2014;10(1):9-17. - PubMed
    1. Yang Z, Keel SB, Shimamura A, et al. Delayed globin synthesis leads to excess heme and the macrocytic anemia of Diamond Blackfan anemia and del(5q) myelodysplastic syndrome. Sci Transl Med. 2016;8(338):338ra67. - PMC - PubMed
    1. Melefors O, Goossen B, Johansson HE, Stripecke R, Gray NK, Hentze MW. Translational control of 5-aminolevulinate synthase mRNA by iron-responsive elements in erythroid cells. J Biol Chem. 1993;268(8):5974-5978. - PubMed

Publication types

MeSH terms