Review
. 2018 Dec 10:363:k4245.
doi: 10.1136/bmj.k4245.

Personalized evidence based medicine: predictive approaches to heterogeneous treatment effects

Affiliations
Review

Personalized evidence based medicine: predictive approaches to heterogeneous treatment effects

David M Kent et al. BMJ. .

Abstract

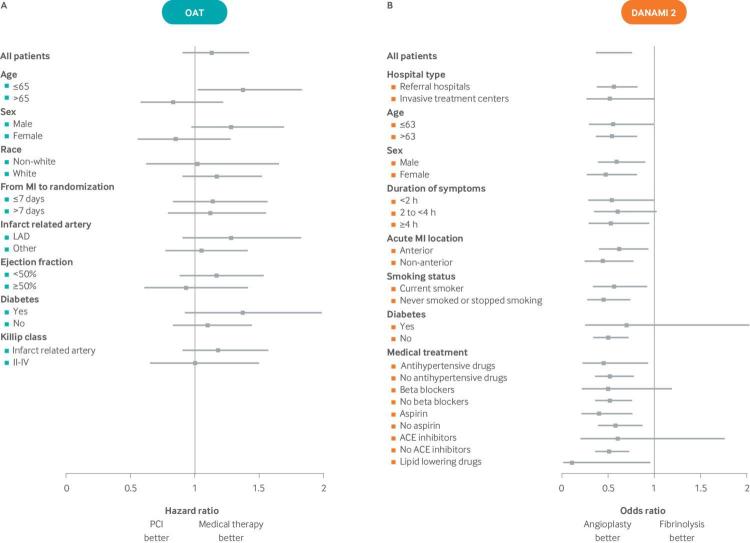
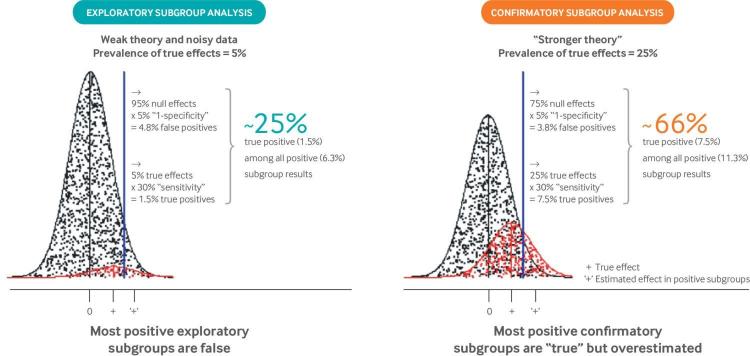
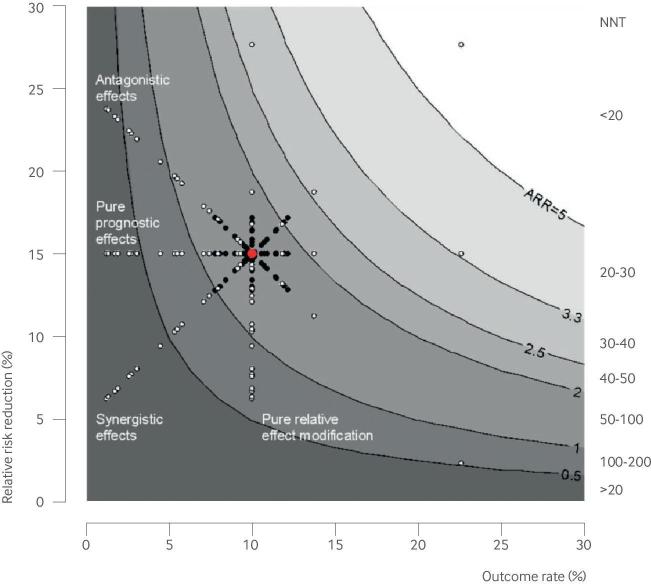
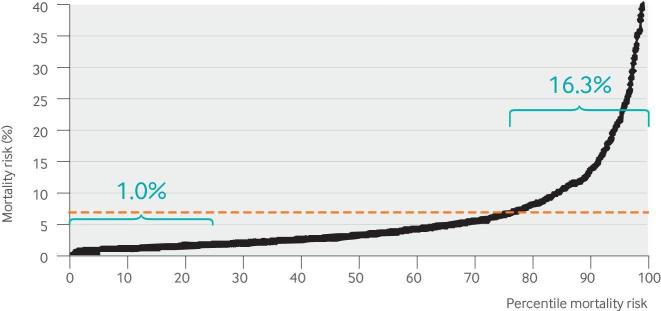
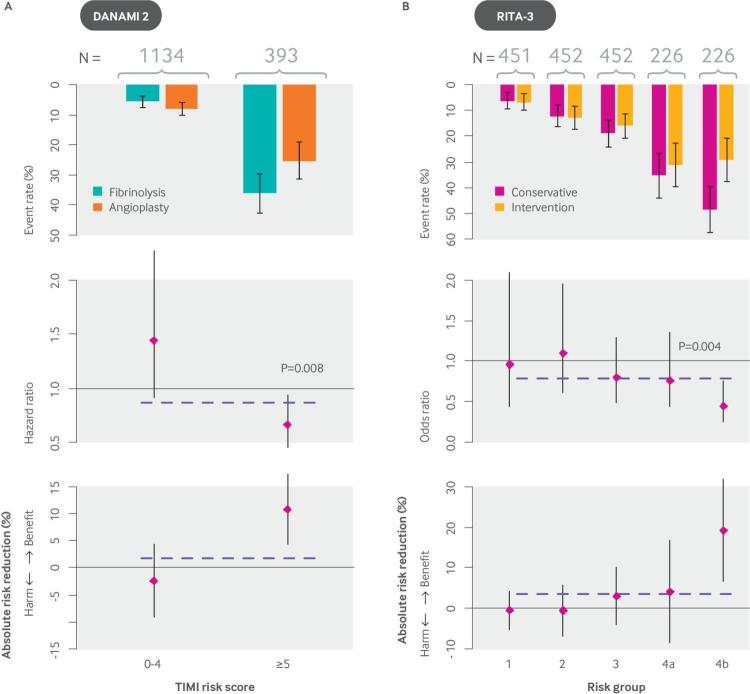
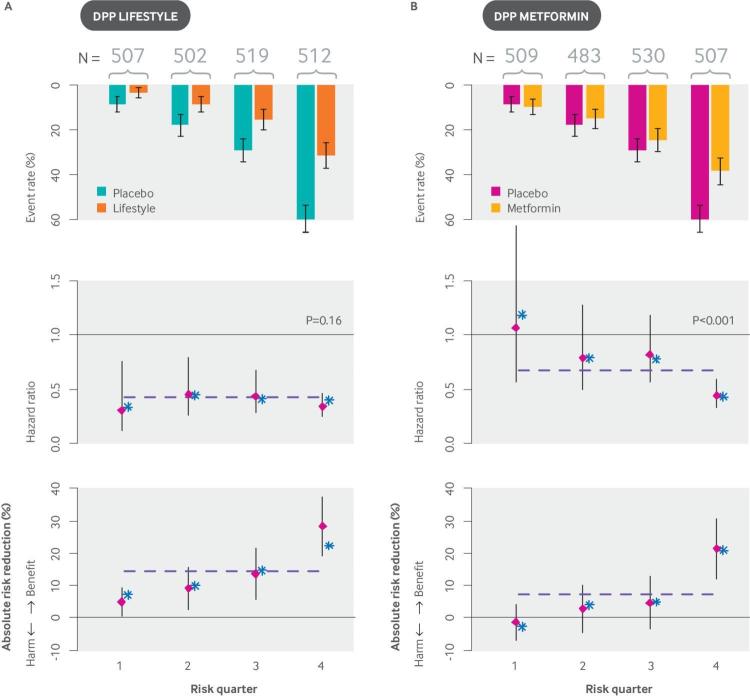
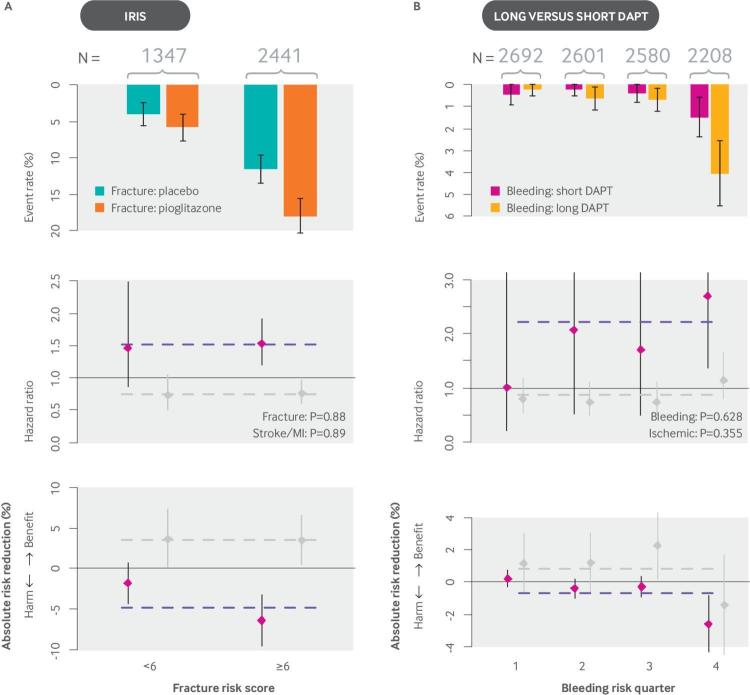
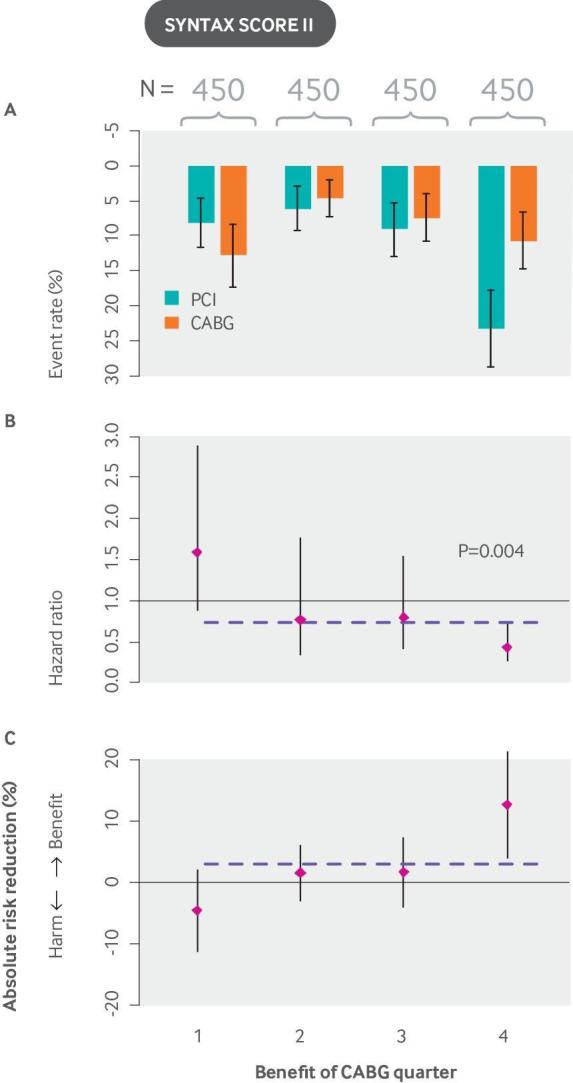
The use of evidence from clinical trials to support decisions for individual patients is a form of "reference class forecasting": implicit predictions for an individual are made on the basis of outcomes in a reference class of "similar" patients treated with alternative therapies. Evidence based medicine has generally emphasized the broad reference class of patients qualifying for a trial. Yet patients in a trial (and in clinical practice) differ from one another in many ways that can affect the outcome of interest and the potential for benefit. The central goal of personalized medicine, in its various forms, is to narrow the reference class to yield more patient specific effect estimates to support more individualized clinical decision making. This article will review fundamental conceptual problems with the prediction of outcome risk and heterogeneity of treatment effect (HTE), as well as the limitations of conventional (one-variable-at-a-time) subgroup analysis. It will also discuss several regression based approaches to "predictive" heterogeneity of treatment effect analysis, including analyses based on "risk modeling" (such as stratifying trial populations by their risk of the primary outcome or their risk of serious treatment-related harms) and analysis based on "effect modeling" (which incorporates modifiers of relative effect). It will illustrate these approaches with clinical examples and discuss their respective strengths and vulnerabilities.


Conflict of interest statement

Competing interests: All authors have read and understood BMJ policy on declaration of interests and declare no competing interests.

Figures

Fig 1
Fig 1
HRs (black squares) and 95% confidence intervals (horizontal lines) for the primary outcome for PCI versus medical therapy for subgroups are shown. Despite what seems to be clinically significant differences in treatment effects across several variables (eg, qualitative interactions for both age and sex), no statistically significant interaction was found between treatment and any of the subgrouping variables, indicating “consistency of effects across clinical significant subgroups.” The discrepancy between the apparent clinical importance of the observed effect heterogeneity and the lack of statistical significance reflects the very low statistical power for interaction effects, which is typical of most trials. (B) The DANAMI-2 trial also showed “consistency of effects” across all subgroups for the primary composite endpoint of death, reinfarction, or disabling stroke in 1572 patients randomly assigned to primary angioplasty versus fibrinolysis. Despite the similarity of effects in these one-variable-at-a-time subgroup analyses, a subsequent risk stratified analysis, using the TIMI (mortality) risk score, showed that patients who are at low risk of mortality are less likely to benefit than those at high risk, particularly on the clinically important absolute risk difference scale. Indeed, for the outcome of mortality, there was a slight trend for harm among the three quarters of patients at lowest risk and a very large benefit for the quarter of patients classified as high mortality risk (see fig 5). Conventional subgroup analyses, such as those described in this forest plot, can miss these clinically important differences because, when patients are serially divided into groups defined one-variable-at-a-time, each analysis grossly under-represents the heterogeneity across individual patients who differ from one another in many variables simultaneously. These analyses also obscure variation in treatment effect on the risk difference scale, which is the most important scale to assess clinically. Abbreviations: ACE: angiotensin converting enzyme; DANAMI-2: Danish Multicenter Randomized Study on Fibrinolytic Therapy Versus Acute Coronary Angioplasty in Acute Myocardial Infarction; LAD: left anterior descending; MI: myocardial infarction; OAT: Occluded Artery Trial; PCI: percutaneous coronary intervention.
Fig 2
Fig 2
Why most positive subgroup effects are false or overestimated. The well known unreliability of subgroup analysis arises from the fact that interaction tests typically have weak power when performed in randomized clinical trials designed to have 80% or 90% power to detect main treatment effects, and also by the fact that multiple poorly motivated subgroups are typically evaluated. “Exploratory” analyses are depicted by the distributions on the left, in which subgroup analyses are undertaken across multiple variables to detect the 5% that represent true effect modification (shown in red). This prevalence of “true effects” was chosen to emulate previous meta-epidemiologic studies. Assuming 30% power to detect interaction effects, only a minority of these true effects (1.5/5=30%) are anticipated to show statistically significant effects. Meanwhile, with an α of 0.05 (P value threshold), 5% of the null variables (shown in black) are also anticipated to be statistically significant (5/95=4.8%). Thus, only a minority of results with a P value <0.05 (1.5/6.3 of the effect estimates falling to the right of the blue threshold) represent true subgroup effects. The false discovery rate is much lower when only variables with a higher prior probability are tested. The distribution on the right depicts “confirmatory” analyses with a prior probability of 25%. Here, about two thirds of subgroups with a P value <0.05 (7.5/11.3) are anticipated to represent true effects. Even then, subgroup effects will generally be overestimated because exaggerated effects are preferentially identified. This exaggeration of effects has been referred to as “testimation bias” because it arises when hypothesis testing statistical approaches (eg, for biomarker discovery) are combined with effect estimation.
Fig 3
Fig 3
The value of a marker for targeting of treatment depends on its influence both on outcome risk and on relative treatment effect. The domain along the x axis quantifies prognostic effects; the range along the y axis quantifies relative effect modification (sometimes called “predictive” effects). The clinically significant effect measure (absolute risk difference or number needed to treat (NNT)) is depicted by the contour plot. The average effect in the overall trial is shown by the large red dot, which can be disaggregated into subgroups (shown by the smaller black and white dots) in different ways. Both pure prognostic markers (which scatter patient subgroups horizontally) and pure relative effect modifying (“predictive”) markers (which scatter patient subgroups vertically) help discriminate patient groups with different degrees of absolute benefit. Asymmetry of the scatter represents the usual non-normal distribution of risk (here shown as log normal, with a greater number of low risk and low benefit patients). Generally, “predictive” markers are more difficult to identify than prognostic markers, both because reliable information about effect modifiers is usually scant and because power to examine treatment effect interactions is substantially lower than prognostic effects. However, factors are often both prognostic and relative effect modifying, and these effects may be “synergistic” (relative risk reduction and outcome risk positively correlated) or “antagonistic” (relative risk reduction and outcome risk negatively correlated). The most useful factor for treatment selection is that for which the absolute risk difference most varies as a function of that factor’s value (here, the “synergistic” example). This corresponds to improved discrimination for treatment benefit on the risk difference scale. Note that for the factor with antagonistic effects, patients with the largest relative treatment effect paradoxically benefit the least on the absolute scale. From a decision analytic perspective, the clinical value of the marker is determined by its ability to distribute patients across a decisionally important threshold, which depends on the treatment burden (accounting for patient preferences, adverse effects, and costs). These decision thresholds are represented by the contours
Fig 4
Fig 4
Distribution of mortality risk. This distribution displays the predicted mortality risk in 1058 patients who received reperfusion therapy for ST elevation myocardial infarction at 28 US hospitals from the lowest risk (0th centile) to the highest risk (100th centile). Mortality risk is calculated using the individual patients’ clinical and electrocardiographic variables and a validated logistic regression equation. The dotted red line indicates that the average mortality risk is about 6%. However, about three quarters of patients have a risk lower than the average risk, and the typical (median) risk patient has a risk that is around half the average risk. The quarter of patients at lowest risk have only a 1% probability of 30 day mortality, so an invasive procedure such as percutaneous coronary intervention, is unlikely to reduce the risk of mortality any further in these patients. However, the quarter of patients at highest risk have substantial potential for benefit. In a conventional clinical trial, these patients with highly different risks are collapsed into a single overall population, even though benefit-harm trade-offs may differ greatly. This risk distribution is typical of trials with a low outcome rate, when a reasonably good multivariable predictive model is available to describe risk.
Fig 5
Fig 5
Analyses showing that invasive coronary procedures improve mortality in patients with ST elevation MI (DANAMI-2) in high risk but not low risk groups; this pattern holds true for mortality or reinfarction in non-ST elevation MI (RITA-3). (A) The DANAMI-2 trial tested an invasive procedure (PCI) against medical treatment in patients with ST elevation MI. (B) The RITA-3 trial compared an invasive strategy against medical treatment in patients with non-ST elevation MI/unstable angina. Event rates (upper plot), hazard ratios (middle plot) and absolute risk reductions (lower plot) are shown for each trial, with the average effect depicted by a dotted line. In DANAMI-2 (N=1527), a post hoc subgroup analysis stratified by risk showed that the approximately 75% of patients at low risk (TIMI score 0-4) received no mortality benefit—indeed, they had a non-significant trend towards harm. High risk patients (TIMI score ≥5) benefitted greatly from the invasive procedure (∼10% absolute reduction in mortality). The interaction (on the hazard ratio scale) between TIMI risk score and treatment effect was statistically significant (P<0.008). These effects were seen despite “consistency of effects” across all subgroups in conventional (one-variable-at-a-time) subgroup analyses. The RITA-3 trial (N=1810) showed a similar risk by treatment interaction for the outcome of death or non-fatal MI at four months when analyzed with an internally derived risk model. Absolute risk reduction in the primary outcome was very pronounced in the eighth of patients at highest risk, whereas the half at lowest risk received no benefit. DANAMI-2: Danish Multicenter Randomized Study on Fibrinolytic Therapy Versus Acute Coronary Angioplasty in Acute Myocardial Infarction; MI: myocardial infarction; OAT: Occluded Artery Trial; PCI: percutaneous coronary intervention; RITA-3: Randomized Intervention Trial of unstable Angina 3.
Fig 6
Fig 6
High risk patients with pre-diabetes benefit more than low risk patients from interventions with both homogeneous relative treatment effects (lifestyle) and heterogeneous relative treatment effects (metformin). The Diabetes Prevention Program trial compared three approaches to diabetes prevention among patients with pre-diabetes: (1) a rigorous lifestyle modification program; (2) metformin treatment; (3) and usual care. (A) The graphs show event rates, hazard ratios, and risk differences for (A) lifestyle modification versus usual care and (B) metformin versus usual care for the outcome of development of diabetes. Overall results are depicted by the horizontal dotted line; both lifestyle modification and metformin showed substantial effectiveness in preventing diabetes. When patients were stratified by their risk of diabetes according to a simple internally developed risk model, the treatment effect was homogeneous on the hazard ratio scale for lifestyle modification, but strongly heterogeneous for metformin (Pintervention <0.001). Nevertheless, similar HTE across risk strata was seen when the treatment effect was expressed on the risk difference scale. This analysis demonstrates the limited clinical value of null hypothesis testing for HTE on the proportional scale when the outcome rate differs so dramatically across risk groups. The clinical significance of HTE needs to be evaluated on the absolute scale, where the benefits of the strategies for preventing diabetes can be weighed against the treatment burdens. Stratification with an externally derived model yielded similar results, with strata specific point estimates of effects indicated by asterisks (*). HTE: heterogeneity of treatment effect.
Fig 7
Fig 7
Benefit-harm trade-offs change substantially when subgroups are stratified by their risk of treatment related harms. (A) In the IRIS study, pioglitazone was shown to reduce the risk of recurrent events (stroke or MI) (RR=0.76) in patients with ischemic stroke and insulin resistance, but with an increase in the risk of fracture. At five years, the incremental risk of fracture was 4.9% (13.6% v 8.8%; HR 1.53). When patients were stratified by their risk of fracture using a simple risk score with eight variables, for each 100 patients at low risk of fracture treated with pioglitazone for five years, two to three had a pioglitazone related fracture, compared with six to seven in each 100 patients at high risk. During this same interval, in both risk groups three to four fewer patients treated with pioglitazone had a recurrent stroke or MI. Thus, the number of ischemic events prevented per fracture caused was two in the group at low risk of fracture and 0.5 in the high risk group. When only serious fractures were considered (those requiring hospital admission or surgery), pioglitazone prevented six ischemic events per serious fracture caused in those at low risk of fracture, but only about one event in those at high risk. These clinically important differences in benefit-harm trade-offs across strata emerged despite consistency of effects on the proportional scale for both the harm and benefit of treatment. (B) Similarly, when patients were stratified by their bleeding risk using a simple five variable risk score, prolonged DAPT (aspirin plus clopidogrel or ticagrelor) after percutaneous coronary intervention had a very favorable harm-benefit trade-off in patients at low risk of bleeding but not in those at high risk. DAPT: dual antiplatelet therapy; HR: hazard ratio; IRIS: Insulin Resistance In Stroke; MI: myocardial infarction; RR: relative risk.
Fig 8
Fig 8
The SYNTAX score II stratifies patients with non-acute coronary artery disease on the basis of their risk of mortality with CABG versus PCI and is a useful guide to decision making. In the SYNTAX trial, rates of major adverse cardiac or cerebrovascular events at 12 months were significantly higher in the PCI group (17.8%) than in the CABG group (12.4%; P=0.002), confirming that CABG should be the preferred approach for patients with untreated three vessel or left main coronary artery disease. The SYNTAX score II was developed by applying a Cox proportional hazards model to the SYNTAX (Synergy Between Percutaneous Coronary Intervention With Taxus and Cardiac Surgery) trial (N=1800). It contains eight predictors: a previously developed anatomical SYNTAX score, age, creatinine clearance, left ventricular ejection fraction, presence of unprotected left main coronary artery disease, peripheral vascular disease, female sex, and COPD, plus treatment interaction terms with each of these variables. The graphs show (A) event rates, (B) hazard ratios, and (C) absolute risk reductions for CABG versus PCI. Unlike the examples shown in other figures, event rates do not increase monotonically across quarters because patients are stratified not by predicted risk but by predicted benefit (outcome risk with PCI minus outcome risk with CABG). Overall results, depicted by the horizontal dashed line, show a trend that favors CABG. However, when patients are stratified by their expected benefit, a quarter of patients who are treatment unfavorable is identified (Pinteraction=0.0037 for eight interaction terms), and benefit is largely confined to the quarter of patients at highest benefit. Although the SYNTAX score II has been validated for prediction of outcomes, it has not yet been validated for the prediction of benefit. CABG: coronary artery bypass graft surgery; COPD: chronic obstructive pulmonary disease; PCI: percutaneous coronary intervention.

References

    1. Hill AB. Reflections on controlled trial. Ann Rheum Dis 1966;25:107-13. 10.1136/ard.25.2.107 - DOI - PMC - PubMed
    1. Kahneman D. Thinking, fast and slow. Farrar, Straus and Giroux, 2011.
    1. Kahneman D, Lovato L. Timid choices and bold forecasts: a cognitive perspective on risk taking. Manage Sci 1993;39:17-31 10.1287/mnsc.39.1.17. - DOI
    1. Meehl PE. Clinical versus statistical prediction: a theoretical analysis and a review of the evidence. University of Minnesota Press, 1954. 10.1037/11281-000 . - DOI
    1. Saita Y, Ishijima M, Kaneko K. Atypical femoral fractures and bisphosphonate use: current evidence and clinical implications. Ther Adv Chronic Dis 2015;6:185-93. 10.1177/2040622315584114 - DOI - PMC - PubMed

Publication types