. 2019 Jan 2;129(1):349-363.
doi: 10.1172/JCI123391. Epub 2018 Dec 10.

Tumor-conditional anti-CTLA4 uncouples antitumor efficacy from immunotherapy-related toxicity

Affiliations

Tumor-conditional anti-CTLA4 uncouples antitumor efficacy from immunotherapy-related toxicity

Chien-Chun Steven Pai et al. J Clin Invest. .

Abstract

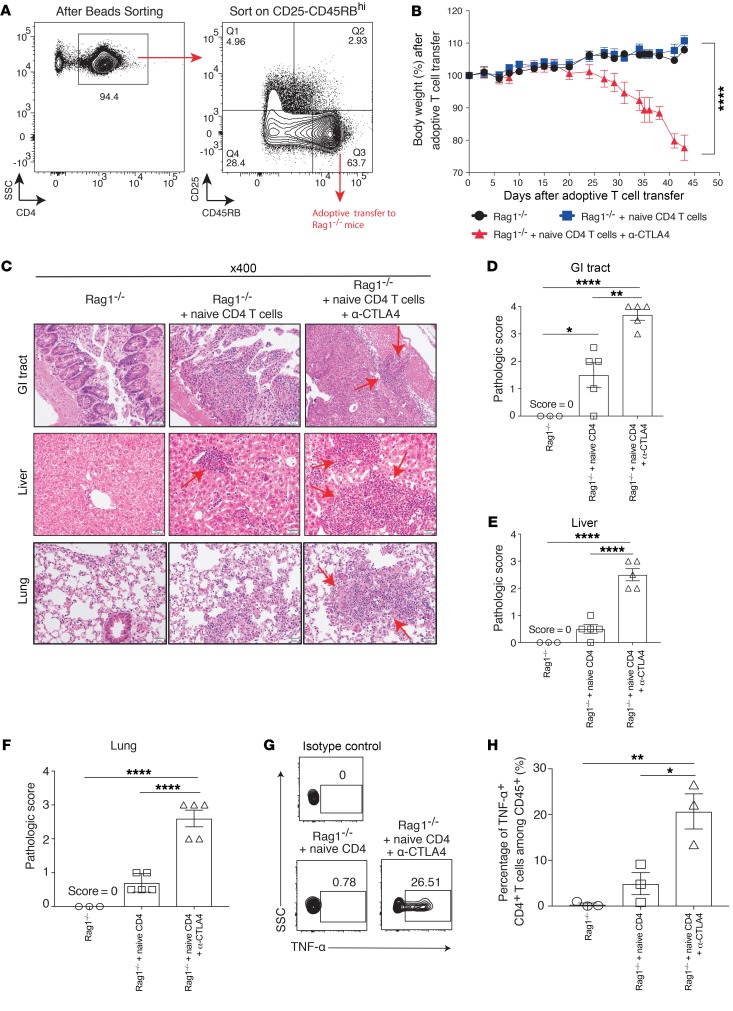
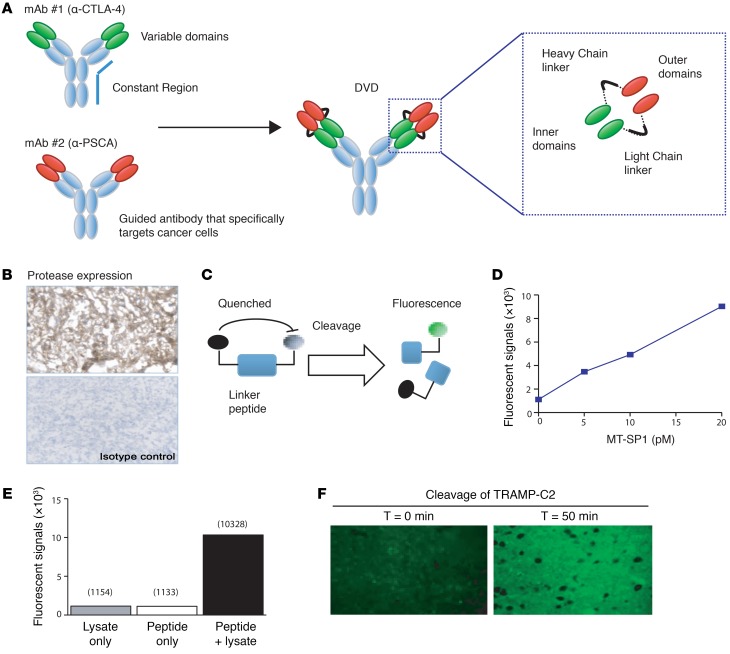
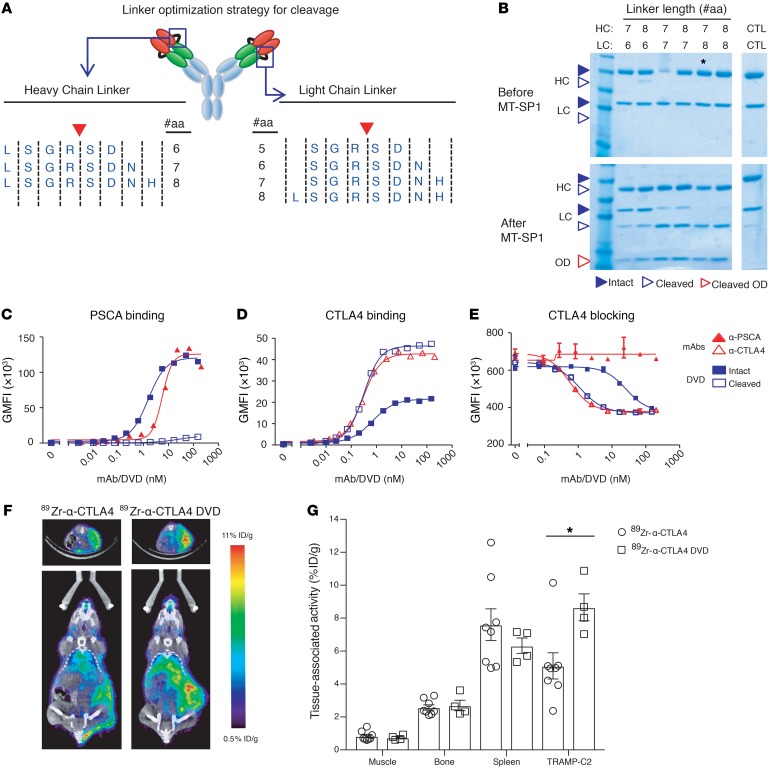
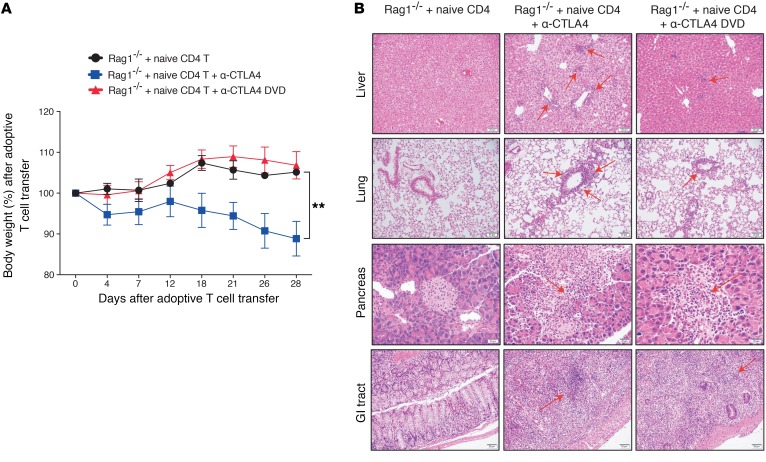
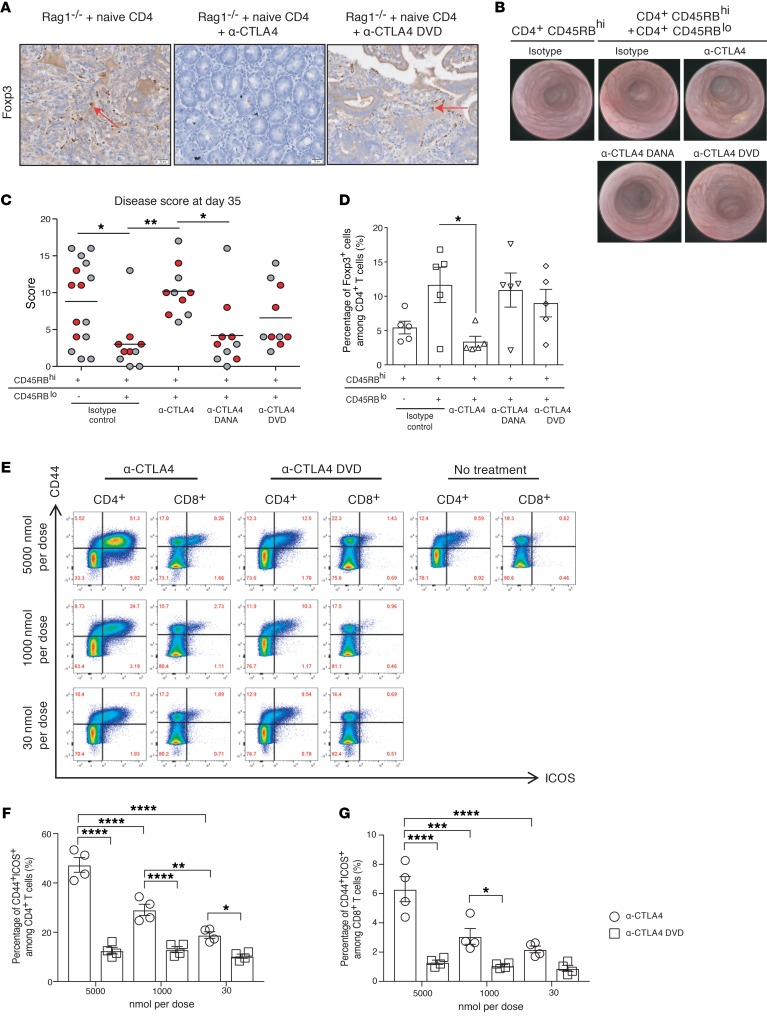
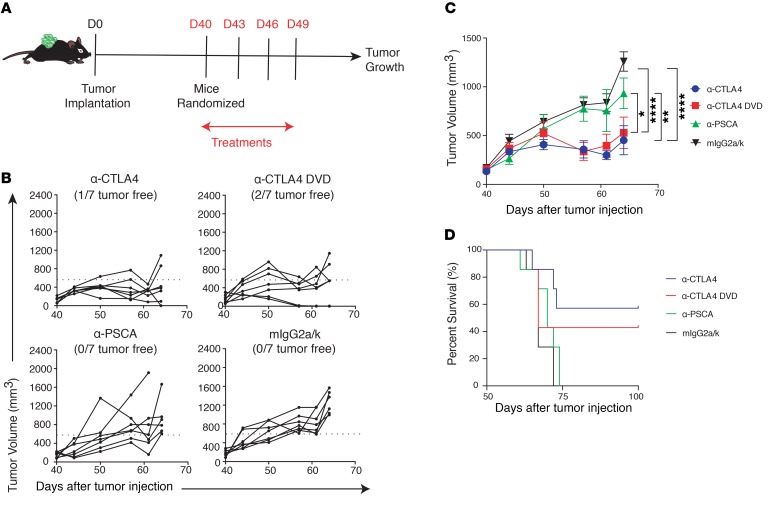
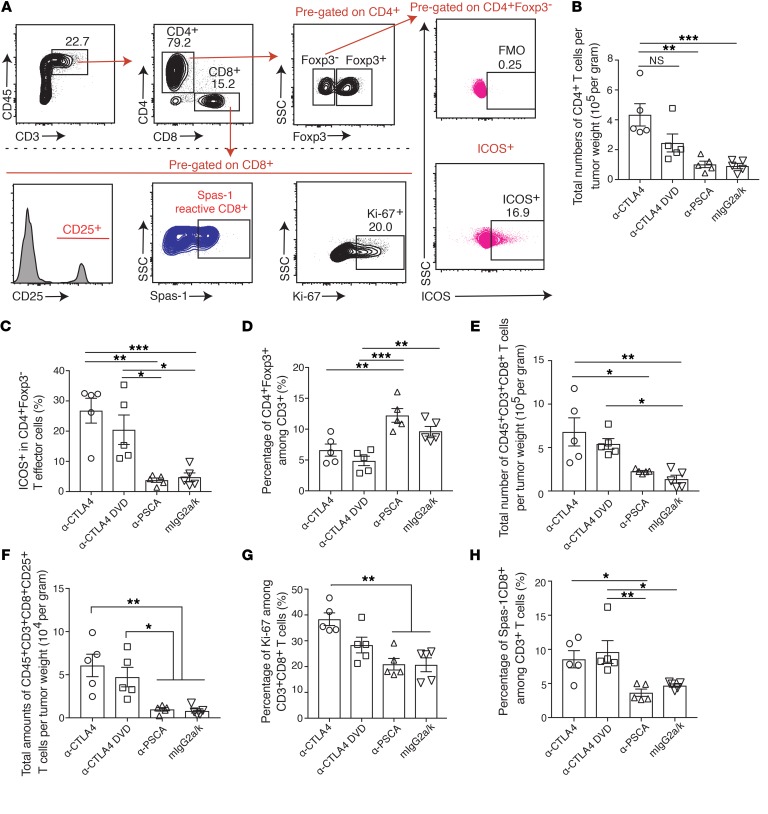
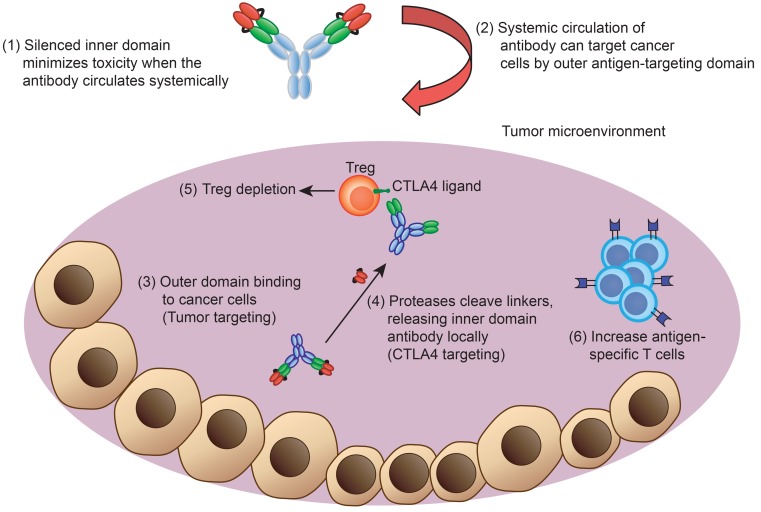
While immune checkpoint blockade leads to potent antitumor efficacy, it also leads to immune-related adverse events in cancer patients. These toxicities stem from systemic immune activation resulting in inflammation of multiple organs, including the gastrointestinal tract, lung, and endocrine organs. We developed a dual variable domain immunoglobulin of anti-CTLA4 antibody (anti-CTLA4 DVD, where CTLA4 is defined as cytotoxic T lymphocyte-associated antigen-4) possessing an outer tumor-specific antigen-binding site engineered to shield the inner anti-CTLA4-binding domain. Upon reaching the tumor, the outer domain was cleaved by membrane type-serine protease 1 (MT-SP1) present in the tumor microenvironment, leading to enhanced localization of CTLA4 blockade. Anti-CTLA4 DVD markedly reduced multiorgan immune toxicity by preserving tissue-resident Tregs in Rag 1-/- mice that received naive donor CD4+ T cells from WT C57BL/6j mice. Moreover, anti-CTLA4 DVD induced potent antitumor effects by decreasing tumor-infiltrating Tregs and increasing the infiltration of antigen-specific CD8+ T lymphocytes in TRAMP-C2-bearing C57BL/6j mice. Treg depletion was mediated through the antibody-dependent cellular cytotoxicity (ADCC) mechanism, as anti-CTLA4 without the FcγR-binding portion (anti-CTLA4 DANA) spared Tregs, preventing treatment-induced toxicities. In summary, our results demonstrate an approach to anti-CTLA4 blockade that depletes tumor-infiltrating, but not tissue-resident, Tregs, preserving antitumor effects while minimizing toxicity. Thus, our tumor-conditional anti-CTLA4 DVD provides an avenue for uncoupling antitumor efficacy from immunotherapy-induced toxicities.

Keywords: Cancer immunotherapy; Immunology; Oncology.


Conflict of interest statement

Conflict of interest: LF received research funding from AbbVie, Merck, Roche-Genentech, and Bristol-Myers Squibb Inc. DMS, XL, SW, CB, D Banach, D Bowley, FD, JS, WR, PLR, SM, GL, and PB are research scientists at AbbVie Bioresearch Center. DMS, JM, and GK are former research scientists at AbbVie Bioresearch Center.

Figures

Figure 1
Figure 1. Anti-CTLA4–mediated immune-related toxicities in a murine model.
Eight- to ten-week-old male Rag 1–/– mice (on C57BL/6j background) were adoptively transferred with purified CD4+CD25CD45RBhi cells from WT mice. (A) Sorting strategy. (B) Body weight loss over time after treatment. (C) Different organs were harvested at day 45, and pathological changes were examined using H&E staining under a microscope. Arrows indicate lymphocytic infiltration and pathological changes. (DF) Target organ pathological scores were evaluated by a board-certified pathologist in a single-blind fashion. (G) Splenocytes were harvested at day 45 from different treatment groups, and CD4+ T cells were examined for TNF-α secretion by flow cytometry. (H) Percentage of TNF-α+CD4+ T cells among CD45+ cells. Experiments were conducted twice, and data were shown with 5 mice per group. Three mice from the Rag1–/– only group were used as negative control. For the TNF-α experiment, data were collected from 3 mice per group. Bars represent mean ± SEM. *P < 0.05; **P < 0.01; ****P < 0.0001, 1-way ANOVA or 2-way ANOVA with post hoc Tukey’s test.
Figure 2
Figure 2. Engineered CTLA4 blockade with bispecific DVD Ig design.
(A) Diagram illustrating DVD technology. The anti-CTLA4 DVD is composed of 1 outer domain (antigen-specific binding site) and 1 inner domain (CTLA4-binding site). The outer domain and inner domain are connected by cleavable linkers. (B) Immunohistochemistry of MT-SP1 expression in a TRAMP-C2 tumor section. Original magnification: ×200. (C) Illustration of the fluorescent peptide probes used to evaluate the cleavage of linker peptides. (D) Fluorescent peptide probes containing the conditional DVD cleavable linker sequence were incubated with recombinant MT-SP1 to demonstrate cleavage under different concentrations. Cleavage was also achieved through cocultures of probes with TRAMP-C2 tumor lysate (E) and in tumor sections (F). Representative figures from each in vitro experiment are shown. Each in vitro experiment was conducted 3 times independently. Original magnification: ×400.
Figure 3
Figure 3. Protease-cleavable linkers can act as a switch to convert the specificity of a DVD from a tumor antigen to a therapeutic target.
A panel of DVDs was made to identify the optimal linker for conditional activation. All DVDs had identical ODs (anti-PSCA) and IDs (anti-CTLA4), but used different linkers. (A) Schematic showing the linker sequences used to optimize cleavage by MT-SP1. (B) Reducing SDS-PAGE of DVDs before and after incubation with MT-SP1. CTL indicates DVD made with linkers lacking the MT-SP1 cleavage site (LSGSDN/SGSDN). Asterisk indicates candidate DVD (5037) with optimal linker lengths that was advanced for further testing. (C and D) After incubation with MT-SP1, intact DVDs or cleaved DVDs were incubated with HEK293 cells overexpressing PSCA (C) or CTLA4 (D) and specific bindings were detected by secondary labeling and FACS. (E) Intact or cleaved DVDs were incubated with HEK293 cells overexpressing CTLA4 in the presence of CD86, and specific binding of CD86 to the cells was detected by flow cytometry. Each in vitro experiment was conducted 3 times independently. A representative figure from each in vitro experiment is shown. (F) Mice were implanted with s.c. TRAMP-C2 tumors and injected with either anti-CTLA4 or anti-CTLA4 DVD. The representative figure from each treatment arm demonstrates the biodistribution of anti-CTLA4 and anti-CTLA4 DVD at 48 hours by PET/CT. The upper portion is the transverse plane of the CT scan. The highlight portion is the tumor. The lower panel is the coronal plane of the CT scan. (G) Quantification of PET/CT tissue distribution of anti-CTLA4 and anti-CTLA4 DVD at 48 hours. Data were conducted with 2 independent experiments. Each treatment arm was collected from 8 mice per group for the anti-CTLA4–treated group and 4 mice per group for the anti-CTLA4 DVD–treated group. Bars represent mean ± SEM. *P < 0.05, 2 tailed Student’s t test.
Figure 4
Figure 4. Anti-CTLA4 DVD reduced treatment-associated toxicity in mice.
Eight- to ten-week-old male Rag1–/– mice (on a C57BL/6j background) were adoptively transferred with purified CD4+CD25CD45RBhi cells from WT mice. Recipient mice were then treated with either anti-CTLA4, anti-CTLA4 DVD, or isotype control. (A) Percentage of body weight lost among different treatment groups. (B) Mice were harvested at day 28, and multiorgan pathology was examined among different treatment groups. Arrows represent lymphocytic infiltration in the tissues. Experiments were conducted twice, and data shown are from 5 mice per group. Bars represent mean ± SEM. **P < 0.01, 2-way ANOVA with post hoc Tukey’s test.
Figure 5
Figure 5. Colitis induction following treatment with anti-CTLA4, but not with anti-CTLA4 DVD.
(A) Foxp3 IHC staining was performed on GI tract tissue sections from mice receiving different Abs. Arrows indicate Foxp3+ cells. Experiments were conducted twice with 6 mice per group, and the representative figure from each treatment arm was shown. (BD) Recipient C.B17 SCID mice were i.p. injected with 5 × 10⁵ purified CD4+CD45RBhi cells with or without 2.5 × 10⁵ CD4+CD45RBlo cells, and administered the indicated treatments at 200 μg per dose twice per week for 3 weeks. At day 35, all mice were evaluated by endoscopy and scored for colitis. Data were collected from 1 experiment with 10–15 mice per treatment arm. (B) Representative endoscopy images of a single mouse from each group. (C) Graphic representation of endoscopy scores at day 35. Red dots indicate animals from which colons were further analyzed for percentage of Foxp3+ cells among CD4+ cells in D. (EG) Healthy C57BL/6j mice were injected with either anti-CTLA4 or anti-CTLA4 DVD. (E) Flow-gating strategy of spleen samples. (F) Percentage of CD44+ICOS+ in CD4+ T cell subsets. (G) Percentage of CD44+ICOS+ in CD8+ T cell subsets. For parts EG, experiments were conducted twice, and the representative data from 1 experiment was from 4 mice per group. Bars represent mean or mean ± SEM. *P < 0.05; **P < 0.01; ***P < 0.001; ****P < 0.0001, 1-way ANOVA with post hoc Tukey’s test.
Figure 6
Figure 6. Anti-CTLA4 DVD preserves antitumor activity.
(A) C57BL/6j male mice were implanted with TRAMP-C2 tumors at day 0 (D0), and tumors were allowed to grow for 40 days. Mice were randomized into different treatment groups before Ab injection and then received different treatments at days 40, 43, 46, and 49. (B and C) Tumor growth from different treatment groups over time. (D) Survival curve of different treatment groups. Data were conducted with 2 independent experiments. Each treatment arm was collected from 7 mice per group. Bars represent mean ± SEM. *P < 0.05; **P < 0.01; ****P < 0.0001, 2-way ANOVA with post hoc Tukey’s test.
Figure 7
Figure 7. Immune landscape within tumors after different CTLA4 blockades.
C57BL/6j male mice were implanted with TRAMP-C2 tumors at day 0, and tumors were allowed to grow for 40 days. Mice were randomized into different treatment groups and received different treatments at days 40, 43, 46, and 49. Tissues were harvested at day 52 and analyzed by flow cytometry. (A) Tumors were harvested from each treatment group and analyzed for different immune subsets by flow cytometry. (B) Total numbers of CD4+ T cells per tumor weight. CD4+ T cells were pregated on live CD45+CD3+CD8 T cells. (C) Percentage of ICOS expression among CD4+Foxp3 T cells. (D) Percentage of CD4+Foxp3+ among CD3+ cells. (E) Total number of infiltrating CD8+ T cells per tumor weight. (F) Total numbers of CD8+CD25+ T cells per tumor weight. (G) Percentage of Ki-67 among CD3+CD8+ T cells. (H) Percentage of Spas-1–reactive CD8+ T cells among CD3+ cells. Two independent experiments were conducted. Data were shown as 5 mice per group from 1 representative experiment. Bars represent mean ± SEM. *P < 0.05; **P < 0.01; ***P < 0.001, 1-way ANOVA with post hoc Tukey’s test.
Figure 8
Figure 8. Diagram of engineered anti-CTLA4 DVD blockade in vivo.
The engineered Ab consists of an outer domain and an inner domain. During systemic circulation, the CTLA4-binding site is shielded by the outer PSCA-binding domain. The anti-PSCA can then guide the Ab and accumulate into the tumor microenvironment, where the protease can cleave the linker and expose the inner CTLA4-binding site. The anti-CTLA4 DVD can then deplete Treg cells and activate effector T cells within tumors to achieve antitumor activities.

Comment in

References

    1. Grosso JF, Jure-Kunkel MN. CTLA-4 blockade in tumor models: an overview of preclinical and translational research. Cancer Immun. 2013;13:5. - PMC - PubMed
    1. Curran MA, Montalvo W, Yagita H, Allison JP. PD-1 and CTLA-4 combination blockade expands infiltrating T cells and reduces regulatory T and myeloid cells within B16 melanoma tumors. Proc Natl Acad Sci U S A. 2010;107(9):4275–4280. doi: 10.1073/pnas.0915174107. - DOI - PMC - PubMed
    1. Larkin J, Hodi FS, Wolchok JD. Combined nivolumab and ipilimumab or monotherapy in untreated melanoma. N Engl J Med. 2015;373(13):1270–1271. doi: 10.1056/NEJMc1509660. - DOI - PubMed
    1. Brahmer JR, et al. Management of immune-related adverse events in patients treated with immune checkpoint inhibitor therapy: American Society of Clinical Oncology Clinical Practice Guideline. J Clin Oncol. 2018;36(17):1714–1768. doi: 10.1200/JCO.2017.77.6385. - DOI - PMC - PubMed
    1. Wolchok JD, et al. Overall survival with combined nivolumab and ipilimumab in advanced melanoma. N Engl J Med. 2017;377(14):1345–1356. doi: 10.1056/NEJMoa1709684. - DOI - PMC - PubMed

Publication types

MeSH terms