. 2018 Dec;15(4):306-322.
doi: 10.14245/ns.1836206.103. Epub 2018 Nov 19.

Review of Photoacoustic Imaging for Imaging-Guided Spinal Surgery

Affiliations

Review of Photoacoustic Imaging for Imaging-Guided Spinal Surgery

Seung Hee Han. Neurospine. 2018 Dec.

Abstract

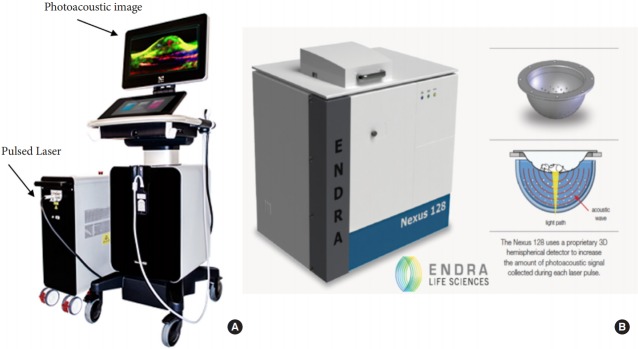
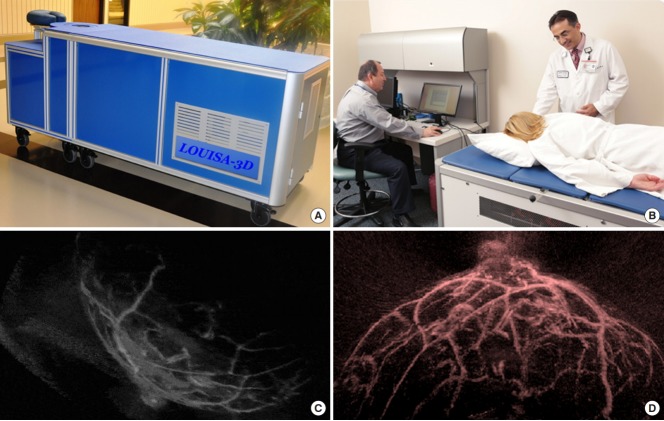
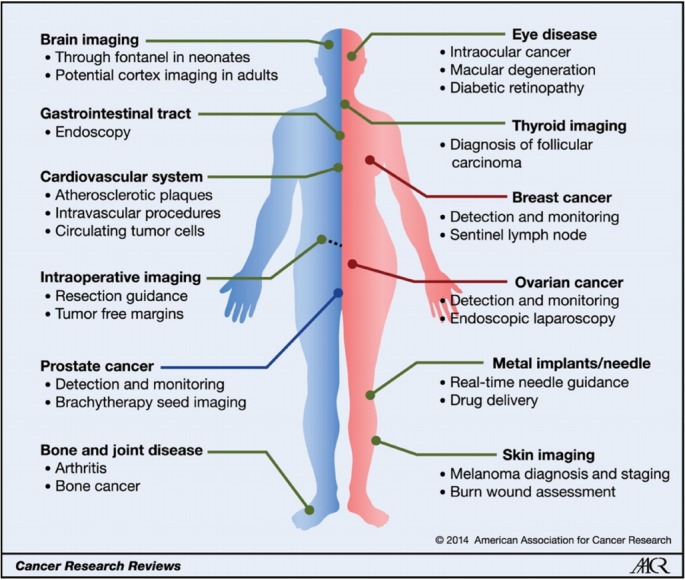
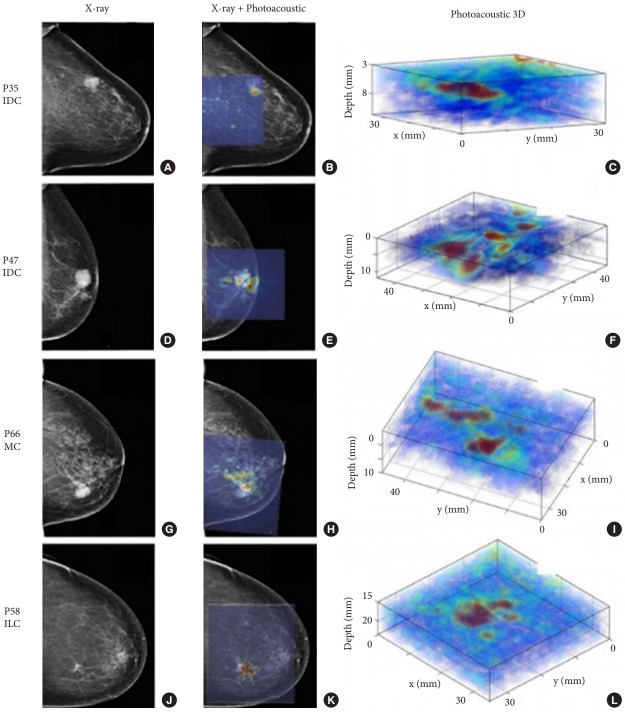
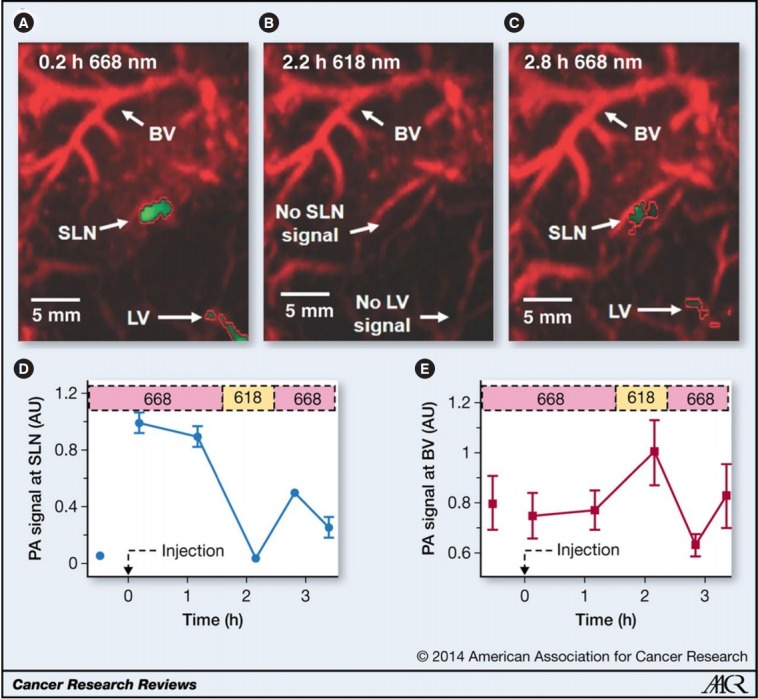
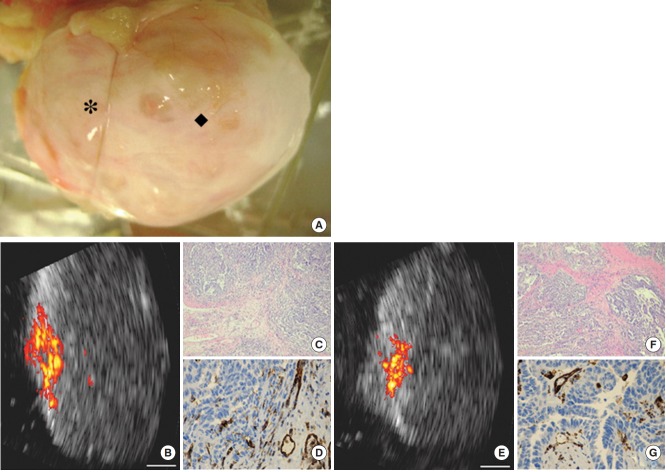
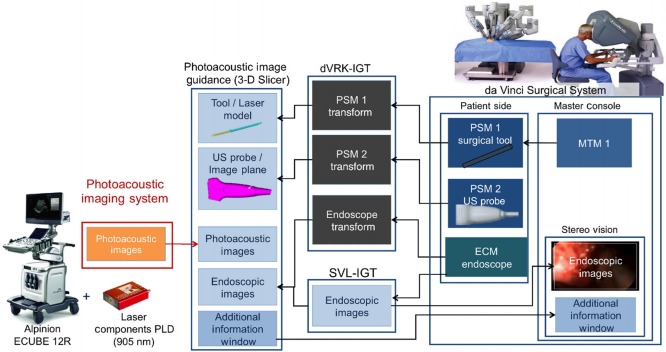
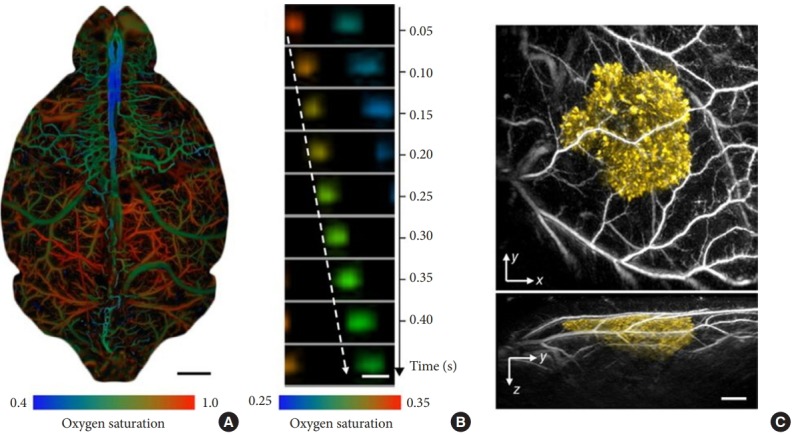
This review introduces the current technique of photoacoustic imaging as it is applied in imaging-guided surgery (IGS), which provides the surgeon with image visualization and analysis capabilities during surgery. Numerous imaging techniques have been developed to help surgeons perform complex operations more safely and quickly. Although surgeons typically use these kinds of images to visualize targets hidden by bone and other tissues, it is nonetheless more difficult to perform surgery with static reference images (e.g., computed tomography scans and magnetic resonance images) of internal structures. Photoacoustic imaging could enable real-time visualization of regions of interest during surgery. Several researchers have shown that photoacoustic imaging has potential for the noninvasive diagnosis of various types of tissues, including bone. Previous studies of the surgical application of photoacoustic imaging have focused on cancer surgery, but photoacoustic imaging has also recently attracted interest for spinal surgery, because it could be useful for avoiding pedicle breaches and for choosing an appropriate starting point before drilling or pedicle probe insertion. This review describes the current instruments and clinical applications of photoacoustic imaging. Its primary objective is to provide a comprehensive overview of photoacoustic IGS in spinal surgery.

Keywords: Imaging-guided surgery; Minimally surgery; Photoacoustic imaging; Robot surgery; Spinal surgery.


Conflict of interest statement

The author has nothing to disclose.

Figures

Fig. 1.
Fig. 1.
The history of photoacoustic imaging. Several decades passed from Bell’s first description of the photoacoustic effect to the development of clinical applications. PA, photoacoustic; PAI, photoacoustic imaging.
Fig. 2.
Fig. 2.
The basic principle of photoacoustic imaging. When a tissue is exposed to pulsed near-infrared laser light, the constituents of the tissue (e.g., water, lipids, collagen, hemoglobin, etc.) absorb light and undergo thermoelastic expansion, thereby causing ultrasound signals to emanate (the photoacoustic effect). Therefore, these laser-induced ultrasound signals (photoacoustic signals) can be detected using an ultrasound transducer, making photoacoustic (or optoacoustic) imaging possible. Each of these biological absorbers can be targeted by irradiating tissue at the corresponding dominant absorption wavelength. As such, using a tunable laser at the relevant wavelengths of interest enables the acquisition of multiple photoacoustic images that can be spectrally resolved for tissue composition to be assessed based on endogenous contrast. PA, photoacoustic.
Fig. 3.
Fig. 3.
Photoacoustic imaging configurations. The detectors and the laser source may be on the same side or at an angle to each other. (A) Photoacoustic imaging performed using a conventional ultrasound transducer, in which only part of the spherical wave front originating from the target is registered by the transducer. (B) Photoacoustic tomography showing X-ray computed tomography–like reconstruction, in which a single detector can be rotated around the target or an array of multiple stationary detector elements can be deployed around the target. The signal arriving at each detector is filtered, back-projected along circular arcs in the spatial domain, and all the back-projections are then added together to obtain the final photoacoustic image, which represents the spatial distribution of optical absorption within the target.
Fig. 4.
Fig. 4.
Schematic of photoacoustic imaging instrumentation. When a tissue is exposed to pulsed near-infrared laser light, the transient pressure readings produced from tissue chromophores are collected by an ultrasound transducer scanned over the surface. An internal clock synchronizes the transducer acquisition time to laser firing. The transient pressure gradients are converted by the transducer to time-dependent voltage signals (photoacoustic signals) and are fed into a front-end acquisition module where the signals are channeled through a low-noise preamplifier (20–30 dB), followed by a variable gain amplifier (20–50 dB) to achieve a cumulative gain (40–80 dB). The amplified signals are filtered for high-frequency noise components and digitized using analog-to-digital converters. These digitized signals are further handled by a back-end processing module, which performs a multitude of signal processing and image reconstruction tasks, after which the images are appropriately stored and displayed.
Fig. 5.
Fig. 5.
Two commercially available preclinical photoacoustic imaging systems. (A) The Vevo LAZR-X (VisualSonics, Toronto, ON, Canada) uses intersecting planar laser beams (laser: 680–970 nm and 1,200–2,000 nm). (B) The Nexus 128 (Endra Life Sciences, Ann Arbor, MI, USA) delivers diffuse laser light and detects ultrasound waves using 128 transducers in a helical arrangement for 3-dimensional reconstruction.
Fig. 6.
Fig. 6.
Clinical photoacoustic imaging systems. (A) LOUISA-3D Photoacoustic Imaging System (TomoWave Lab Inc., Houston, TX, USA). (B) Clinical applications of LOUISA-3D for Breast Imaging. Panels C and D show examples of noninvasive clinical breast imaging with 3-dimensional volumetric images of the breast, along with 2-dimensional ultrasonic images for image coregistration the using LOUISA-3D.
Fig. 7.
Fig. 7.
Overview of the potential clinical applications of photoacoustic imaging. Overview of potential clinical applications of photoacoustic imaging. The main possible applications for each organ system are listed. Some of these applications are male-specific (left, blue line), and some are female-specific (right, red line)[51]
Fig. 8.
Fig. 8.
Breast imaging with photoacoustic mammoscope. Photoacoustic images were overlaid on X-ray mammograms to show lesions detected on both modalities. Reconstructed 3-dimensional (3D) photoacoustic volume encompassing each lesion of interest is also shown here. Infiltrating ductal carcinoma (IDC) lesion was seen on X-ray and photoacoustic imaging in a 79-yearold patient (A-C) and a 69-year-old patient (D-F), respectively. Mucinous carcinoma (MC) was detected in an 83-year-old patient (G-I) while infiltrating lobular carcinoma (ILC) was seen in a 65-year-old patient (J-L). The lesions were co-localized on photoacoustic images with respect to X-ray mammograms and were visualized at depths of more than 20 mm with good contrast on photoacoustic images. PXX indicates patient-identifier in the study. Reproduced from Heijblom et al[11]. Eur Radiol 2016;26:3874-87, according to the Open Access.
Fig. 9.
Fig. 9.
Photoacoustic images of sentinel lymph node (SLN) in a rat in vivo after indocyanine green (ICG) injection. (A) Image at 668 nm 0.2 hours after ICG injection. (B) Image at 618 nm 2.2 hours after injection. (C) Image at 668 nm 2.8 hours after injection. (D) Graph shows comparison of spectroscopic photoacoustic signals within the SLN region over a period of time. (E) Graph shows comparison of spectroscopic photoacoustic signals within blood vessels (BVs) over a period of time. LV, lymphatic vessel. Numbers in colored bar at top of panels D and E equal wavelength in nanometers. Reprinted from Kim et al[15]. Radiology 2010;255:442-50, with permission of The Radiological Society of North America.
Fig. 10.
Fig. 10.
Photoacoustic imaging of surgical ovarian specimen. Photoacoustic imaging of surgical ovarian specimen from a 58-year-old postmenopausal patient with bilateral ovarian cancers at stage IIIC. (A) Malignant ovary imaged at 2 locations (* and ◆). (B) Coregistered US and photoacoustic image of location *. (E) Coregistered US and photoacoustic image of location ◆. Highly vascularized intraepithelial areas compared with the surrounding tissue are observed on photoacoustic images of both locations. (C, F) Hematoxylin-eosin stained images (× 40) of the corresponding areas show extensive highgrade tumors. (D, G) CD31-stained images (×100) of the corresponding areas show extensive thin-walled micro vessels. White bar= 5 mm. Reprinted from Aguirre et al[23] Transl Oncol 2011;4:29-37, with figure citation to the Neoplasia Press, Inc.
Fig. 11.
Fig. 11.
Integrated system architecture with photoacoustic imaging and robotic surgery system. Photoacoustic images are generated and sent to the photoacoustic image guidance module (via a 3-D slicer plug-in) for visualization, along with live stereo endoscope video (via SVL-IGT) and models of the drill, laser, and ultrasound probe that are positioned based on kinematic position feedback from the da Vinci patient-side manipulators (via dVRK-IGT). Visualizations from the 3-D Slicer are sent to the da Vinci stereo viewer. SVL, cisst Stereo Vision Library27; dVRK, da Vinci Research Kit;[31] PLD, pulsed laser diode; 3-D, three-dimensional; IGT, image-guided therapy; PSM, patient side manipulators; ECM, endoscopic camera manipulator; MTM, master tool manipulator.
Fig. 12.
Fig. 12.
Representative in vivo photoacoustic tomography applications in life sciences. (A) Whole-cortex optical-resolution photoacoustic microscopy (OR-PAM) image of the oxygen saturation of hemoglobin in a mouse brain[52]. The arteries (shown in red) and veins (shown in blue/green) are clearly differentiated by their oxygenation levels. Blue indicates low oxygenation. Scale bar, 1 mm. (B) Sequential label-free OR-PAM images of oxygen releasing in single red blood cells (RBCs) flowing in a capillary in a mouse brain[53] Scale bar, 10 μm. Blood flows from left to right. The dashed arrow follows the trajectory of a single flowing RBC. (C) Photoacoustic computed tomography images of a tyrosinase-expressing K562 tumor (shown in yellow) after subcutaneous injection into the flank of a nude mouse[54] The surrounding blood vessels are shown in gray. Top, x-y projection image; bottom, y-z projection image. Scale bar, 1 mm.
Fig. 13.
Fig. 13.
A probe that houses both a small diode laser together with ultrasound transducers. The photoacoustic imaging/ultrasound probe (A) with a view of the front end showing the light delivery window (dark aperture) and acoustic lens in medium gray. The patient’s hand is submerged in water (B) where it rests on a series of supports. The probe is mounted on a 2-axis motorized stage and positioned above the joint.
Fig. 14.
Fig. 14.
Examples of fluence-corrected photoacoustic imaging/ultrasound and US-PD images for an inflamed joint and the contra-lateral noninflamed joint. Photoacoustic imaging/ultrasound and US/PD images of an inflamed (upper row) and noninflamed contralateral joint (bottom row) of a rheumatoid arthritis (RA) patient. The photoacoustic imaging/ultrasound images in panel A show a difference in color between the inflamed and noninflamed joints corresponding to an increase in amplitude levels. When discarding the low photoacoustic amplitudes in panel B, only features in the inflamed joint are visible. The corresponding US-PD images are shown in panel C. The blue line in the PA/US images indicates the region of interest used for quantification of photoacoustic imaging features in the synovial space. The 0-dB level is the maximum photoacoustic imaging amplitude from the inflamed joint. US-PD, ultrasound power doppler; PA/US, photoacoustic/ultrasound; d, dermis; dv, dorsal vein; pp, proximal phalanx; pip, proximal interphalangeal joint; mp, middle phalanx; s, synovium; t, extensor tendon.
Fig. 15.
Fig. 15.
Photoacoustic imaging of a human vertebra: implications for guiding spinal fusion surgery. (A) Photograph annotated with the location of fiber-probe pair for contrast and signal-to-noise ratio (SNR) measurements. (B) Examples of photoacoustic images and fixed region of interest locations for contrast and SNR measurements, acquired with 200 mJ cm−2 laser fluence. (C) Contrast and SNR as a function of laser fluence. Plots show mean ± standard deviation values for 15 measurements.
Fig. 16.
Fig. 16.
Differences in signal contrast and the signal-to-noise ratio (SNR) as a function of distance from the cortical region. (A) Photograph annotated with the scanning direction of the fiber-probe pair. Contrast (B) and SNR (C) as a function of the position of the optical fiber, which was attached to the phased-array ultrasound probe. Plots show mean ± standard deviation values for 15 measurements.

References

    1. Jolesz FA. Definition of image guided therapy. In: Jolesz FA, editor. Intraopeative imaging and image-guided therapy. New York: Springer; 2014. pp. 1–23.
    1. Design of a multifiber light delivery system for photoacoustic-guided surgery. J Biomed Opt. 2017;22:41011. - PMC - PubMed
    1. Bell AG. On the production and reproduction of sound by light. Am J Sci. 1880;20:305–24.
    1. Wang LV. Tutorial on photoacoustic microscopy and computed tomography. IEEE J Sel Top Quantum Electron. 2008;14:171–9.
    1. Beard P. Biomedical photoacoustic imaging. Interface Focus. 2011;1:602–31. - PMC - PubMed

LinkOut - more resources