. 2018 Dec 7;9(1):5247.
doi: 10.1038/s41467-018-07668-y.

A machine learning approach for online automated optimization of super-resolution optical microscopy

Affiliations

A machine learning approach for online automated optimization of super-resolution optical microscopy

Audrey Durand et al. Nat Commun. .

Abstract

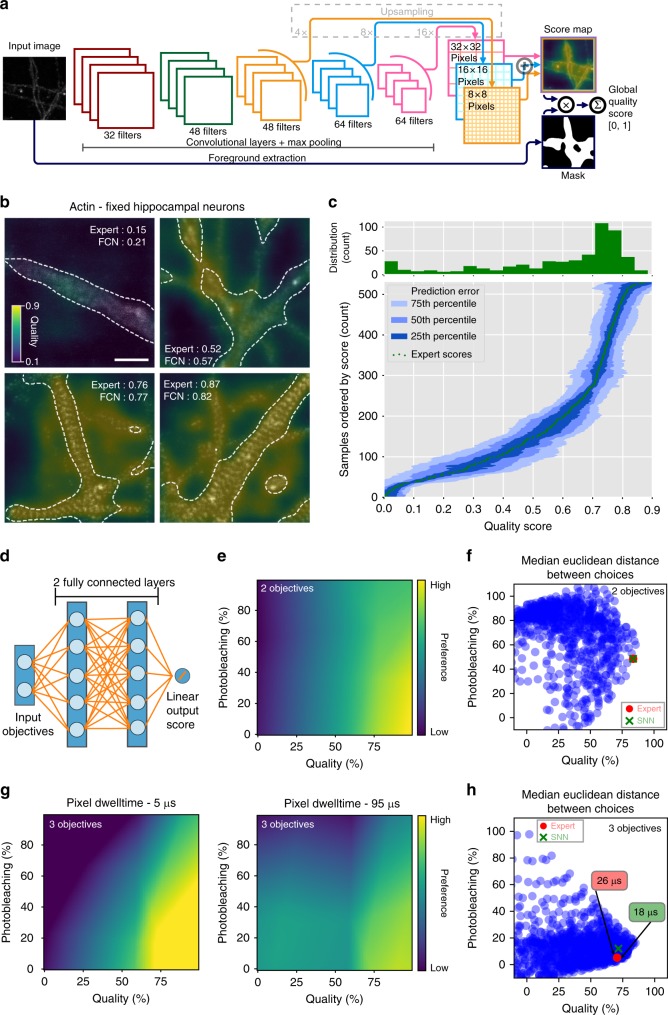
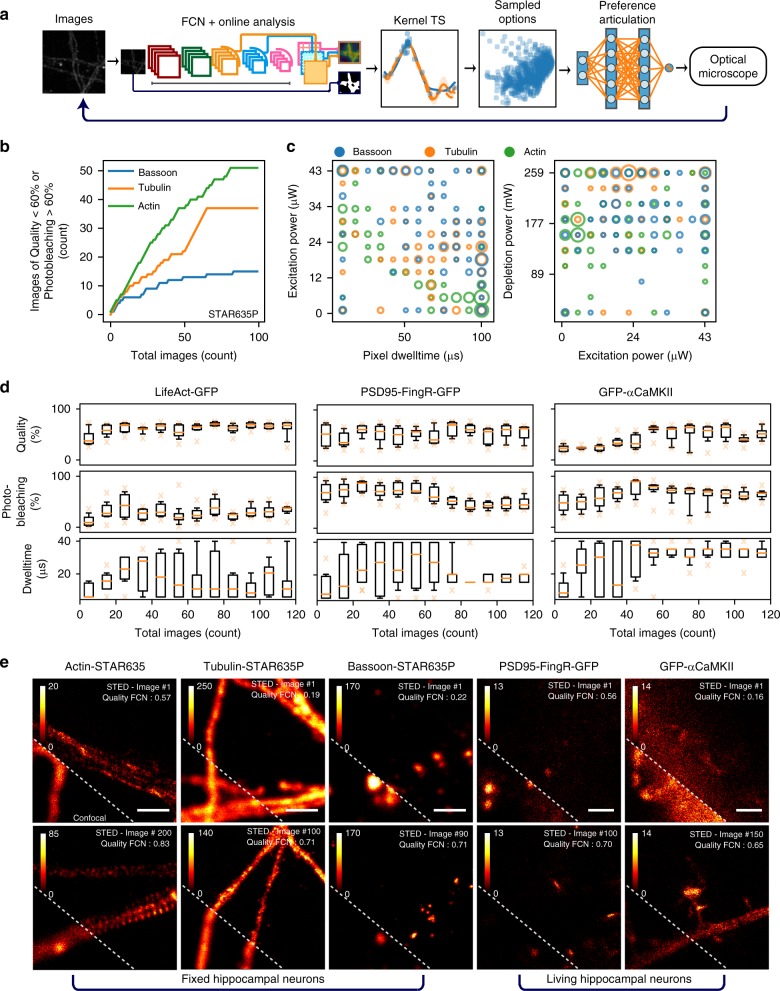
Traditional approaches for finding well-performing parameterizations of complex imaging systems, such as super-resolution microscopes rely on an extensive exploration phase over the illumination and acquisition settings, prior to the imaging task. This strategy suffers from several issues: it requires a large amount of parameter configurations to be evaluated, it leads to discrepancies between well-performing parameters in the exploration phase and imaging task, and it results in a waste of time and resources given that optimization and final imaging tasks are conducted separately. Here we show that a fully automated, machine learning-based system can conduct imaging parameter optimization toward a trade-off between several objectives, simultaneously to the imaging task. Its potential is highlighted on various imaging tasks, such as live-cell and multicolor imaging and multimodal optimization. This online optimization routine can be integrated to various imaging systems to increase accessibility, optimize performance and improve overall imaging quality.


Conflict of interest statement

The authors declare no competing interests.

Figures

Fig. 1
Fig. 1
Replay experiment of single-objective optimization. a Selected images of actin, labeled with phalloidin-STAR635 in fixed cultured hippocampal neurons, from the first ten images of the dataset at four increasing laser power values. Scale bars 1 μm. White arrowheads: actin periodical lattice. b Comparison between the quality scores, SNR, autocorrelation of the periodical actin lattice, and FRC measurements obtained for the images shown in a and acquired at the indicated excitation power. c, g Autocorrelation (c) and image quality (g) values measured for all images of the dataset (blue dots) and average of the 39 autocorrelation (c) or quality (g) values per excitation power (orange line). d, h Distribution of the selected excitation power for 60 images obtained in one replay trial for both GS and Kernel TS when evaluating the autocorrelation (d) or the image quality (h). The black line indicates the averaged functions (orange line in c and g) for autocorrelation and for image quality. e, i Average cumulative regret of imaging failures (not detecting the actin periodical lattice) when optimizing the autocorrelation (e) or image quality (i). Note that the wave pattern is due to the decreasing probability of obtaining good images as parameters move further away from the relevant region. f, j Error between the estimated and ground truth autocorrelation (f) or image quality (j) values at the excitation power that was most often selected by Kernel TS for each optimization trial. g, h Quality scores from 0 to 1 are expressed in percentage
Fig. 2
Fig. 2
Multi-objective optimization of STED imaging on fixed and live neurons. a Evolution of the objectives during an optimization sequence, from first (cyan) to 100th image (pink), for the protein α-tubulin marked with ATTO647, STAR RED, and Alexa633. b Cumulative regret (related to the quantity of low-quality images, i.e. below 70%) obtained during the Kernel TS optimization sequences shown in a. c Parameter configurations selected by Kernel TS for fluorophores shown in a. d Example images of αCaMKII tagged with SNAP-SiR of the first five (1–5) and last five (76–80) images taken during one live-cell optimization trial. White and green arrowheads highlight the position of dendritic spines and shafts respectively. Scale bars 500 nm. e Distribution of image quality and photobleaching for one optimization sequence of αCaMKII-SNAP-SiR (Trial 2 in panel f). One bin corresponding to the average of ten images. Orange line indicates the median, box covers the first to the third quartiles, and whiskers extend from 10th to 90th percentiles. f Parameter configurations selected by Kernel TS during different live-cell imaging trials. In c and f the size of the circles scales with the number of images that were acquired with a given configuration. Shown are two planes of the three-dimensional parameter space. Quality scores from 0 to 1 are expressed in percentage
Fig. 3
Fig. 3
Multi-objective live-cell optimization of GFP imaging. a Parameter configurations selected by Kernel TS during different imaging trials in three different cell types: neurons (green), PC12 (blue), and HEK293 (orange). b Cumulative regret curve of (left) image quality alone (images with a quality score below 60%) and (right) image quality and photobleaching (images with a quality score below 60% or photobleaching above 75%). c Example images obtained among the last ten images of one optimization sequence for each cell type. The confocal image was taken before two consecutive STED images (labeled as STED-1 and STED-2). Note the differences in intensity scales across images to reflect differences in fluorescence intensity (confocal images) or photobleaching (STED1 vs. STED2). Scale bar 1 μm
Fig. 4
Fig. 4
Multimodal optimization in living cells. a GCaMP6s fluorescence before and after glutamate uncaging. b Change in Ca2+ concentration inside the ROIs in spine (cyan rectangle in a) and dendrite (orange rectangle in a). Ca2+ response was limited to the spine. c GFP-GluN2B tagged with FluoTag-X4 anti-GFP STAR635P before and after uncaging (zoomed inset from the dotted box in a). Scale bars 500 nm. d Objective functions, i.e. ΔF/F peak intensity (left) and response size ratio (right), predicted by kernel regression after 80 observations. The colorbar indicates the predicted value for this objective, in the objective units. e Types of Ca2+ responses after glutamate uncaging for the selected parameters during one optimization (left) and random sampling (right) trials. Pie charts show the repartition between response types, i.e. local (green), widespread (orange) and no response above threshold (red). The size of each pie chart is proportional to the number of trials of the parameter configuration. f Relative frequency of local response ratios over all images obtained in several trials of 80-image sequences, for different response size ratio threshold values. 95% confidence intervals are obtained by 1000 bootstrap repetitions. g Comparison of the success rate of multimodal experiments using RS and Kernel TS for the images 1–20 and 60–80. Vertical bars indicate one standard deviation computed over the N repetitions. With Kernel TS, a significant increase in the frequency of local responses and decrease in the no-response rate are observed between the first and the last images (Kruskal−Wallis, p = 0.01 and p = 0.004 respectively), with RS no significant difference in the frequency of local response and no-response rate was observed between the first and the last images (Kruskal−Wallis, p = 0.45 and p = 0.57 respectively). e, g The threshold for the response size ratio was set to 0.6
Fig. 5
Fig. 5
Automatic image quality rating with an FCN and automatic preference articulation with an SNN. a Proposed FCN architecture for quality rating. Each convolutional layer is followed by spatial batch normalization and an exponential linear unit (ELU) activation. All layers but the last one are also followed by maxpooling with kernel 2 × 2. The output is a linear combination of the three last layers, allowing to handle different sizes of features in the image (see Methods). b Example of score maps produced by the FCN for images of the actin cytoskeleton stained with phalloidin-STAR635. Scale bar 1 μm. c Distribution of qualities in the validation sets (top histograms) and error distributions of an FCN trained on the Actin dataset, on test images of the actin cytoskeleton stained with phalloidin-STAR635. The green dots are the expert scores, sorted by value. The blue areas represent the extent of the errors made by the network at every level of quality. d Architecture of the SNN for preference articulation, given two objectives as input. Each fully connected layer contains ten neurons. e Preference articulation function between photobleaching and image quality learned by the two-objective SNN model. f Example of choices made by the two-objective SNN vs. an expert based on the median error given by Euclidean distance (see Methods). g Preference articulation function between photobleaching, image quality and total imaging time learned by the three-objective SNN model. h Example of choices made by the three-objective SNN vs. an expert based on the median error given by Euclidean distance (see Methods). eh Quality scores from 0 to 1 are expressed in percentage
Fig. 6
Fig. 6
Fully automated optimization system for STED imaging. a Scheme of the fully automated system where both networks interact with Kernel TS to automatically select the next imaging parameters (SNN) and rate the quality of the obtained images (FCN). b Cumulative regret (related to the quantity of low-quality images, i.e. below 60%, or high photobleaching, i.e. over 60%) obtained during FA optimization on fixed neurons stained with phalloidin-STAR635 (actin), bassoon-STAR635P and tubulin-STAR635P. Note: The regret is computed using quality scores given independently by an expert on the resulting images. c Parameter configurations selected by Kernel TS during optimization using Bassoon, Tubulin, and Actin proteins. d Evolution of the objective values during FA optimization sequences of live-cell imaging. Each box corresponds to the binned objective values of ten images. For LifeAct-GFP FA optimization improved the quality while controlling the photobleaching and pixel dwelltime. For PSD95-FingR-GFP it allowed to maintain the quality level while reducing the photobleaching and pixel dwelltime. In the case of GFP-αCaMKII it improved the quality while controlling the photobleaching, at the price of increasing the pixel dwelltime. Quality scores from 0 to 1 are expressed in percentage. e Images acquired without human intervention during FA optimization sequences on fixed and live neurons. The dotted line delimits the confocal (lower left) from the STED (upper right) images. Scale bar 1 μm

References

    1. Huang B, Babcock H, Zhuang X. Breaking the diffraction barrier: super-resolution imaging of cells. Cell. 2010;143:1047–1058. doi: 10.1016/j.cell.2010.12.002. - DOI - PMC - PubMed
    1. Sahl SJ, Hell SW, Jakobs S. Fluorescence nanoscopy in cell biology. Nat. Rev. Mol. Cell Biol. 2017;18:685. doi: 10.1038/nrm.2017.71. - DOI - PubMed
    1. Hell SW, Wichmann J. Breaking the diffraction resolution limit by stimulated emission: stimulated-emission-depletion fluorescence microscopy. Opt. Lett. 1994;19:780–782. doi: 10.1364/OL.19.000780. - DOI - PubMed
    1. Grotjohann T, et al. Diffraction-unlimited all-optical imaging and writing with a photochromic gfp. Nature. 2011;478:204. doi: 10.1038/nature10497. - DOI - PubMed
    1. Lavoie-Cardinal F, et al. Two-color resolft nanoscopy with green and red fluorescent photochromic proteins. Chemphyschem. 2014;15:655–663. doi: 10.1002/cphc.201301016. - DOI - PubMed

Publication types