. 2019 Apr;38(14):2627-2644.
doi: 10.1038/s41388-018-0628-y. Epub 2018 Dec 10.

YAP1-induced MALAT1 promotes epithelial-mesenchymal transition and angiogenesis by sponging miR-126-5p in colorectal cancer

Affiliations

YAP1-induced MALAT1 promotes epithelial-mesenchymal transition and angiogenesis by sponging miR-126-5p in colorectal cancer

Zhenqiang Sun et al. Oncogene. 2019 Apr.

Retraction in

Abstract

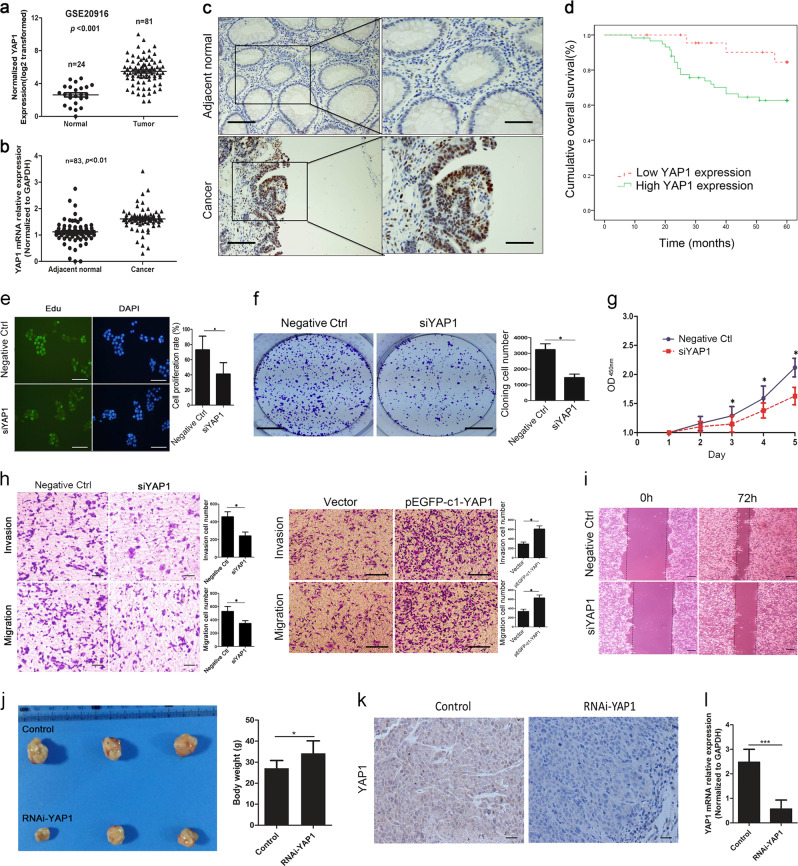
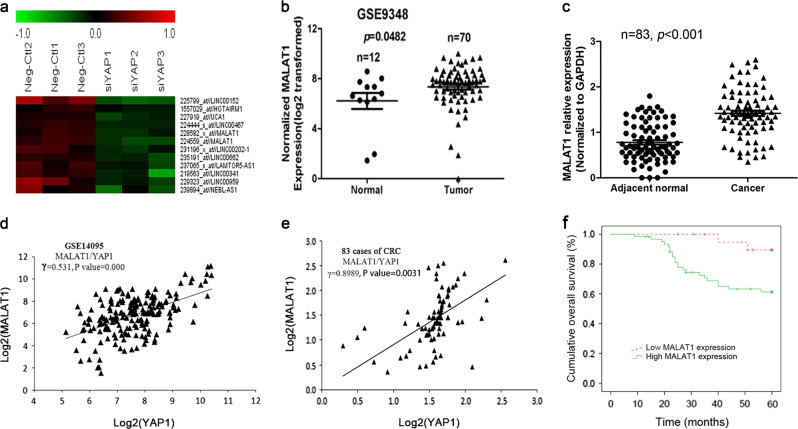
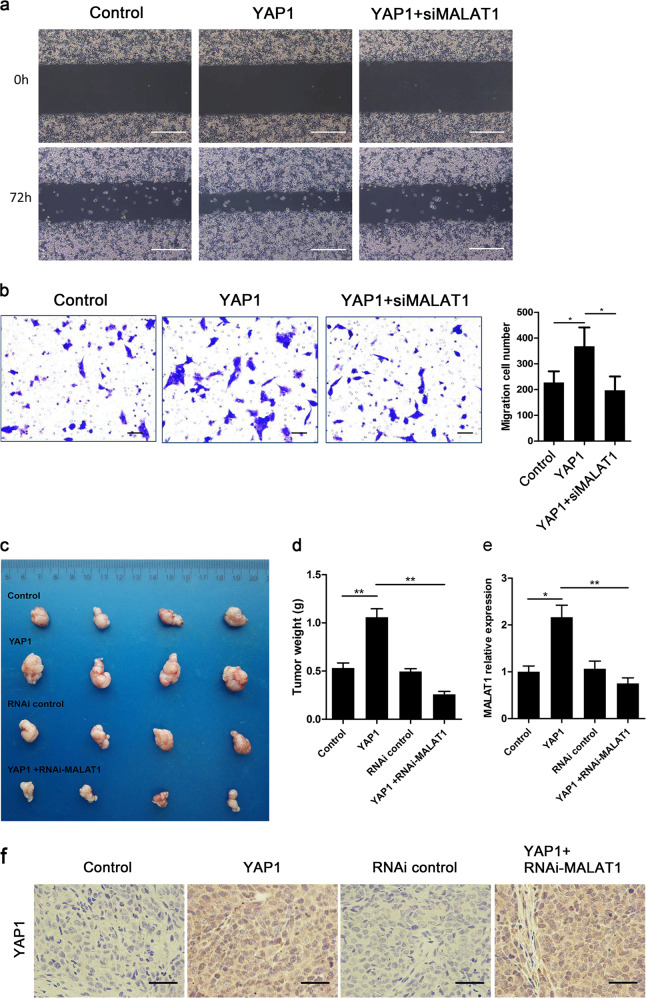
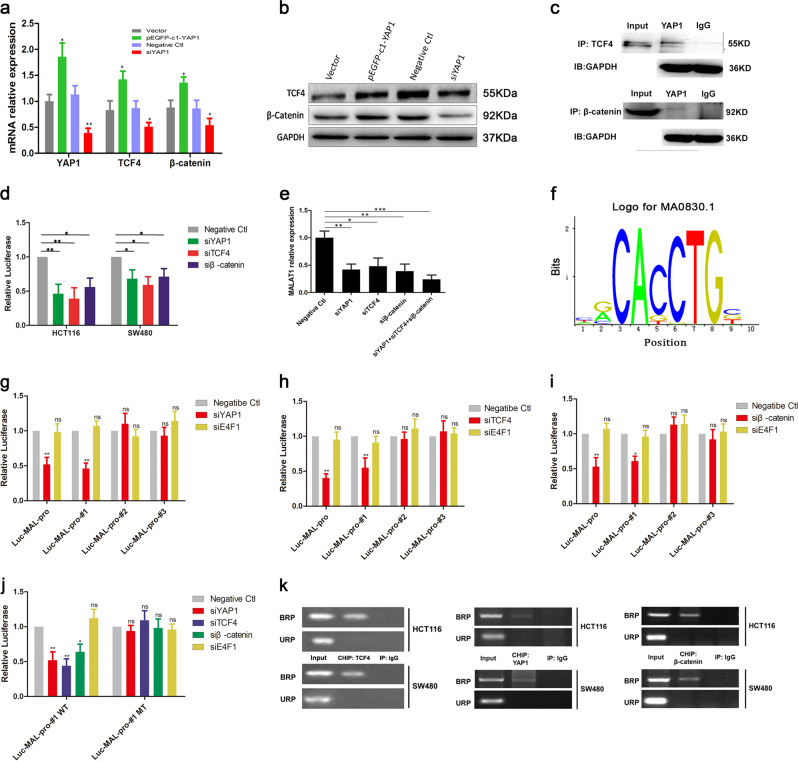
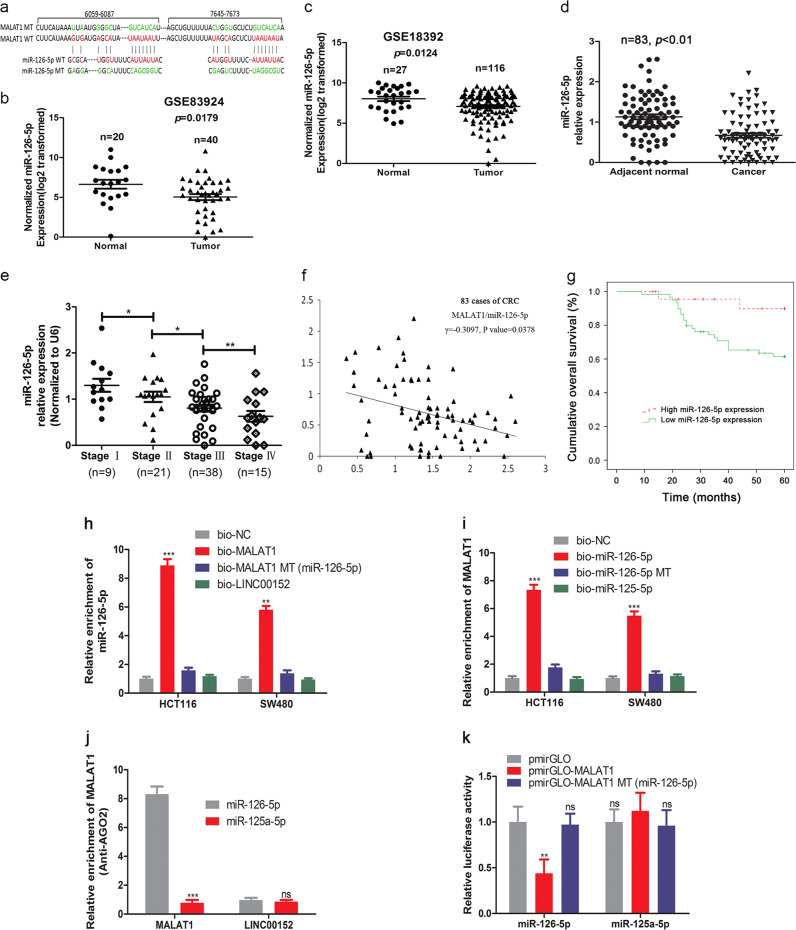
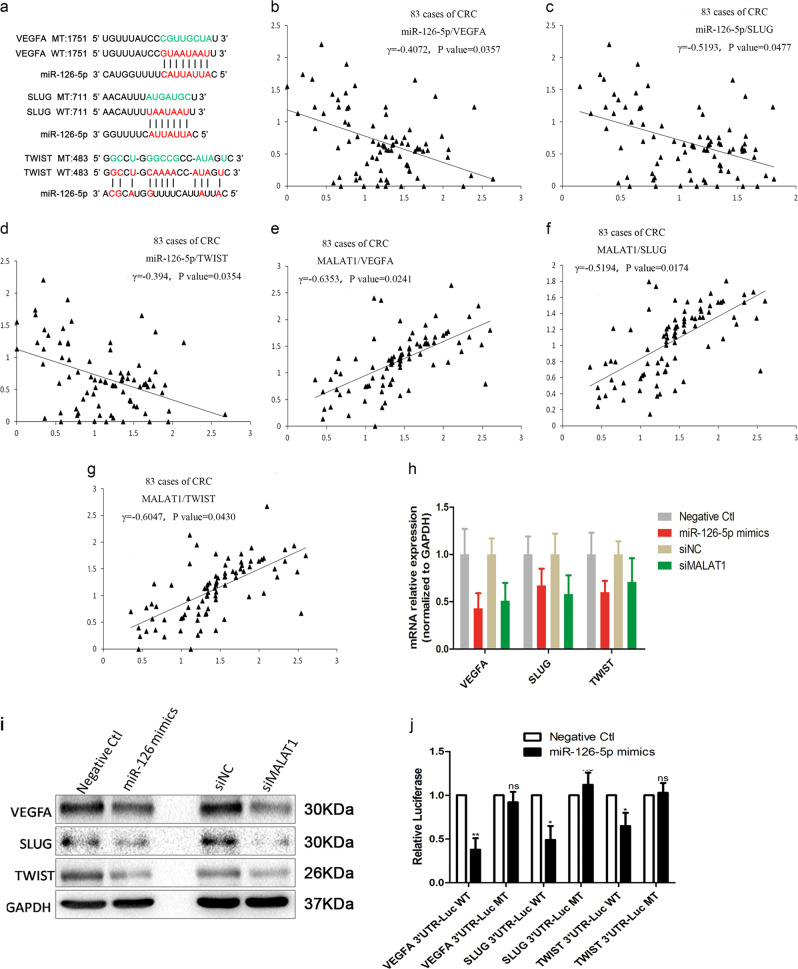
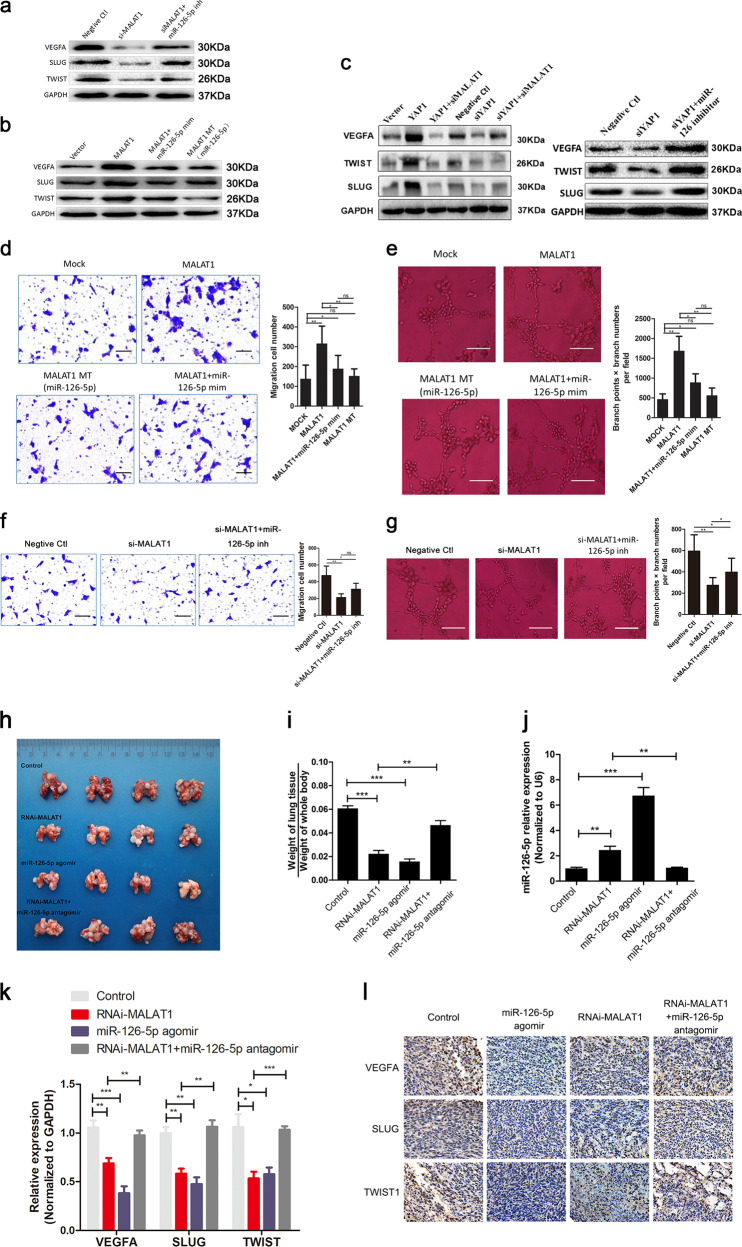
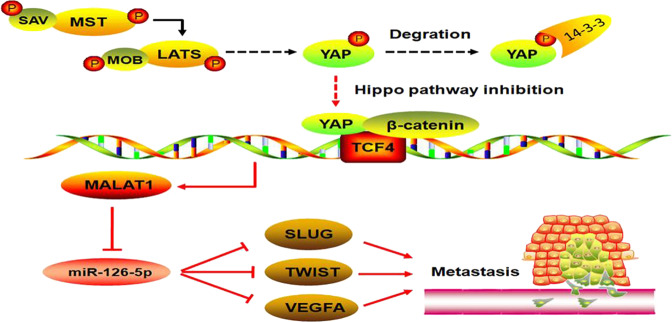
Yes-associated protein 1 (YAP1) exerts significant effects in various malignancies. However, the oncogenic role of YAP1 remains controversial, and the mechanism by which YAP1 regulates non-coding RNAs is still largely unknown. The present study aimed to assess the effect of YAP1 on the malignant behaviors of colorectal carcinoma (CRC) and explore the underlying regulatory mechanism of the YAP1-MALAT1-miR-126-5p axis. YAP1 was highly expressed in CRC tissues as assessed by GSE20916 and its expression was negatively correlated with overall survival in 83 CRC cases. Meanwhile, YAP1 promoted proliferation, invasion, and migration in colon cancer cells, in vitro and in vivo. MALAT1 was obviously expressed, with differential expression of 11 lncRNAs in HCT116 cells after transfection with siYAP1 or si-Ctl. Based on bioinformatics prediction, immunoprecipitation (IP), and chromatin immunoprecipitation (ChIP), the interaction of YAP1 with TCF4/β-catenin was regulated by MALAT1. Bioinformatics prediction, dual luciferase assay, RNA-IP, and RNA pull-down assay demonstrated that YAP1-induced MALAT1 promoted the expression of metastasis-associated molecules such as VEGFA, SLUG, and TWIST, by sponging miR-126-5p in CRC. These findings indicated that the YAP1-MALAT1-miR-126-5p axis could control angiogenesis and epithelial-mesenchymal transition in CRC, providing potential biomarkers and therapeutic targets for CRC.


Conflict of interest statement

The authors declare that they have no conflict of interest.

Figures

Fig. 1
Fig. 1
YAP1 is upregulated, associated with poor prognosis, and promotes proliferation, invasion, and migration of CRC. a YAP1 was highly expressed in CRC samples in the GSE20916 dataset. b, c YAP1 showed higher levels in CRC samples compared with the corresponding adjacent normal colorectal specimens as assessed by qRT-PCR and immunohistochemistry. d Higher YAP1 expression was associated with poorer OS. eg YAP1 effects on cell proliferation determined after transfection with siYAP1 and the inhibitor negative control, respectively, in HCT116 cells by monoclonal cell test, CCK8 assay, and EdU staining. h Effects of YAP1 on invasion and migration in HCT116 cells after transfection with siYAP1 and the inhibitor negative control, respectively, as assessed by Transwell assay. i Wound-healing assay of HCT116 cells transfected with siYAP1 or the negative control. j In vivo subcutaneous tumors deriving from HCT116 cells in nude mice after injection of RNAi-YAP1 (siYAP1 agomir) or control. After 28 days, the nude mice were euthanized, and subcutaneous tumors were examined macroscopically. Tumor weight reflects the proliferation ability of HCT116 cells in vivo. Results of three representative mice from each group are shown. k, l Immunohistochemistry and qRT-PCR were employed to measure the protein and mRNA expression levels of YAP1 in subcutaneous tumors from nude mice. Three independent experiments were performed. *p < 0.05, **p < 0.01, ***p < 0.001 compared to the control group by Student’s t-test
Fig. 2
Fig. 2
YAP1 silencing downregulates the oncogene MALAT1 in colon cancer cells. a Heat-map (from GSE92335) showing differential expression of lncRNAs in control (Ctl; negative control) and YAP1-silenced (siYAP1) HCT116 cells. Increasing red color indicates increasing signal strength, whereas weak signal strength is represented by increasing blue color. b Analysis of the GSE14095 dataset showed that MALAT1 expression was positively associated with YAP1 mRNA expression. c MALAT1 was highly expressed in CRC samples compared with corresponding adjacent normal colorectal samples as assessed by qRT-PCR. d, e Correlation analysis of GSE14095 dataset and 83 CRC cases demonstrated that MALAT1 was closely related to YAP1 mRNA expression. f High MALAT1 expression was associated with poor OS. Three independent experiments were performed. *p < 0.05, ***p < 0.001 compared to the control group, by Student’s t-test
Fig. 3
Fig. 3
YAP1-induced MALAT1 modulates the biological function of colon cancer cells in vitro and in vivo. a Wound-healing assay of HCT116 cells transfected with pEGFP-YAP1, pEGFP-YAP1 + MALAT1, or vector. b The effect of the YAP1–MALAT1 axis on migration was assessed in HCT116 cells after transfection with pEGFP-YAP1, pEGFP-YAP1 + MALAT1, or vector, by Transwell assay. c, d In vivo subcutaneous tumor xenografts stably transfected HCT116 cells in nude mice after injection of control, YAP1, RNAi control, or YAP1 + RNAi-MALAT1. After 28 days, the nude mice were sacrificed and the subcutaneous tumors were assessed macroscopically. Tumor weight reflected the proliferation ability of HCT116 cells in vivo. Four representative mice from each group are shown. e MALAT1 expression in various groups with in vivo subcutaneous tumors, as assessed by qRT-PCR. f Immunohistochemical detection of YAP1 protein levels in subcutaneous tumors from nude mice. Three independent experiments were performed. *p < 0.05, **p < 0.01 compared to the control group, by Student’s t-test
Fig. 4
Fig. 4
YAP1 in combination with TCF4 and β-catenin regulates MALAT1 expression in colon cancer cells. a YAP1, TCF4, and β-catenin expression levels in HCT116 cells transfected with pEGFP-c1-YAP1, siYAP1, vector or negative control by qRT-PCR. b TCF4 and β-catenin expression levels in HCT116 cells treated with pEGFP-c1-YAP1, siYAP1, vector or negative control by Western blotting. c IP confirmed YAP1 interactions with TCF4 and β-catenin in HCT116 cells (GAPDH, IgG as a negative control). d Promoter activities in HCT116 and SW480 cells co-transfected with luciferase reporters for MALAT1 and silencing plasmids (siYAP1, siTCF4, siβ-catenin or negative control, as indicated) for 48 h. e The expression levels of MALAT1 in HCT116 cells treated with silencing plasmids (siYAP1, siTCF4, siβ-catenin or negative control, as indicated) for 48 h. f The TCF4 motif predicted from JASPAR matrix models. gj Promoter activities from HCT116 cells co-transfected with luciferase reporters of differently predicted binding-site plasmids (Luc-MAL-pro, Luc-MAL-pro-#1, Luc-MAL-pro-#2, or Luc-MAL-pro-#3) and treated with the silencing plasmids siYAP1, siTCF4, siβ-catenin, or negative control, were measured by dual luciferase reporter assay. Luc-MAL-pro, containing three WT binding sites; Luc-MAL-pro-#1, Luc-MAL-pro-#2, and Luc-MAL-pro-#3, containing the first, second, and third WT binding sites, respectively, away from the transcription start site of MALAT1; E4F1 was assessed as the negative control. k ChIP assays using anti-TCF4, anti-YAP1, and anti-β-catenin antibodies were performed in HCT116 and SW480 cells. A control IgG was used as the negative control for IP. Semi-qPCR was used to assess ChIP signals. BRP binding region primer, URP unrelated region primer. Three independent experiments were performed. *p < 0.05, **p < 0.01, ***p < 0.001 compared to the control group, by Student’s t-test
Fig. 5
Fig. 5
MALAT1 sponges the tumor-suppressor miR-126-5p in colon cancer cells. a Predicted sequences of miR-126-5p-binding sites within MALAT1, and MALAT1 MT and miR-126-5p MT sequences at the top and bottom, respectively, were used. b, c miR-126-5p was lowly expressed in CRC samples as assessed by the GSE83924 and GSE18392 datasets. d Analysis of miR-126-5p expression levels in colorectal tissues as detected by qRT-PCR. e Analysis of the expression patterns of miR-126-5p in different TNM stages of CRC by qRT-PCR. f Correlation analysis of miR-126-5p and MALAT1 expression levels in CRC tissues by Spearman’s rank correlation coefficient. g Overall survival analysis was carried out to assess the prognostic effect of miR-126-5p in patients with CRC by the Kaplan–Meier method. h HCT116/SW480 cell lysates were incubated with biotin-labeled MALAT1, and miR-126-5p expression levels were determined by qPCR after pull-down. i HCT116/SW480 cell lysates were incubated with biotin-labeled miR-126-5p, and MALAT1 expression was assayed by qPCR after pull-down. j AGO2-RIP was followed by MALAT1 qPCR to assess MALAT1 levels after miR-126-5p overexpression. k Luciferase activity in HCT116 cells co-transfected with miR-126-5p and luciferase reporters containing MALAT1 or mutant transcript. Data were presented as the relative ratio of firefly luciferase activity to Renilla luciferase activity. Three independent experiments were performed. *p < 0.05, **p < 0.01, ***p < 0.001 compared to the control group, by Student’s t-test
Fig. 6
Fig. 6
MALAT1–miR-126-5p regulates VEGFA, SLUG, and TWIST expression in colon cancer cells. a Predicted sequences of miR-126-5p binding sites within the 3′-UTRs of VEGFA, SLUG, and TWIST, and sequences of VEGFA, SLUG, and TWIST 3′-UTR mutants (Mut) used in this study (top). bd Correlation analysis of miR-126-5p and predicted target gene (VEGFA, SLUG, and TWIST) expression levels in CRC tissues, assessed by Spearman’s rank correlation. eg Correlation analysis of MALAT1 and expression levels of predicted target gene (VEGFA, SLUG, and TWIST) in CRC tissues, assessed by Spearman’s rank correlation. h, i Analysis of miR-126-5p and MALAT1 regulatory effects on VEGFA, SLUG, and TWIST in HCT116 cells by qRT-PCR and immunoblot. j Luciferase activity in HCT116 cells co-transfected with miR-126-5p mimics and luciferase reporters containing the indicated 3′-UTR-driven reporter constructs or mutant transcripts. Data were presented as the relative ratio of firefly luciferase activity to Renilla luciferase activity. Three independent experiments were performed. *p < 0.05, **p < 0.01 compared to the control group, by Student’s t-test
Fig. 7
Fig. 7
The MALAT1–miR-126-5p–VEGFA/SLUG/TWIST axis modulates the biological function of colon cancer cells in vitro and in vivo. a Western blot analysis of VEGFA, SLUG, and TWIST protein expression levels after MALAT1 knock-down in HCT116 cells. b Western blot analysis of VEGFA, SLUG, and TWIST expression levels after MALAT1 overexpression in HCT116 cells. c Effects of the YAP1–MALAT1–miR-126-5p axis on YAP1, VEGFA, SLUG, and TWIST protein expression levels in HCT116 cells, as assessed by Western blot. d Migration in Transwell assays after MALAT1 overexpression in HCT116 cells. e Angiogenesis after MALAT1 overexpression in HCT116 cells. f Migration in Transwell assays after MALAT1 knockdown in HCT116 cells. g Angiogenesis after MALAT1 knockdown in HCT116 cells. h Tail vein injection of HCT116 cells transfected control, RNAi-MALAT1, miR-126-5p agomir, and RNAi-MALAT1 + miR-126-5p antagomir into nude mice. After 10 weeks, the mice were euthanized, and metastatic lung nodules were detected macroscopically. i The ratio of weight of lung tissue to weight of whole body reflected the metastasis ability of HCT116 cells in vivo. Results in four representative mice from each group are shown. j Analysis of miR-126-5p expression levels in metastatic lung nodules from nude mice treated with RNAi-MALAT1, miR-126-5p agomir, miR-126-5p antagomir or agomir control, as assessed by qRT-PCR. k Expression of VEGFA, SLUG, and TWIST in metastatic lung nodules of nude mice treated with miR-126-5p agomir, siMALAT1 agomir, or agomir control, determined by qRT-PCR. l Immunohistochemistry for assessing protein levels of VEGFA, SLUG, and TWIST in subcutaneous tumors from nude mice. Three independent experiments were performed. *p < 0.05, **p < 0.01, ***p < 0.001 compared to the control group, by Student’s t-test
Fig. 8
Fig. 8
Schematic representation of a model depicting the major molecular mechanisms of the YAP1–MALAT1–miR-126-5p–VEGFA/SLUG/TWIST axis in CRC

References

    1. Siegel RL, Miller KD, Fedewa SA, Ahnen DJ, Meester RGS, Barzi A, et al. Colorectal cancer statistics, 2017. CA Cancer J Clin. 2017;67:177–93. doi: 10.3322/caac.21395. - DOI - PubMed
    1. Chen WQ, Zheng RS, Baade PD, Zhang SW, Zeng HM, Bray F, et al. Cancer statistics in China, 2015. CA Cancer J Clin. 2016;66:115–32. doi: 10.3322/caac.21338. - DOI - PubMed
    1. Bottomley A. Metastatic colorectal cancer: treatment challenges and quality of life. Lancet. 2002;359:1537–8. doi: 10.1016/S0140-6736(02)08526-4. - DOI - PubMed
    1. Kapranov P, Cheng J, Dike S, Nix DA, Duttagupta R, Willingham AT, et al. RNA maps reveal new RNA classes and a possible function for pervasive transcription. Science. 2007;316:1484. doi: 10.1126/science.1138341. - DOI - PubMed
    1. Yang F, Zhang L, Huo XS, Yuan JH, Xu D, Yuan SX, et al. Long noncoding RNA high expression in hepatocellular carcinoma facilitates tumor growth through enhancer of zeste homolog 2 in humans. Hepatology. 2011;54:1679–89. doi: 10.1002/hep.24563. - DOI - PubMed

Publication types

MeSH terms