. 2019 Apr;38(14):2565-2579.
doi: 10.1038/s41388-018-0617-1. Epub 2018 Dec 10.

Resistance to Src inhibition alters the BRAF-mutant tumor secretome to promote an invasive phenotype and therapeutic escape through a FAK>p130Cas>c-Jun signaling axis

Affiliations

Resistance to Src inhibition alters the BRAF-mutant tumor secretome to promote an invasive phenotype and therapeutic escape through a FAK>p130Cas>c-Jun signaling axis

Brittelle E Kessler et al. Oncogene. 2019 Apr.

Abstract

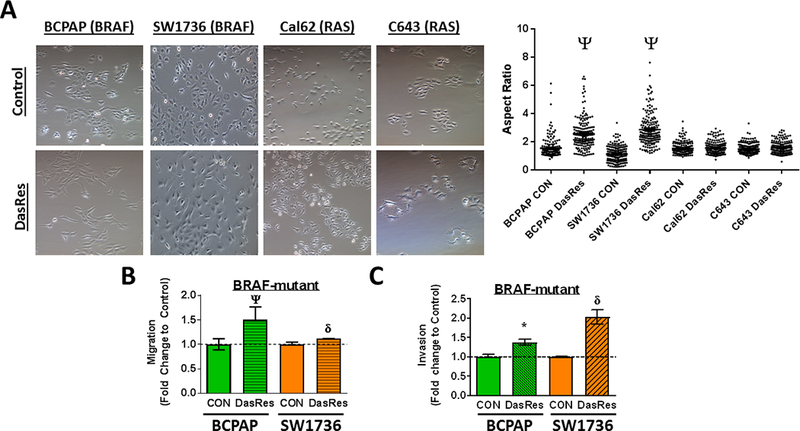
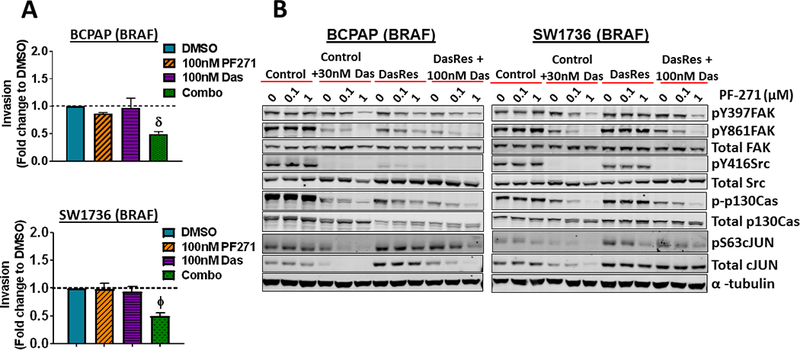
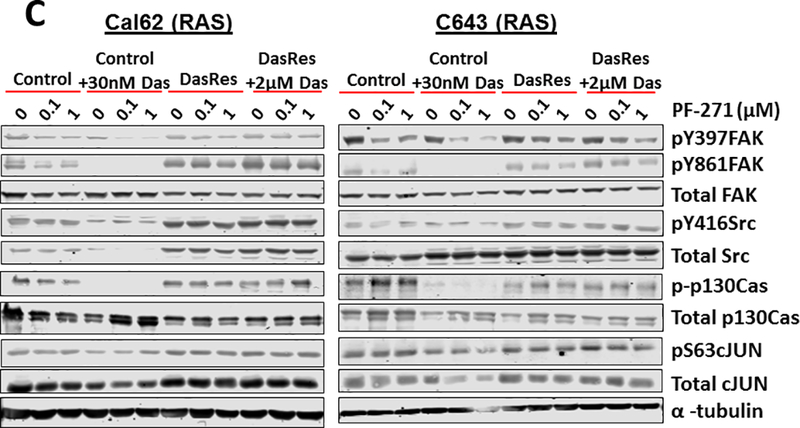
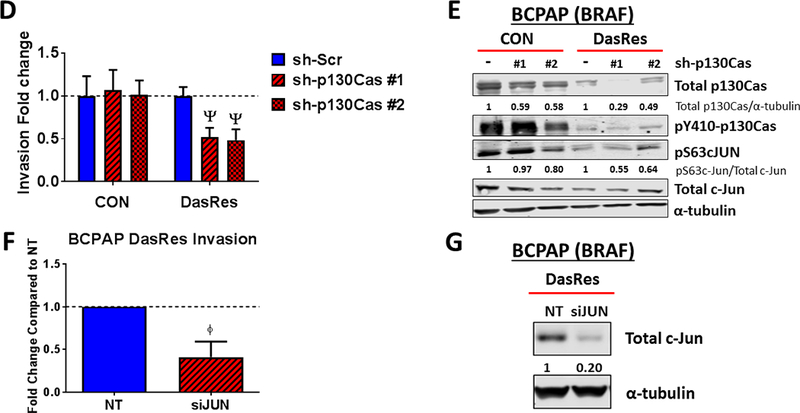
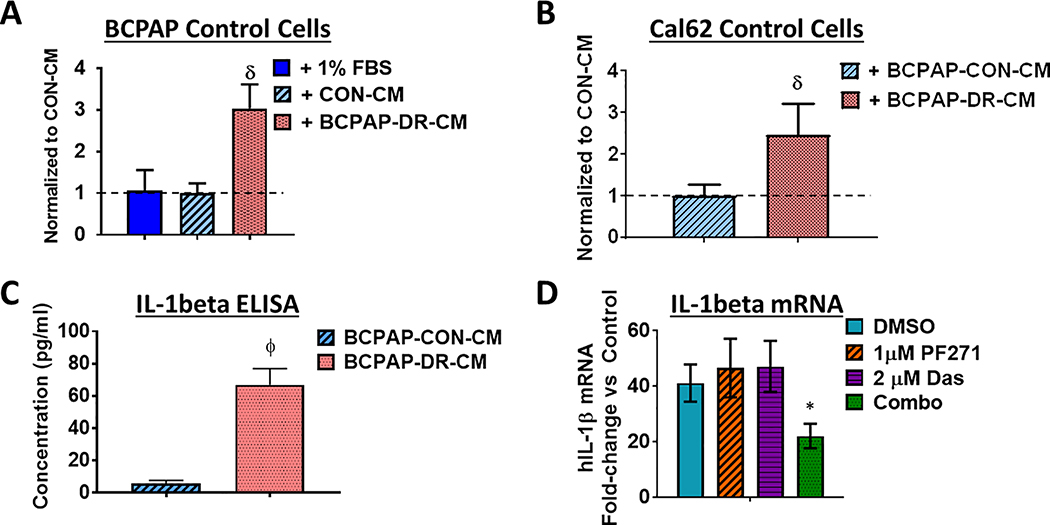
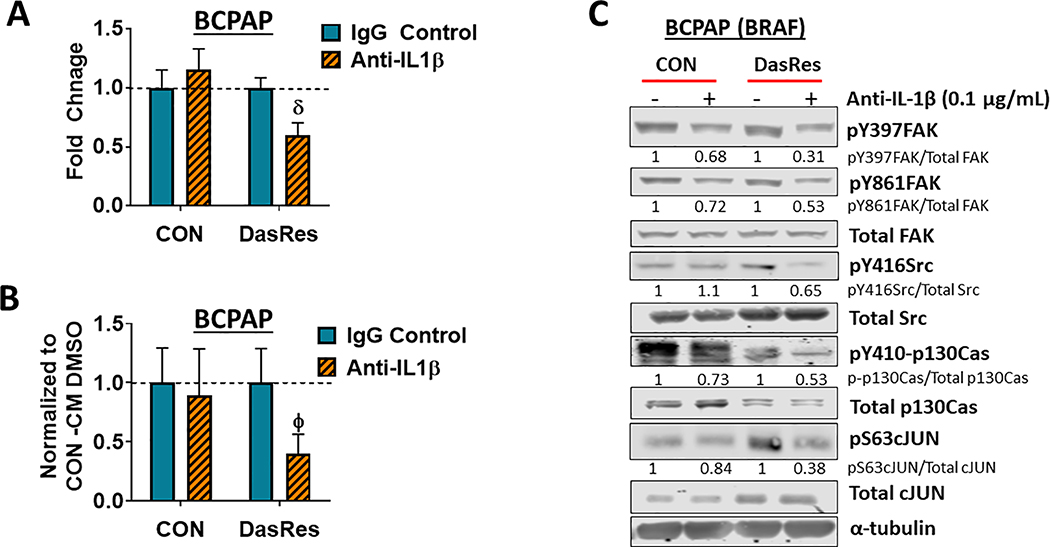
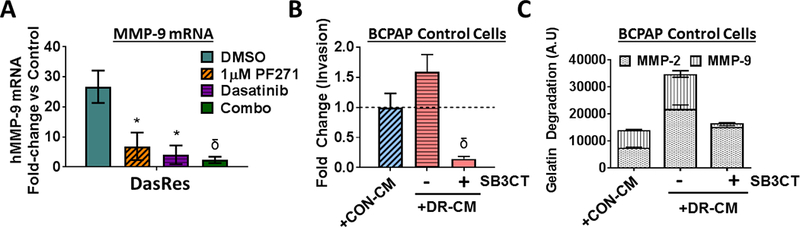
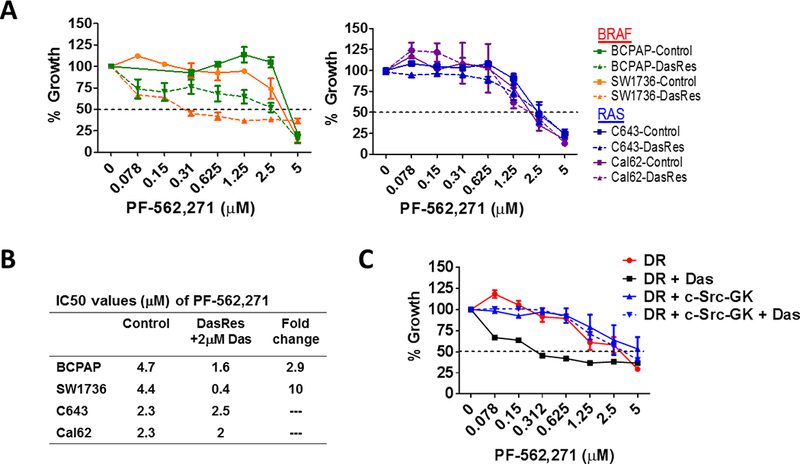
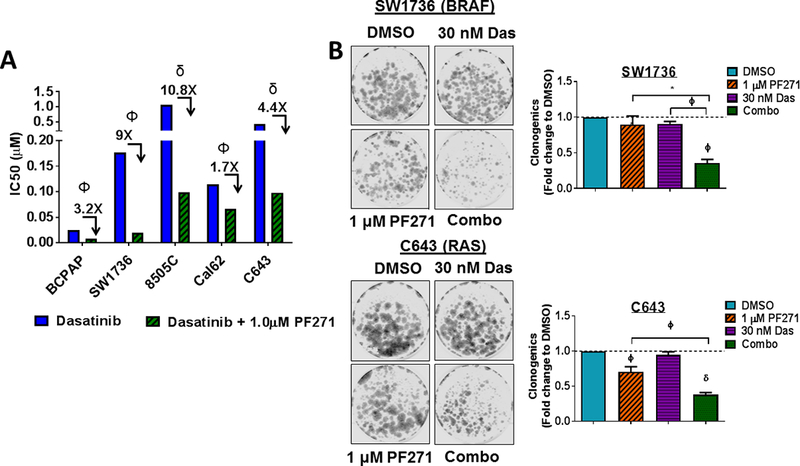
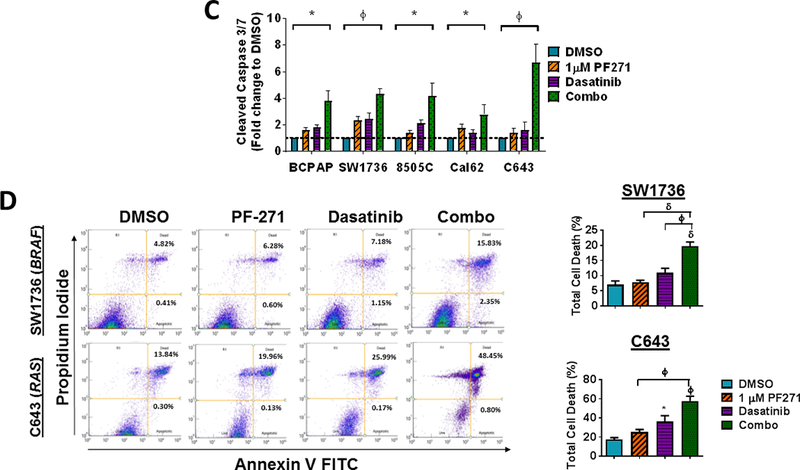
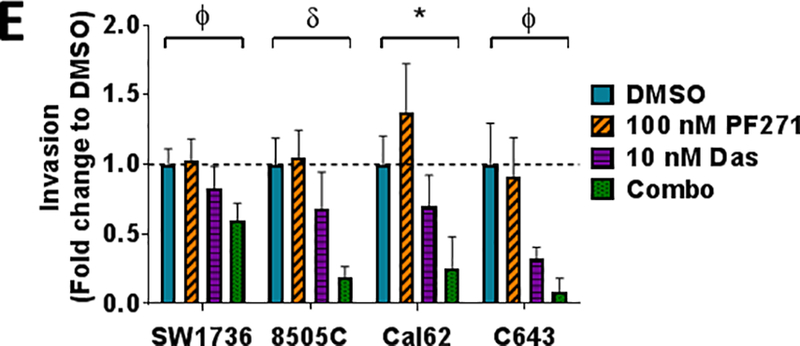
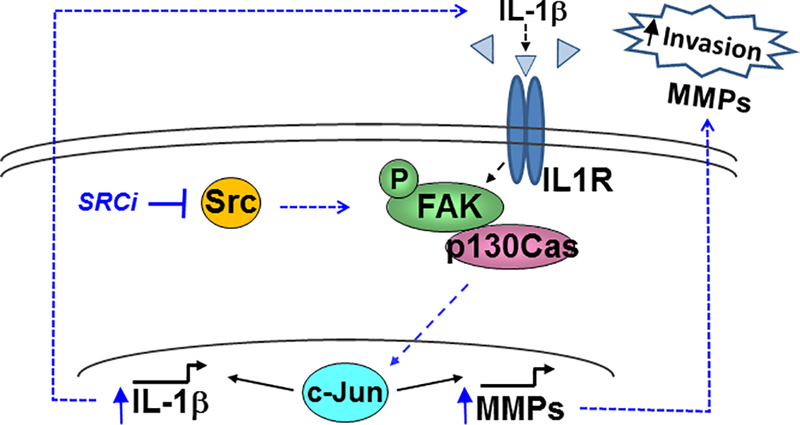
Few therapy options exist for patients with advanced papillary and anaplastic thyroid cancer. We and others have previously identified c-Src as a key mediator of thyroid cancer pro-tumorigenic processes and a promising therapeutic target for thyroid cancer. To increase the efficacy of targeting Src in the clinic, we sought to define mechanisms of resistance to the Src inhibitor, dasatinib, to identify key pathways to target in combination. Using a panel of thyroid cancer cell lines expressing clinically relevant mutations in BRAF or RAS, which were previously developed to be resistant to dasatinib, we identified a switch to a more invasive phenotype in the BRAF-mutant cells as a potential therapy escape mechanism. This phenotype switch is driven by FAK kinase activity, and signaling through the p130Cas>c-Jun signaling axis. We have further shown this more invasive phenotype is accompanied by alterations in the secretome through the increased expression of pro-inflammatory cytokines, including IL-1β, and the pro-invasive metalloprotease, MMP-9. Furthermore, IL-1β signals via a feedforward autocrine loop to promote invasion through a FAK>p130Cas>c-Jun>MMP-9 signaling axis. We further demonstrate that upfront combined inhibition of FAK and Src synergistically inhibits growth and invasion, and induces apoptosis in a panel of BRAF- and RAS-mutant thyroid cancer cell lines. Together our data demonstrate that acquired resistance to single-agent Src inhibition promotes a more invasive phenotype through an IL-1β>FAK>p130Cas>c-Jun >MMP signaling axis, and that combined inhibition of FAK and Src has the potential to block this inhibitor-induced phenotype switch.


Conflict of interest statement

CONFLICT OF INTEREST

The authors declare no conflict of interest.

COMPETING INTERESTS: The authors have not competing financial interests to declare.

Figures

Figure 1.
Figure 1.. Cellular morphology and motility is altered in dasatinib-resistant cells.
(A) Brightfield images were taken (10x magnification) of Control and DasRes cells (left) and quantification of aspect ratios to measure length versus width was performed using ImageJ. Migration (B) and Invasion (C) of Control and DasRes cells was quantified after 24 hours. DasRes data was normalized to Control set to 1. Data shown are mean ± SEM of 3 independent experiments performed in duplicate. (A-C) All data were analyzed with a paired t-test. DasRes cells were maintained in 2 μM dasatinib. Symbols indicate * p≤0.05, δ p≤0.001, and Ψ p≤0.0001.
Figure 2.
Figure 2.. Combined FAK and Src inhibition blocks invasion in the BRAF-mutant DasRes cells, which correlates with inhibition of FAK, p130Cas, and c-Jun.
(A) Invasion of DasRes cells after 24 hours in the presence of DMSO, 100 nM PF-562,271, 100 nM dasatinib, or the combination of 100 nM PF-562,271 and 2𝜇M dasatinib was quantified. Results were normalized to DMSO-treated control set to 1. Results shown are mean ± SEM of 3 independent experiments performed in duplicate. Data were analyzed with a paired t-test. (B-C) Western blot analysis was performed on cells treated with the indicated concentrations of PF-562,271 and/or dasatinib for 24 hours. At least 3 independent experiments were performed for each cell line. Representative blots are shown. (D) BCPAP Control and DasRes cells were stably transfected with a scramble (Scr) control shRNA or shRNAs targeting p130Cas (sh-p130Cas #1 and #2). Invasion was performed on Scr and sh-p130Cas-expressing cells and data from each cell line was normalized to Scr expressing cells. Results shown are mean ± SEM of 3 independent experiments performed in duplicate. Data was analyzed by paired t-test. (E) Western blot analysis was performed on 3 independent cell lysates and a representative blot is shown. Quantification was performed on 3 independent experiments and the average is shown. (F) Invasion was performed on BCPAP DasRes cells transfected with nontargeting siRNA (NT) or siRNA targeting c-Jun. Data from each cell line was normalized to Scr expressing cells. Results shown are mean ± SEM of 3 independent experiments performed in duplicate. (G) Western blot analysis was performed on 3 independent cell lysates and a representative blot is shown. Quantification was performed on 3 independent experiments and the average is shown. DasRes cells were maintained in 2 μM dasatinib unless otherwise indicated. Symbols indicate * p≤0.05, Φ p≤0.01, δ p≤0.001, and Ψ p≤0.0001.
Figure 3.
Figure 3.. Conditioned media from BRAF-mutant dasatinib-resistant cells promotes invasion.
Conditioned media (CM) was collected from BCPAP Control and DasRes cells. (A) Invasion assays of Control cells were performed in the presence of 1% FBS control, BCPAP Control CM, or BCPAP DasRes (DR) CM. Results shown are mean ± SEM of 3 independent experiments performed in duplicate. (B) Invasion of Cal62 (RAS-mutant) Control cells was performed in the presence of BCPAP (BRAF-mutant) Control CM or DasRes (DR) CM. Quantification was performed and data was normalized to CM from Control cells, set to 1. Results shown are mean ± SEM of 3 independent experiments performed in duplicate. (C) ELISAs were performed on conditioned media (CM) from BCPAP Control or DasRes cells. The fold-change of IL-1β in DasRes (DR) CM to Control CM is shown. Results shown are average of 2 replicates ± SD. (D) BCPAP DasRes cells were treated with the indicated inhibitors for 24 h and qRT-PCR of IL-1β was performed. Fold-change of IL1β in the BCPAP DasRes cells compared to the Control cells is shown. Results shown are the mean of 3 experiments ± SD. Data was analyzed by paired t-test. DasRes cells were maintained in 2 μM dasatinib. Symbols indicate * p≤0.05, Φ p≤0.01, δ p≤0.001, and Ψ p≤0.0001.
Figure 4.
Figure 4.. IL-1𝛽 regulates invasion through a FAK>p130Cas>c-Jun signaling axis.
(A) Invasion assays of BCPAP Control and DasRes cells were performed in the presence of absence of 0.1μg/mL of IL-1𝛽 neutralizing antibody or an IgG isotype control. Quantification was performed and data from each cell line was normalized to its respective DMSO-treated control. Results shown are mean ± SEM of 3 independent experiments performed in duplicate. (B) Invasion of BCPAP Control cells was performed in the presence of either BCPAP Control conditioned media (CM) or DasRes conditioned media, treated with either DMSO or anti-IL-1𝛽. Quantification was performed and data was normalized to the appropriate conditioned media treated with DMSO. Results shown are mean ± SEM of 3 independent experiments performed in duplicate. (C) Western blot analysis was performed on BCPAP Control and DasRes cells treated with the indicated concentration of anti-IL-1𝛽 or IgG isotype control antibody. Three independent experiments were performed and a representative blot is shown. Quantification was performed and shown as the average of 3 experiments. DasRes cells were maintained in 2 μM dasatinib. δ indicates p≤0.001; Φ indicates p≤0.01.
Figure 5.
Figure 5.. Expression and activity of MMP-9 are increased in BRAF-mutant dasatinib-resistant cells.
(A) Transcript levels of MMP-9 were evaluated by qRT-PCR. Levels of MMP-9 in the BCPAP DasRes cells compared to the Control cells is shown (~27-fold-increase). DasRes cells were treated with the either DMSO, 1𝜇M PF-562,271, dasatinib (30nM for controls or 2𝜇M for DasRes), or the combination. (B) Invasion of BCPAP Control cells was performed in the presence of Control conditioned media (CM), DasRes CM, or DasRes CM treated with SB-3CT. Quantification was performed and data normalized to Control CM set to 1. Results shown are mean ± SD of 3 independent experiments performed in duplicate. (C) MMP activity was assessed by zymography assay and gelatin-degradation was quantified using ImageJ and averaged over 3 independent experiments. Symbols indicate * p≤0.05; δ p≤0.001.
Figure 6.
Figure 6.. Combined FAK and Src inhibition synergistically decreases growth in thyroid cancer cells.
(A) SRB assays were performed to assess cell growth. BRAF-mutant (left) and RAS-mutant (right) Control and DasRes cells were treated with the indicated concentration of PF-562,271. The DasRes cells were maintained in the presence of 2𝜇M dasatinib. Data was normalized to DMSO treated control set to 100%. Results shown are mean ± SEM of 3 independent experiments performed in triplicate. (B) IC50 values of PF-562,271 were calculated for the Control cells or DasRes cells + Das and listed in the table shown. Fold change in IC50 values of the DasRes cells compared to Control cells is shown. (C) SW1736 DasRes (DR) cells were stably transfected with empty vector or a c-Src gatekeeper expression vector (c-Src-GK) and growth sensitivity to PF-562,271 and dasatinib was assessed using SRB growth assays, as in 6A. Results shown are the mean of 3 experiments performed in triplicate ± SEM.
Figure 7.
Figure 7.. Upfront combined inhibition of FAK and Src results in synergistic inhibition of growth, enhanced induction of cell death, and inhibition of invasion.
(A) A panel of parental thyroid cancer cell lines were treated with increasing concentrations of dasatinib (0.019–1.25 μM) with or without 1 μM PF-562,271 and analyzed by 3 independent SRB assays performed in triplicate. IC50 values for dasatinib and the combination of dasatinib and 1𝜇M PF-562,271 were calculated. Results shown are mean IC50 values ± SD. Fold changes and p-values were calculated using Students t-test and are noted above the bars. (B) Clonogenic growth was detected by crystal violet staining in the SW1736 or C643 cell lines. 24 h after plating, cell lines were treated with either 30 nM dasatinib, 1 μM PF-562,271, or a combination of dasatinib and 1 𝜇M PF-562,271 for 6 days. Following 6 days of treatment, the cells were released for an additional 7 days. Quantification was performed and data was normalized to DMSO. Results shown are mean ± SD of 3 independent experiments. Statistical analysis was performed using 2-tailed paired student’s t-test. (C) Cleaved caspase 3/7 activity in a panel of thyroid cancer cell lines was measured at 48 hours in the presence of either DMSO, PF-562,271, dasatinib, or the combination, as indicated. BCPAP, SW1736, and Cal62 cells were treated with 30 nM dasatinib. 8505C and C643 cell lines were treated with 50 nM dasatinib. Quantification was performed and data was normalized to DMSO. Results shown are mean ± SD of 2–3 independent experiments performed in duplicate. Statistical analysis was performed using 2-tailed paired student’s t-test. (D) Annexin V FITC propidium iodide assays were performed on SW1736 and C643 cells after 48 hour of treatment with DMSO, 30 nM dasatinib, 1 μM PF-562,271, or a combination of dasatinib and PF-562,271. Representative Annexin V FITC vs propidium iodide plots are shown. Quantification was performed for percent of total cell death as indicated by high annexin V and high propidium iodide levels. Results shown are the mean of 3 experiments ± SD. Statistical analysis was performed using 2-tailed unpaired student’s t-test. (E) Invasion of a panel of thyroid cancer cell lines was performed in the presence of either DMSO, PF-562,271, dasatinib, or the combination, as indicated. Quantification was performed and data was normalized to DMSO. Results shown are mean ± SD of 3 independent experiments performed in duplicate. Statistical analysis was performed using 2-tailed student’s t-test. Symbols indicate * p≤0.05, Φ p≤0.01, and δ p≤0.001.
Figure 8.
Figure 8.. Model depicting how Src inhibition drives increased invasion via FAK>p130Cas>c-Jun.
Following Src inhibition (SRCi), c-Jun is activated and IL-1beta is transcriptionally upregulated, along with transcription of MMP-9 and IL-1beta itself, creating a feed-forward loop with chronic SRCi to promote invasion and FAK>p130Cas>c-Jun signaling. This switch is not necessarily mediated by an increase in intrinsic FAK kinase activity, and therefore may be mediated through different protein-protein interactions and/or localization.

Similar articles

Cited by

References

    1. Sipos JA, Shah MH. Thyroid cancer: emerging role for targeted therapies. Ther Adv Med Oncol. SAGE Publications; 2010;2:3–16. - PMC - PubMed
    1. Kebebew E, Greenspan FS, Clark OH, Woeber KA, McMillan A. Anaplastic thyroid carcinoma. Treatment outcome and prognostic factors. Cancer 2005;103(7):1330–5 doi 10.1002/cncr.20936.AQ6 - DOI - PubMed
    1. Antonelli A, Fallahi P, Ferrari SM, Ruffilli I, Santini F, Minuto M, et al. New targeted therapies for thyroid cancer. Curr Genomics. 2011;12:626–31. - PMC - PubMed
    1. Santarpia L, Lippman SM, El-Naggar AK. Targeting the MAPK-RAS-RAF signaling pathway in cancer therapy. Expert Opin Ther Targets. NIH Public Access; 2012;16:103–19. - PMC - PubMed
    1. Carneiro RM, Carneiro BA, Agulnik M, Kopp PA, Giles FJ. Targeted therapies in advanced differentiated thyroid cancer. Cancer Treat Rev. 2015; - PubMed

Publication types

MeSH terms