. 2019 Jan;51(1):88-95.
doi: 10.1038/s41588-018-0294-6. Epub 2018 Dec 10.

A map of constrained coding regions in the human genome

Affiliations

A map of constrained coding regions in the human genome

James M Havrilla et al. Nat Genet. 2019 Jan.

Abstract

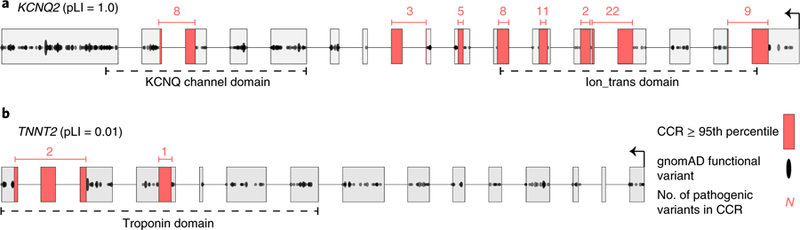
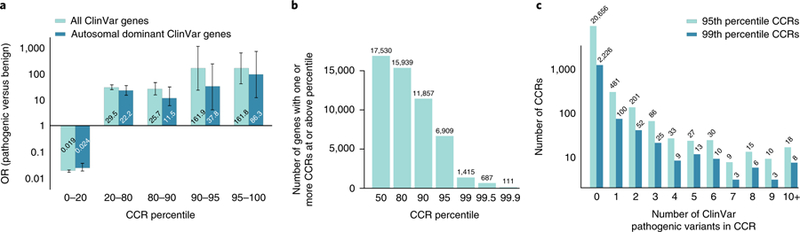
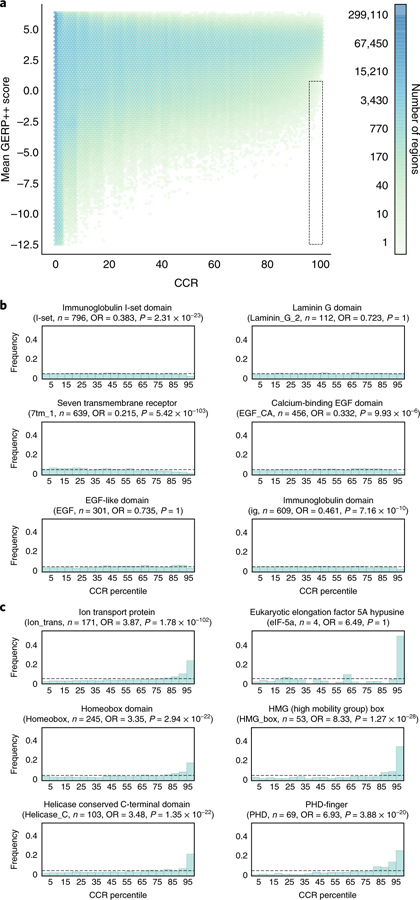
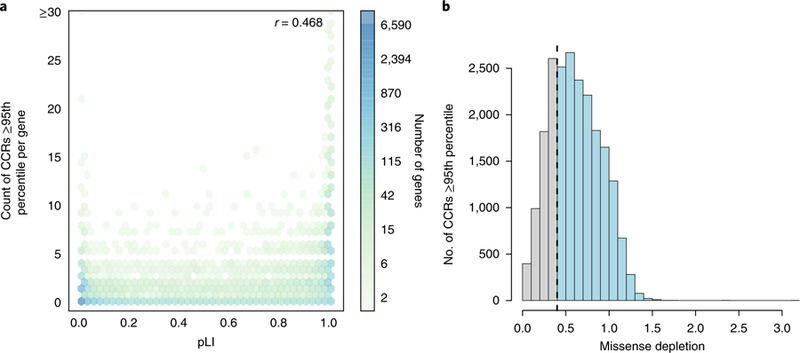
Deep catalogs of genetic variation from thousands of humans enable the detection of intraspecies constraint by identifying coding regions with a scarcity of variation. While existing techniques summarize constraint for entire genes, single gene-wide metrics conceal regional constraint variability within each gene. Therefore, we have created a detailed map of constrained coding regions (CCRs) by leveraging variation observed among 123,136 humans from the Genome Aggregation Database. The most constrained CCRs are enriched for pathogenic variants in ClinVar and mutations underlying developmental disorders. CCRs highlight protein domain families under high constraint and suggest unannotated or incomplete protein domains. The highest-percentile CCRs complement existing variant prioritization methods when evaluating de novo mutations in studies of autosomal dominant disease. Finally, we identify highly constrained CCRs within genes lacking known disease associations. This observation suggests that CCRs may identify regions under strong purifying selection that, when mutated, cause severe developmental phenotypes or embryonic lethality.


Conflict of interest statement

Competing interests

The authors declare no competing interests.

Figures

Fig. 1
Fig. 1. Gene-wide summary measures of constraint are prone to overstating and understating constraint within specific regions of protein-coding genes.
a, KCNQ2 has the highest possible pLI score of 1.0, yet there are entire exons (for example, the leftmost exon) with many protein-changing variants, indicating they are under minimal constraint. Highly constrained (that is, in the 95th percentile or higher, as described in the text) CCRs highlighted in red are devoid of protein-changing variation in gnomAD. b, In contrast, TNNT2, which regulates muscle contraction and has been implicated in familial hypertrophic cardiomyopathy, has a very low pLI of 0.01. However, there are focal regions lacking protein-changing variation, indicating a high degree of local constraint. Numbers above each CCR reflect the number of ClinVar pathogenic variants in each CCR and illustrate that CCRs often coincide with known disease loci.
Fig. 2
Fig. 2. The most constrained CCRs are enriched for pathogenic variants and are restricted to a small subset of genes.
a, OR enrichment for ClinVar pathogenic variants versus benign variants for different CCR percentile bins among all autosomal ClinVar genes (light cyan) and genes that underlie autosomal dominant diseases (dark cyan). For all ClinVar genes, the error bars represent 95% CIs of 0.015–0.023 for the 0–20 percentile bin, 23.9–36.6 for the 20–80 percentile bin, 14.6–45.4 for the 80–90 percentile bin, 22.8–1,151.0 for the 90–95 percentile bin, and 40.4–647.5 for the 95–100 percentile bin. For autosomal dominant ClinVar genes, the 95% CIs are 0.017–0.035 for the 0–20 percentile bin, 14.3–34.3 for the 20–80 percentile bin, 5.12–25.7 for the 80–90 percentile bin, 5.32–269.5 for the 90–95 percentile bin, and 12.1–613.9 for the 95–100 percentile bin. A total of 24,554 pathogenic variants and 4,689 benign variants from ClinVar were intersected with CCRs; 10,781 pathogenic and 865 benign ClinVar variants lie within autosomal dominant genes. b, Histogram of the number of autosomal genes with at least one CCR greater than or equal to different percentile thresholds. c, Histogram of the number of 95th and 99th percentile CCRs with 0 to 10 or more overlapping ClinVar pathogenic variants. Highly constrained CCRs that harbor no known pathogenic variants may reflect regions under extreme purifying selection. Of the 24,554 ClinVar pathogenic variants, 2,172 (8.8%) and 551 (2.7%) were found in CCRs at or above the 95th and 99th percentile, respectively.
Fig. 3
Fig. 3. The relationship between CCRs and interspecies conservation.
a, A comparison of intraspecies constraint (CCRs) and interspecies conservation, as measured by the mean GERP++ score in each CCR. Regions in the dotted box reflect intraspecies constraint not revealed by interspecies conservation. That is, they have a GERP++ score less than 0.7 and 95th percentile or greater CCR score. b, Example Pfam domain families for which constraint is nearly uniformly distributed among instances of the domain. c, Representative Pfam domain families exhibiting enrichment for higher levels of intraspecies constraint across the whole exome. P values and ORs reflect a Fisher’s exact test for a domain’s genomic intersection enrichment with CCRs in the 95th percentile or higher.
Fig. 4
Fig. 4. A comparison of CCRs with other models of genic and regional constraint.
a, The correlation (Pearson r) between a gene’s pLI and the number of CCRs in the 95th percentile or higher observed in the gene. In general, genes with high pLI (>0.9) tend to harbor many such CCRs, while genes with low pLI (<0.1) do not. However, many low-pLI genes exhibit focal constraint at or above the 95th percentile. b, The relationship between CCRs in the 95th percentile or higher and the missense depletion score for the same coding region. The dashed line reflects the missense depletion threshold (ɣ > 0.4) below which Samocha et al. define regional constraint. Light blue bars beyond this threshold reflect CCRs at or above the 95th percentile that would not be deemed as constrained by the missense depletion metric. Gray bars reflect CCRs that coincide with regions deemed to be under constraint by missense depletion. There are 8,065,333 unique CCRs, with 21,650 at or above the 95th percentile.
Fig. 5
Fig. 5. Evaluation of de novo mutations from a cohort with severe developmental delay, intellectual disability, and epileptic encephalopathy versus de novo variation from unaffected siblings of autism probands.
a, Enrichment of pathogenic de novo mutations in the most constrained CCRs, excluding pathogenic variants present in gnomAD. The 95% CI error bars are 0.22–0.29 for the 0–20 percentile bin, 1.36–1.81 for the 20–80 percentile bin, 1.24–2.16 for the 80–90 percentile bin, 1.66–3.50 for the 90–95 percentile bin, and 4.96–10.2 for the 95–100 percentile bin. b, ROC analysis for the developmental disorder de novo variant evaluation set described for a, where true positives are the pathogenic mutations and true negatives are the set of benign mutations. Of the 3,400 pathogenic and 1,269 benign mutations, each tool scored (M pathogenic; N benign): CCR (3,108; 1,149), CADD (3,399; 1,269), GERP++ (3,400; 1,269), MPC (3,221; 1,205), REVEL (3,368; 1,251), pLI (3,283; 1,212), MTR (3,389; 1,260). The dots in b and d indicate the score cutoff with the maximal Youden J statistic for each tool. Values in parenthesis indicate the AUC and the maximal J, respectively. c, Enrichment of pathogenic de novo mutations in the most constrained CCRs, after excluding benign and pathogenic mutations on the basis of their presence in gnomAD. The 95% CI error bars are 0.59–0.85 for the 0–20 percentile bin, 0.60–0.84 for the 20–80 percentile bin, 0.72–1.28 for the 80–90 percentile bin, 1.13–2.56 for the 90–95 percentile bin, and 3.16–6.81 for the 95–100 percentile bin. d, ROC analysis for the developmental disorder de novo variant evaluation set from c. Of the 3,400 pathogenic and 731 benign mutations, each tool scored (M pathogenic; N benign): CCR (3,108; 670), CADD (3,399; 731), GERP++ (3,400; 731), MPC (3,221; 704), REVEL (3,368; 726), pLI (3,283; 709), MTR (3,389; 728). CIs for each metric’s ROC AUC in b: CCR (0.711–0.745), CADD (0.567–0.603), GERP++ (0.542–0.579), MPC (0.643–0.676), REVEL (0.612–0.646), pLI (0.586–0.622), MTR (0.608–0.642). CIs for the ROC AUCs in d: CCR (0.586–0.629), CADD (0.581–0.624), GERP++ (0.509–0.556), MPC 0.627–0.667), REVEL (0.593–0.635), pLI (0.576–0.621), MTR (0.598–0.639).

References

    1. Wallis WA The statistical research group, 1942–1945. J. Am. Stat. Assoc 75, 320–330 (1980).
    1. Petrovski S, Wang Q, Heinzen EL, Allen AS & Goldstein DB Genic intolerance to functional variation and the interpretation of personal genomes. PLoS Genet 9, e1003709 (2013). - PMC - PubMed
    1. Fu W et al. Analysis of 6,515 exomes reveals the recent origin of most human protein-coding variants. Nature 493, 216–220 (2013). - PMC - PubMed
    1. Lek M et al. Analysis of protein-coding genetic variation in 60,706 humans. Nature 536, 285–291 (2016). - PMC - PubMed
    1. Samocha KE et al. A framework for the interpretation of de novo mutation in human disease. Nat. Genet 46, 944–950 (2014). - PMC - PubMed

Publication types