. 2018 Dec 11;9(1):5149.
doi: 10.1038/s41467-018-07592-1.

Functional biodiversity loss along natural CO2 gradients

Affiliations

Functional biodiversity loss along natural CO2 gradients

Nuria Teixidó et al. Nat Commun. .

Abstract

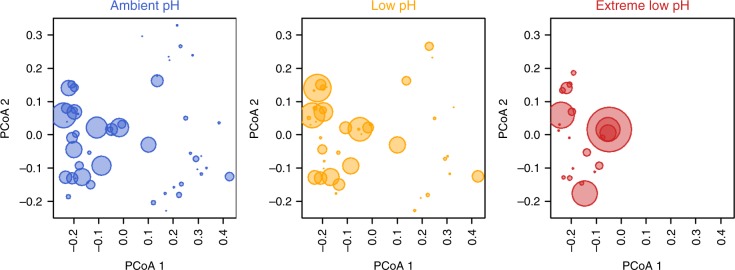
The effects of environmental change on biodiversity are still poorly understood. In particular, the consequences of shifts in species composition for marine ecosystem function are largely unknown. Here we assess the loss of functional diversity, i.e. the range of species biological traits, in benthic marine communities exposed to ocean acidification (OA) by using natural CO2 vent systems. We found that functional richness is greatly reduced with acidification, and that functional loss is more pronounced than the corresponding decrease in taxonomic diversity. In acidified conditions, most organisms accounted for a few functional entities (i.e. unique combination of functional traits), resulting in low functional redundancy. These results suggest that functional richness is not buffered by functional redundancy under OA, even in highly diverse assemblages, such as rocky benthic communities.


Conflict of interest statement

The authors declare no competing interests.

Figures

Fig. 1
Fig. 1
Species and functional diversity changes among pH zones. a Barplots show species richness (Sp), number of functional entities (unique trait combinations, FE) and functional richness (volume filled by each assemblage in the four dimensions of the functional space, Vol. 4D). Values are expressed as a relative percentage of the value for the total pool and are displayed above the bars. b Functional space filled by the functional entities (FEs) present in species assemblages from each pH condition. Axes (PCoA1 and PCoA2) represent the first two dimensions of the 4D functional space. Principal coordinate analysis (PCoA) was computed on functional-trait values. Number of species = 72; number of FEs = 68
Fig. 2
Fig. 2
Overall distribution of FE abundance across the functional space. Each point represents a functional entity (i.e. unique combination of functional attributes) and the size of the circles is proportional to the relative cover of the species belonging to a certain functional entity. Number of species = 72; number of FEs = 68
Fig. 3
Fig. 3
Change in relative abundance of functional-trait categories along the pH gradient. Stacked bar graphs show relative abundance of each trait category. Colour scales refer to categories for each trait. Some categories are not visible because their relative abundance is <1 % (see Supplementary Table 5 for abundances). Morphological form: (a) boring, (b) filaments, (c) stolonial, (d) encrusting, (e) encrusting, leaf-like, with blades, (f) foliose erect thallus, sheets/blades, (g) coarsely branched, (h) articulated, (i) cup-like, (j) massive encrusting, (k) massive-hemispheric, (l) massive-erect, (m) tree-like; solitary-colonial: (1) solitary, (2) gregarious, (3) colonial; maximum longevity: (1) weeks, (2) 3–11 months, (3) 1 year, (4) 2 years, (5) 5 years, (6) 10–20 years, (7) >20 years; height: (1) up to 1 mm, (2) 1–10 mm, (3) 10–50 mm, (4) 50–200 mm, (5) 200–500 mm; width: (2) 0.1–1 mm, (3) 1–10 mm, (4) 10–50 mm, (5) 50–200 mm, (6) >200 mm; epibiosi: (1) obligate, (2) facultative, (3) ever; energetic resource: (1) photosynthetic autotroph, (2) photo-heterotroph, (3) heterotroph; photosynthetic pigments: (a) no, (b) Chl a, Chl b, β-carotene, xanthophyll (e.g. green algae), (c) Chl a, xanthophyll /fucoxanthin, Chl c1 + c2 (e.g. brown algae), (d) Chl a, chlorophyll c2, peridinin (e.g. dinoflagellates, present in invertebrates), (e) Chl a, phycocyanin, phycoerythrin (e.g. red algae), (f) Chl a, phycocyanin (cyanobacteria present in sponges), (h) mixture of, (a), (b), (c), (e) (e.g. turf); feeding: (a) no (autotroph), (b) active filter feeders with cilia, (c) active filter feeders by pumping, (d) passive filter feeders, (e) herbivores/grazers; age reproductive maturity: (1) weeks, (2) 3–5 months, (3) 6–11 months, (4) 1 year, (5) 2 years, (6) 2–5 years; asexual reproduction: (1) no, (2) yes; growth rates: (1) extreme slow (<1 cm/year), (2) slow (1 cm/year), (3) moderate (>1 cm/year), (4) high (5–10 cm/year), (5) very high (>10 cm/year); calcification: (a) without, (b) non-calcareous spicules, (c) calcareous spicules and sclerites, (e) carbonate with discontinuities, (f) continuous carbonate; chemical defenses: (1) no, (2) yes; mobility: (1) sessile, (2) vagile. See Supplementary Table 2 for trait category descriptions. Traits, n = 15; trait categories, n = 73
Fig. 4
Fig. 4
Taxonomic and functional biodiversity loss along the pH gradient. The ambient pH zone is characterized by a mosaic of strategies, from ‘faster’ to ‘slower’ life histories, from encrusting to massive and erect forms, including a variety of sizes, both photosynthetic autotrophy and heterotrophy (including filter feeders and grazers/herbivores), and the presence of calcareous skeletons. The low pH zone is mainly characterized by fleshy morphologies, seasonal population dynamics, fast growth and is mainly composed of non-calcareous organisms, where photosynthetic autotrophy is the major energetic resource. The conditions in low pH zones are used to represent atmospheric carbon dioxide concentration values under future climatic conditions with a decrease in surface pH from −0.14 to −0.4 pH units under IPCC RCP2.6 and RCP8.5 by 2100 relative to 1870. The extreme low pH zone is dominated by encrusting-fleshy forms, ‘fast' growth, non-calcareous organisms and photosynthetic autotrophy as the only energetic resource. The encrusting red form is Hildenbrandia crouaniorum, a non-calcareous, perennial red algae. This extreme low pH zone is used to represent more extreme scenarios based on high CO2 emissions or the more distant future by 2500. See Table 1 for names of selected species supporting ecological functions

References

    1. Cardinale BJ, et al. Biodiversity loss and its impact on humanity. Nature. 2012;486:59–67. doi: 10.1038/nature11148. - DOI - PubMed
    1. Balvanera P, et al. Linking biodiversity and ecosystem services: current uncertainties and the necessary next steps. Bioscience. 2014;64:49–57. doi: 10.1093/biosci/bit003. - DOI
    1. Isbell F, et al. Linking the influence and dependence of people on biodiversity across scales. Nature. 2017;546:65–72. doi: 10.1038/nature22899. - DOI - PMC - PubMed
    1. Poloczanska ES, et al. Global imprint of climate change on marine life. Nat. Clim. Chang. 2013;3:919–925. doi: 10.1038/nclimate1958. - DOI
    1. Dirzo R, et al. Defaunation in the Antrhopocene. Science (80-). 2014;401:401–406. doi: 10.1126/science.1251817. - DOI - PubMed

Publication types

LinkOut - more resources