

SAXS-guided Enhanced Unbiased Sampling for Structure Determination of Proteins and Complexes
- PMID: 30531946
- PMCID: PMC6288155
- DOI: 10.1038/s41598-018-36090-z
SAXS-guided Enhanced Unbiased Sampling for Structure Determination of Proteins and Complexes
Abstract
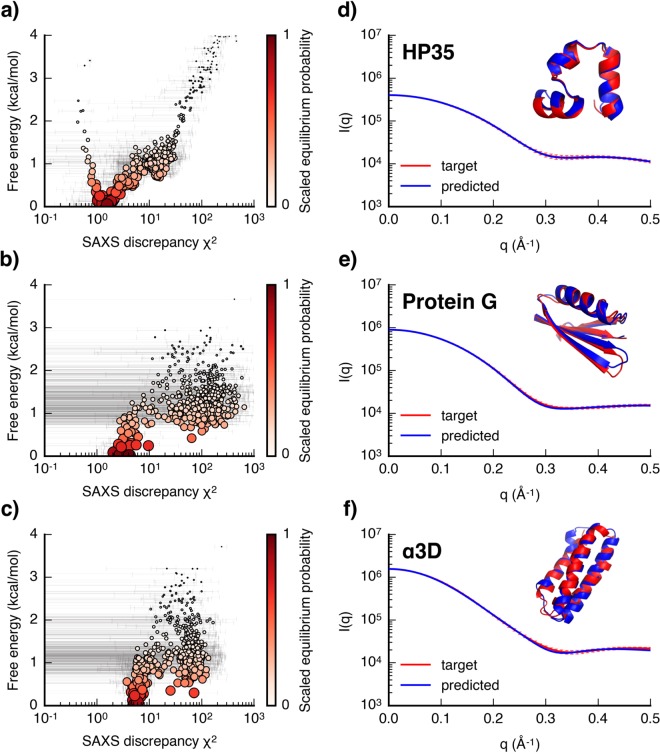
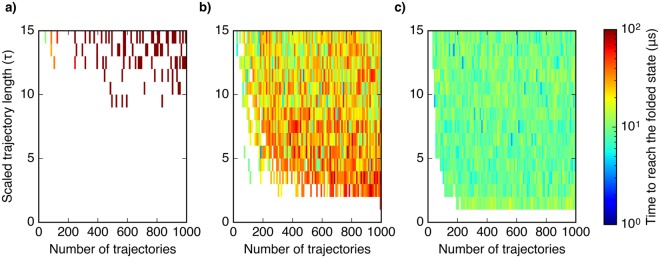
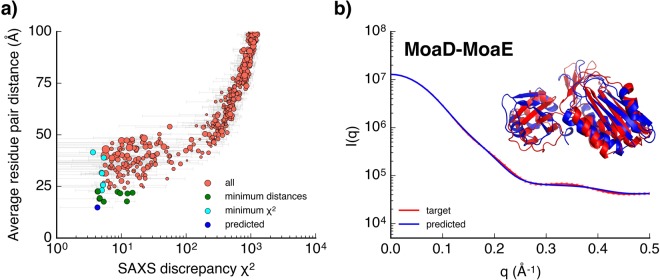
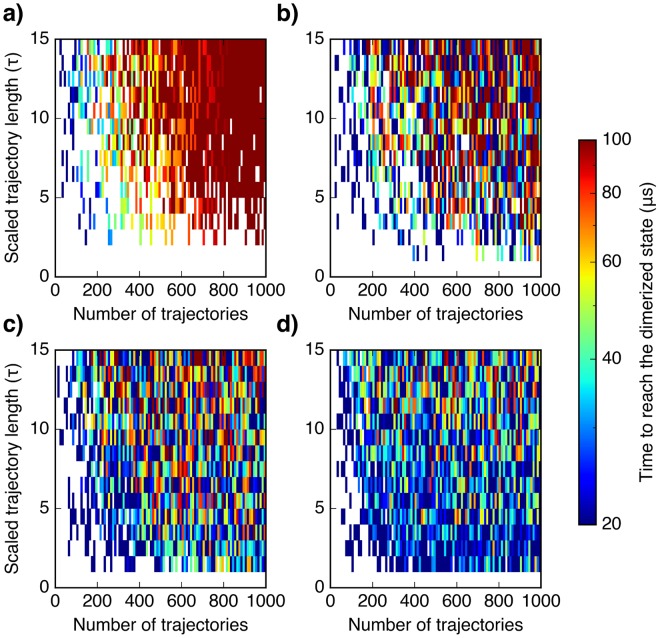
Molecular simulations can be utilized to predict protein structure ensembles and dynamics, though sufficient sampling of molecular ensembles and identification of key biologically relevant conformations remains challenging. Low-resolution experimental techniques provide valuable structural information on biomolecule at near-native conditions, which are often combined with molecular simulations to determine and refine protein structural ensembles. In this study, we demonstrate how small angle x-ray scattering (SAXS) information can be incorporated in Markov state model-based adaptive sampling strategy to enhance time efficiency of unbiased MD simulations and identify functionally relevant conformations of proteins and complexes. Our results show that using SAXS data combined with additional information, such as thermodynamics and distance restraints, we are able to distinguish otherwise degenerate structures due to the inherent ambiguity of SAXS pattern. We further demonstrate that adaptive sampling guided by SAXS and hybrid information can significantly reduce the computation time required to discover target structures. Overall, our findings demonstrate the potential of this hybrid approach in predicting near-native structures of proteins and complexes. Other low-resolution experimental information can be incorporated in a similar manner to collectively enhance unbiased sampling and improve the accuracy of structure prediction from simulation.
Conflict of interest statement
The authors declare no competing interests.
Figures
Similar articles
-
Hybrid Methods for Modeling Protein Structures Using Molecular Dynamics Simulations and Small-Angle X-Ray Scattering Data.Adv Exp Med Biol. 2018;1105:237-258. doi: 10.1007/978-981-13-2200-6_15. Adv Exp Med Biol. 2018. PMID: 30617833 Review.
-
Molecular Dynamics Simulations Combined with Nuclear Magnetic Resonance and/or Small-Angle X-ray Scattering Data for Characterizing Intrinsically Disordered Protein Conformational Ensembles.J Chem Inf Model. 2019 May 28;59(5):1743-1758. doi: 10.1021/acs.jcim.8b00928. Epub 2019 Mar 18. J Chem Inf Model. 2019. PMID: 30840442 Review.
-
Determination of Protein Structural Ensembles by Hybrid-Resolution SAXS Restrained Molecular Dynamics.J Chem Theory Comput. 2020 Apr 14;16(4):2825-2834. doi: 10.1021/acs.jctc.9b01181. Epub 2020 Mar 11. J Chem Theory Comput. 2020. PMID: 32119546 Free PMC article.
-
Interpreting solution X-ray scattering data using molecular simulations.Curr Opin Struct Biol. 2018 Apr;49:18-26. doi: 10.1016/j.sbi.2017.11.002. Epub 2017 Nov 21. Curr Opin Struct Biol. 2018. PMID: 29172147 Review.
-
Rapid interpretation of small-angle X-ray scattering data.PLoS Comput Biol. 2019 Mar 22;15(3):e1006900. doi: 10.1371/journal.pcbi.1006900. eCollection 2019 Mar. PLoS Comput Biol. 2019. PMID: 30901335 Free PMC article.
Cited by
-
Connecting Diffraction Experiments and Network Analysis Tools for the Study of Hydrogen-Bonded Networks.J Phys Chem B. 2023 Apr 13;127(14):3109-3118. doi: 10.1021/acs.jpcb.2c07740. Epub 2023 Mar 30. J Phys Chem B. 2023. PMID: 36995795 Free PMC article. Review.
-
Improving integrative 3D modeling into low- to medium-resolution electron microscopy structures with evolutionary couplings.Protein Sci. 2021 May;30(5):1006-1021. doi: 10.1002/pro.4067. Epub 2021 Apr 9. Protein Sci. 2021. PMID: 33759266 Free PMC article.
-
Molecular Dynamics Simulations in Protein-Protein Docking.Methods Mol Biol. 2024;2780:91-106. doi: 10.1007/978-1-0716-3985-6_6. Methods Mol Biol. 2024. PMID: 38987465
-
Visualizing RNA Structures by SAXS-Driven MD Simulations.Front Bioinform. 2022 Feb 18;2:781949. doi: 10.3389/fbinf.2022.781949. eCollection 2022. Front Bioinform. 2022. PMID: 36304317 Free PMC article.
-
The Structural and Functional Diversity of Intrinsically Disordered Regions in Transmembrane Proteins.J Membr Biol. 2019 Oct;252(4-5):273-292. doi: 10.1007/s00232-019-00069-2. Epub 2019 May 28. J Membr Biol. 2019. PMID: 31139867 Free PMC article. Review.
References
Publication types
MeSH terms
Substances
LinkOut - more resources
Full Text Sources
