. 2018 Dec 7;8(1):17728.
doi: 10.1038/s41598-018-36034-7.

Patterns of wild carnivore attacks on humans in urban areas

Affiliations

Patterns of wild carnivore attacks on humans in urban areas

Giulia Bombieri et al. Sci Rep. .

Abstract

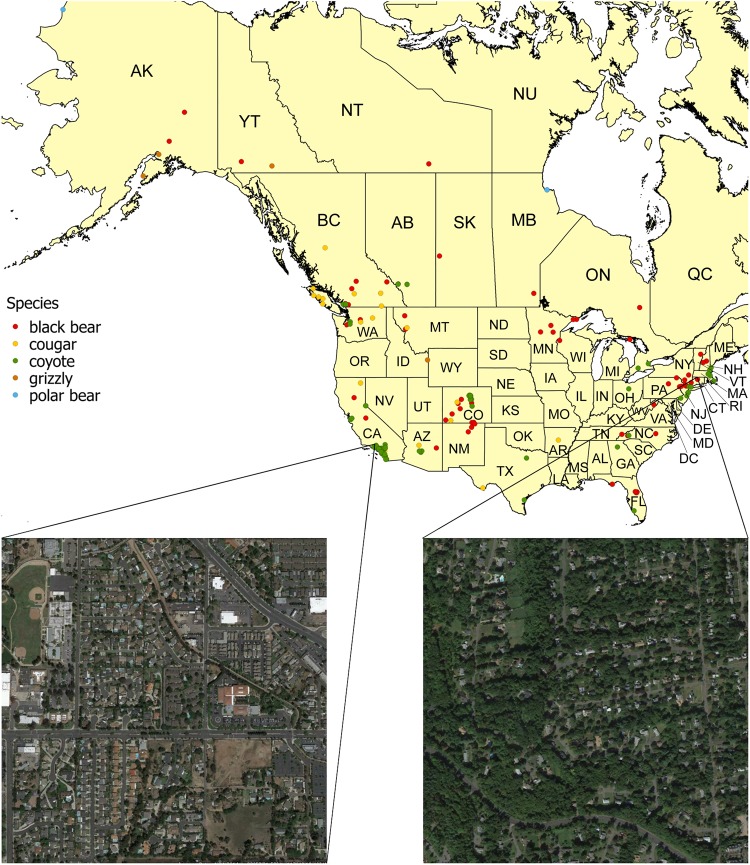
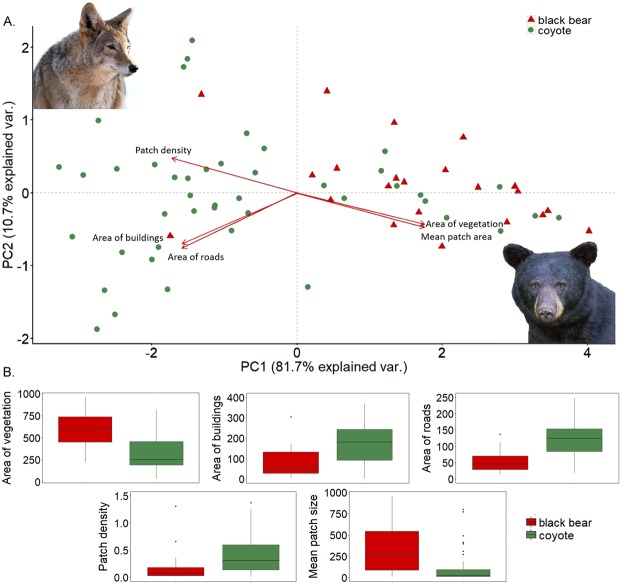
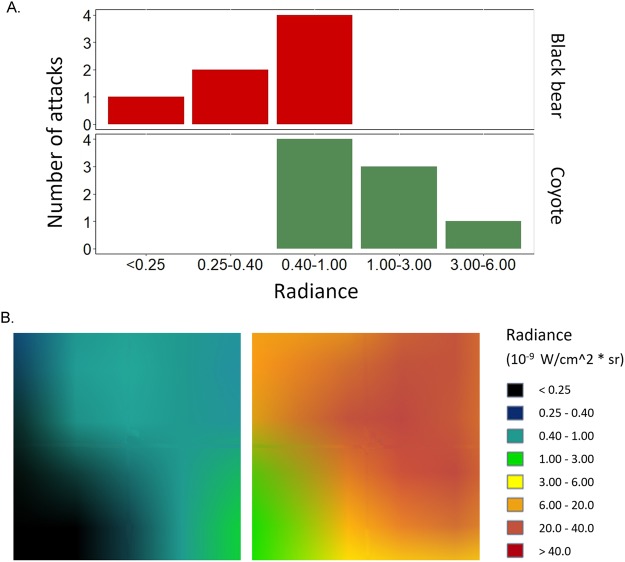
Attacks by wild carnivores on humans represent an increasing problem in urban areas across North America and their frequency is expected to rise following urban expansion towards carnivore habitats. Here, we analyzed records of carnivore attacks on humans in urban areas of the U.S. and Canada between 1980 and 2016 to analyze the general patterns of the attacks, as well as describe the landscape structure and, for those attacks occurring at night, the light conditions at the site of the attacks. We found that several behavioral and landscape-related factors were recurrent elements in the attacks recorded. The species for which the attack locations were available (coyote and black bear) attacked in areas with different conditions of landscape structure and artificial light. Specifically, black bears attacked more frequently in areas with abundant and aggregated vegetation cover and scarce buildings and roads, while coyotes attacked in a broader range of landscape conditions. At night, black bears attacked in generally darker areas than coyotes. By providing a comprehensive perspective of the phenomenon, this study will improve our understanding of how effective strategies aimed at reducing the frequency of risky encounters in urban areas should be developed.


Conflict of interest statement

The authors declare no competing interests.

Figures

Figure 1
Figure 1
Map of the spatial distribution of wild carnivore attacks on humans recorded in North American urban areas between 1980 and 2016. As an example of the landscape structure analyzed in this study, two 1 km2 maps centered at the point of the attack are also shown. The map was created using QGIS software. Boundary layers for Canada and U. S. were obtained from the Statistics Canada Catalogue and United States Census Bureau respectively. The two satellite images were obtained from the Google Earth Pro application. Left image: Google Earth 7.3.1. (Imagery Date: April 24, 2014). California, U.S. 33°53′16.00″N, 117°48′40.04″W. Landsat/Copernicus. https://www.google.com/earth/ [September 20, 2017]. Right image: Google Earth 7.3.1. (Imagery Date: September 20, 2013). Connecticut, U.S. 41°47′24.87″N, 72°45′32.29″W. Landsat/Copernicus. https://www.google.com/earth/ [September 20, 2017].
Figure 2
Figure 2
(A) Outcome of the PCA run on the 5 landscape variables for black bears (n = 22) and coyotes (n = 47), the species for which the exact location of the attacks was available. Each point represents one attack and arrows show the direction of the variables considered, with variable values increasing according to the direction of the arrow. PC1 and PC2 explained 81.7% and 10.7% of the variance, respectively. (B) Boxplots depicting how values of each landscape parameter differ between the two species considered (the coyote photo was downloaded from 123RF ROYALTY FREE STOCK PHOTOS, www.123rf.com, Image ID 52238509, copyright Koji Hirano, https://www.123rf.com/stock-photo/close_up_image_of_coyote.html?oriSearch=a+portrait+showing+the+expressive+eyes+of+a+large+black+bear++ursus+americanus++in+the+mountians&sti=mshqs5mkzdbtehq90h|&mediapopup=52238509; the black bear photo was downloaded from 123RF ROYALTY FREE STOCK PHOTOS, www.123rf.com, Image ID 69859949, copyright cuttsnaturephotography, https://www.123rf.com/stock-photo/a_portrait_showing_the_expressive_eyes_of_a_large_black_bear_(ursus_americanus)_in_the_mountians.html?&sti=mz65utjpox4ztzb2zg|&mediapopup=69859949).
Figure 3
Figure 3
Artificial light conditions for those sites where the attack occurred at night. (A) Frequencies of the different ranges of radiance for the two species for which exact locations were available, i.e., coyotes (n = 8) and black bears (n = 7). (B) Two 1 km2 plots centered at the point of the attack are presented as an example of the artificial light conditions analyzed. Each range of radiance is assigned a different color, from black (radiance <0.25, i.e., no artificial light) to dark-red (radiance >40, i.e., highest amount of artificial light) (see the main text for more details). The two images were obtained from the website https://www.lightpollutionmap.info.

References

    1. Baker RO, Timm RM. Coyote attacks on humans. 1970–2015: implications for reducing the risks. 2017;11:120–132.
    1. Evans MJ, Hawley JE, Rego PW, Rittenhouse TAG. Exurban land use facilitates human-black bear conflicts. J. Wildl. Manage. 2014;78:1477–1485. doi: 10.1002/jwmg.796. - DOI
    1. Don Carlos AW, Bright AD, Teel TL, Vaske JJ. Human-black bear conflict in urban areas: An integrated approach to management response. Hum. Dimens. Wildl. 2009;14:174–184. doi: 10.1080/10871200902839316. - DOI
    1. Merkle JA, Krausman PR, Decesare NJ, Jonkel JJ. Predicting spatial distribution of human-black bear interactions in urban areas. J. Wildl. Manage. 2011;75:1121–1127. doi: 10.1002/jwmg.153. - DOI
    1. Poessel SA, Gese EM, Young JK. Environmental factors influencing the occurrence of coyotes and conflicts in urban areas. Landsc. Urban Plan. 2017;157:259–269. doi: 10.1016/j.landurbplan.2016.05.022. - DOI

Publication types