

Modeling genome-wide enzyme evolution predicts strong epistasis underlying catalytic turnover rates
- PMID: 30532008
- PMCID: PMC6288127
- DOI: 10.1038/s41467-018-07649-1
Modeling genome-wide enzyme evolution predicts strong epistasis underlying catalytic turnover rates
Abstract
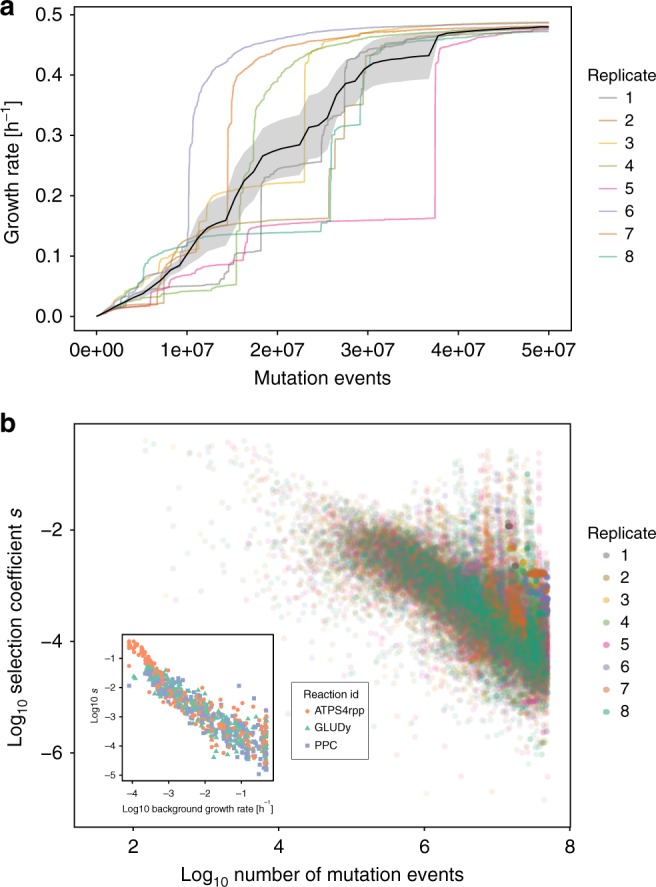
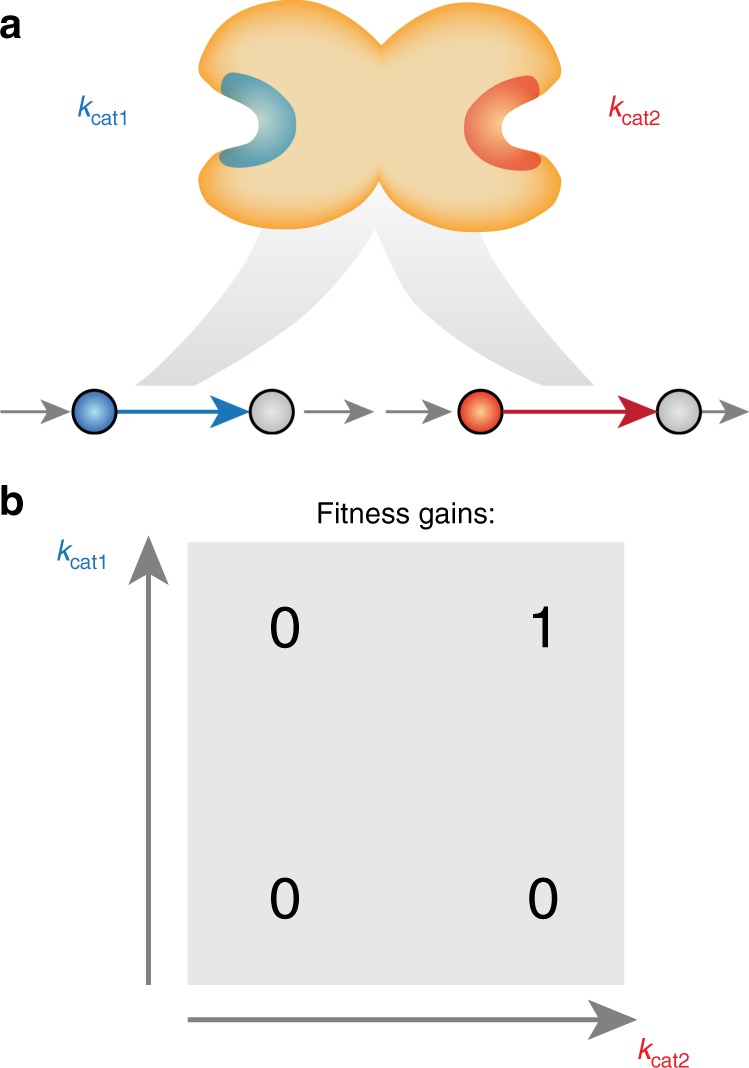
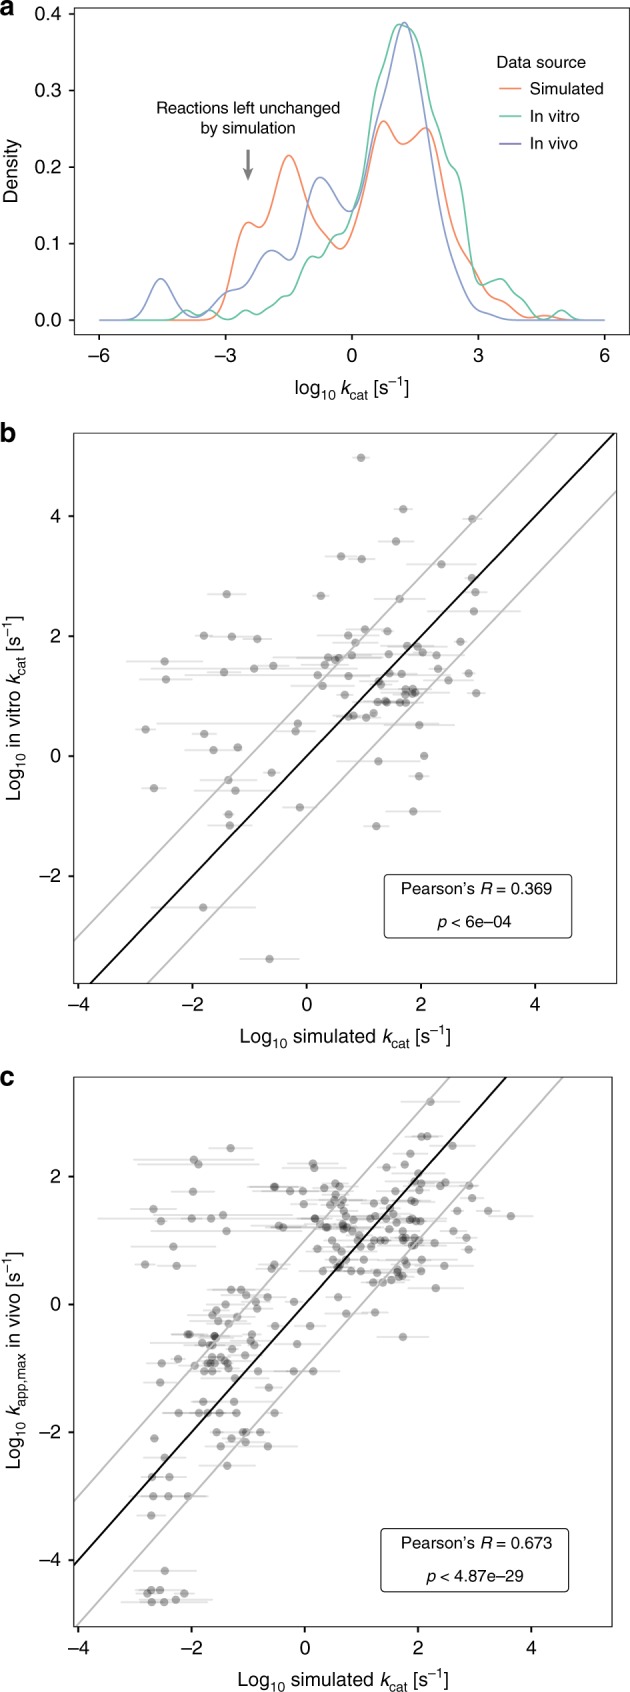
Systems biology describes cellular phenotypes as properties that emerge from the complex interactions of individual system components. Little is known about how these interactions have affected the evolution of metabolic enzymes. Here, we combine genome-scale metabolic modeling with population genetics models to simulate the evolution of enzyme turnover numbers (kcats) from a theoretical ancestor with inefficient enzymes. This systems view of biochemical evolution reveals strong epistatic interactions between metabolic genes that shape evolutionary trajectories and influence the magnitude of evolved kcats. Diminishing returns epistasis prevents enzymes from developing higher kcats in all reactions and keeps the organism far from the potential fitness optimum. Multifunctional enzymes cause synergistic epistasis that slows down adaptation. The resulting fitness landscape allows kcat evolution to be convergent. Predicted kcat parameters show a significant correlation with experimental data, validating our modeling approach. Our analysis reveals how evolutionary forces shape modern kcats and the whole of metabolism.
Conflict of interest statement
The authors declare no competing interests.
Figures

Similar articles
-
Principles of transcriptional regulation and evolution of the metabolic system in E. coli.Genome Res. 2009 Jan;19(1):79-91. doi: 10.1101/gr.079715.108. Epub 2008 Oct 3. Genome Res. 2009. PMID: 18836036 Free PMC article.
-
Network-level architecture and the evolutionary potential of underground metabolism.Proc Natl Acad Sci U S A. 2014 Aug 12;111(32):11762-7. doi: 10.1073/pnas.1406102111. Epub 2014 Jul 28. Proc Natl Acad Sci U S A. 2014. PMID: 25071190 Free PMC article.
-
Enzyme promiscuity shapes adaptation to novel growth substrates.Mol Syst Biol. 2019 Apr 8;15(4):e8462. doi: 10.15252/msb.20188462. Mol Syst Biol. 2019. PMID: 30962359 Free PMC article.
-
Genomic investigations of evolutionary dynamics and epistasis in microbial evolution experiments.Curr Opin Genet Dev. 2015 Dec;35:33-9. doi: 10.1016/j.gde.2015.08.008. Epub 2015 Sep 14. Curr Opin Genet Dev. 2015. PMID: 26370471 Free PMC article. Review.
-
Enzyme engineering: reaching the maximal catalytic efficiency peak.Curr Opin Struct Biol. 2017 Dec;47:140-150. doi: 10.1016/j.sbi.2017.09.002. Epub 2017 Oct 16. Curr Opin Struct Biol. 2017. PMID: 29035814 Review.
Cited by
-
Principles of metabolome conservation in animals.Proc Natl Acad Sci U S A. 2023 Aug 29;120(35):e2302147120. doi: 10.1073/pnas.2302147120. Epub 2023 Aug 21. Proc Natl Acad Sci U S A. 2023. PMID: 37603743 Free PMC article.
-
Optimal enzyme utilization suggests that concentrations and thermodynamics determine binding mechanisms and enzyme saturations.Nat Commun. 2023 May 5;14(1):2618. doi: 10.1038/s41467-023-38159-4. Nat Commun. 2023. PMID: 37147292 Free PMC article.
-
Kinetic profiling of metabolic specialists demonstrates stability and consistency of in vivo enzyme turnover numbers.Proc Natl Acad Sci U S A. 2020 Sep 15;117(37):23182-23190. doi: 10.1073/pnas.2001562117. Epub 2020 Sep 1. Proc Natl Acad Sci U S A. 2020. PMID: 32873645 Free PMC article.
-
Machine learning applied to enzyme turnover numbers reveals protein structural correlates and improves metabolic models.Nat Commun. 2018 Dec 7;9(1):5252. doi: 10.1038/s41467-018-07652-6. Nat Commun. 2018. PMID: 30531987 Free PMC article.
References
Publication types
MeSH terms
Substances
LinkOut - more resources
Full Text Sources
Miscellaneous
