. 2018 Dec 7;9(1):5237.
doi: 10.1038/s41467-018-07622-y.

Closing the gap between palaeontological and neontological speciation and extinction rate estimates

Affiliations

Closing the gap between palaeontological and neontological speciation and extinction rate estimates

Daniele Silvestro et al. Nat Commun. .

Abstract

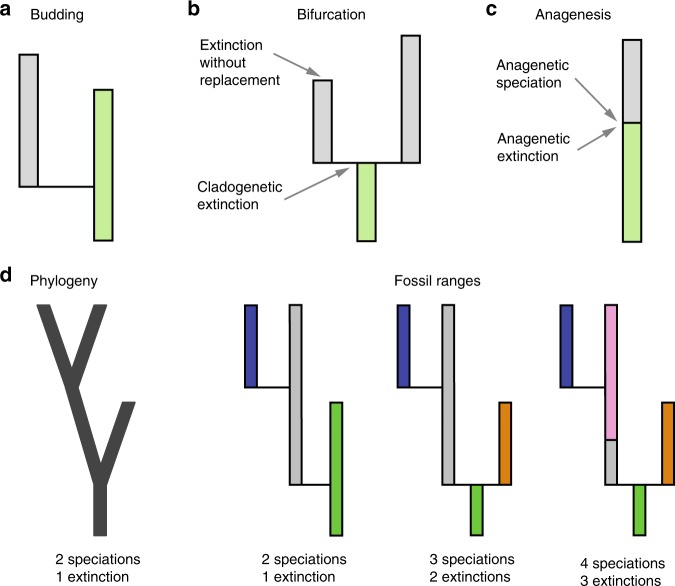
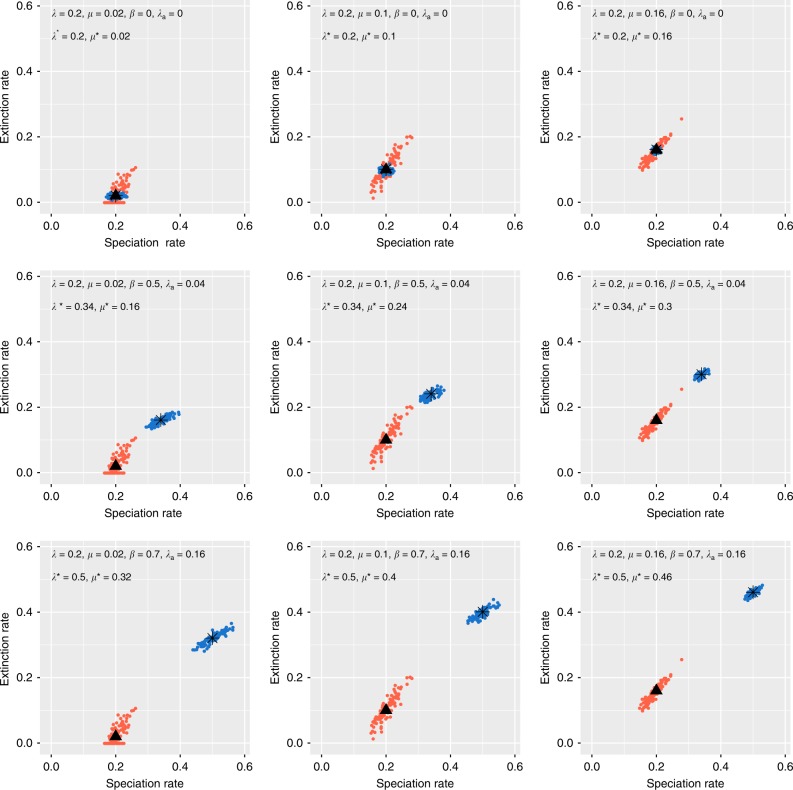
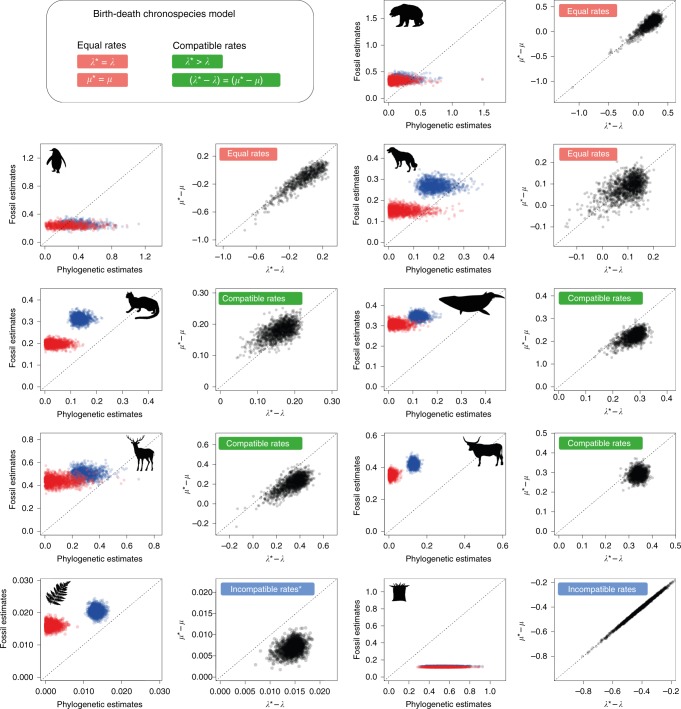
Measuring the pace at which speciation and extinction occur is fundamental to understanding the origin and evolution of biodiversity. Both the fossil record and molecular phylogenies of living species can provide independent estimates of speciation and extinction rates, but often produce strikingly divergent results. Despite its implications, the theoretical reasons for this discrepancy remain unknown. Here, we reveal a conceptual and methodological basis able to reconcile palaeontological and molecular evidence: discrepancies are driven by different implicit assumptions about the processes of speciation and species evolution in palaeontological and neontological analyses. We present the "birth-death chronospecies" model that clarifies the definition of speciation and extinction processes allowing for a coherent joint analysis of fossil and phylogenetic data. Using simulations and empirical analyses we demonstrate not only that this model explains much of the apparent incongruence between fossils and phylogenies, but that differences in rate estimates are actually informative about the prevalence of different speciation modes.


Conflict of interest statement

The authors declare no competing interests.

Figures

Fig. 1
Fig. 1
Speciation modes reflecting the difference in phylogenetic and stratigraphic interpretations of speciation and extinction rates. ac Three alternative modes of speciation. Each rectangle corresponds to a distinct species with green-shaded rectangles representing ancestral species. a Cladogenesis via budding: one new species arises, the ancestral species survives. This type of speciation happens with rate λ(1 − β) in the BDC model. b Cladogenesis via bifurcation: the ancestral species goes extinct and two new species arise with rate λβ. c Anagenesis: the ancestral species goes extinct and is replaced by one new species with rate λa. d Phylogenetic versus stratigraphic interpretations of speciation and extinction rates. The phylogeny on the left describes three possible speciation histories (three coloured trees on the right). The coloured segments represent distinct (morpho)species. Phylogenetic estimates of speciation and extinction rates, λ and μ, differ from fossil-based estimates, λ* and μ*, in two out of the three cases. The rates are only the same in the case of pure budding speciation (the first coloured tree from the left)
Fig. 2
Fig. 2
Simulations of fossil and phylogenetic data under the BDC model. We simulated different proportions of cladogenesis via budding or bifurcation, anagenetic speciation, and extinction without replacement. Phylogenetic estimates of the speciation and extinction rates (λ, μ) are shown in red with black triangles representing the true values. The speciation and extinction rates (λ*, μ*) estimated from fossil ranges are shown in blue with black stars representing the true values
Fig. 3
Fig. 3
Results from a Bayesian analysis of fossil and phylogenetic data for nine clades. Posterior samples of speciation rates (in blue) and extinction rates (in red) jointly inferred from the two data types are plotted against one another; posterior samples of the two terms of Eq. (5) are shown in black. The results shown here are based on the assumption of constant rates through time. The clades include (from top to bottom): Ursidae, Sphenisciformes, Canidae, Feliformia, Cetacea, Cervidae, Bovidae, ferns and allies, and Scleractinia (see also Methods; animal silhouettes from www.phylopic.org; fern silhouette from www.publicdomainpictures.net). Although the analyses were run assuming independent rates (λ, μ, λ*, μ*), their joint posterior samples were used to assess which model (equal rates, compatible rates, or incompatible rates) best fit the data. The best model, indicated by the labels in the plots, is based on whether the posterior samples conform to the properties of the models (summarised in the top left panel) using a 99% threshold for significance. Consistent results were also obtained in a maximum likelihood framework (Table 1). The equal rates model is supported in three data sets, i.e. stratigraphic and phylogenetic rates are not significantly different. Stratigraphic and phylogenetic speciation and extinction rates are significantly different in four data sets, but compatible with the expectations of the BDC model. Finally, origination and extinction rates are significantly different in two data sets and the discrepancy cannot be explained by different speciation modes. However, the fern data set (bottom left) supported a BDC model after accounting for rate variation through time (Fig. 5)
Fig. 4
Fig. 4
Prevalent mode of speciation inferred under the BDC model. Although the exact contribution of different speciation modes cannot be quantified under the BDC model, the joint analysis of fossil and phylogenetic data is informative about the relative importance of budding versus anagenetic speciation. The four clades shown here (Bovidae, Cetacea, Feliformia, Cervidae) show support for diversification under the compatible rates model, meaning stratigraphic and phylogenetic estimates of speciation and extinction rates are different, but can be explained by differences in speciation mode (Fig. 3). Based on the properties of the BDC model, positive values of λ* − 2λ (posterior distributions from a joint Bayesian analysis shown as density plots) indicate that the rate of anagenetic speciation exceeds the rate of budding speciation, whereas the opposite is true for negative values
Fig. 5
Fig. 5
Analysis of the fern data set under the BDC skyline model. Origination and extinction rates were jointly inferred within each time bin from the fossil record and phylogenetic tree, under the constraints imposed by the BDC model. Prevalent modes of origination (in green) indicate that, as expected for a genus level data set, budding was more important than anagenetic origination, and that there is a low but non-zero rate of bifurcation and anagenesis. Origination and extinction rates inferred from fossils and from the phylogeny of ferns show a substantial amount of variation through time with a general tendency to decrease over time, although the net diversification remains positive in most of the time bins

Similar articles

Cited by

References

    1. Raup DM. Taxonomic survivorship curves and Van Valen’s law. Paleobiology. 1975;1:82–96. doi: 10.1017/S0094837300002220. - DOI
    1. Sepkoski JJ. A kinetic-model of phanerozoic taxonomic diversity; i. analysis of marine orders. Paleobiology. 1978;4:223–251. doi: 10.1017/S0094837300005972. - DOI
    1. Alroy J, et al. Phanerozoic trends in the global diversity of marine invertebrates. Science. 2008;321:97–100. doi: 10.1126/science.1156963. - DOI - PubMed
    1. Niklas KJ, Tiffney BH, Knoll AH. Patterns in vascular land plant diversification. Nature. 1983;303:614–616. doi: 10.1038/303614a0. - DOI
    1. Nee S. Birth−death models in macroevolution. Annu. Rev. Ecol. Evol. Syst. 2006;37:1–17. doi: 10.1146/annurev.ecolsys.37.091305.110035. - DOI

Publication types