

A phenotypic Caenorhabditis elegans screen identifies a selective suppressor of antipsychotic-induced hyperphagia
- PMID: 30532051
- PMCID: PMC6288085
- DOI: 10.1038/s41467-018-07684-y
A phenotypic Caenorhabditis elegans screen identifies a selective suppressor of antipsychotic-induced hyperphagia
Abstract
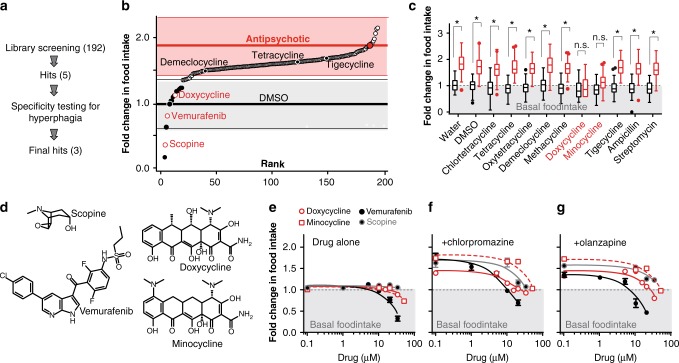
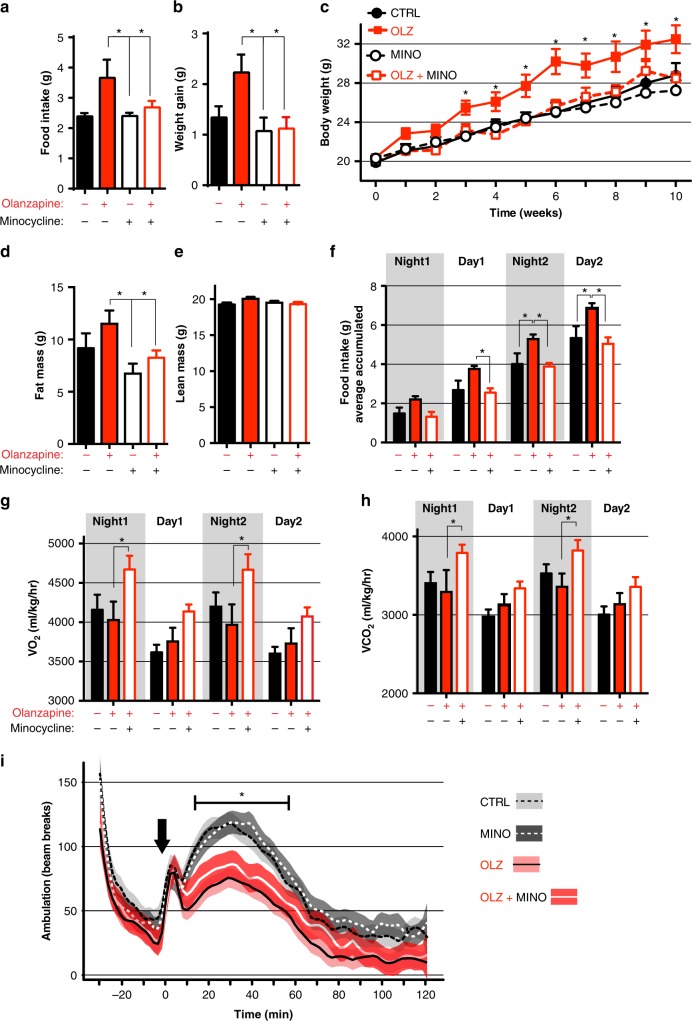
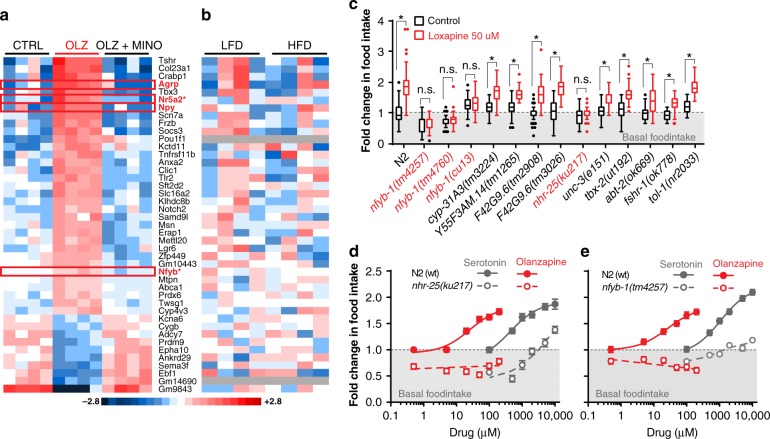
Antipsychotic (AP) drugs are used to treat psychiatric disorders but are associated with significant weight gain and metabolic disease. Increased food intake (hyperphagia) appears to be a driving force by which APs induce weight gain but the mechanisms are poorly understood. Here we report that administration of APs to C. elegans induces hyperphagia by a mechanism that is genetically distinct from basal food intake. We exploit this finding to screen for adjuvant drugs that suppress AP-induced hyperphagia in C. elegans and mice. In mice AP-induced hyperphagia is associated with a unique hypothalamic gene expression signature that is abrogated by adjuvant drug treatment. Genetic analysis of this signature using C. elegans identifies two transcription factors, nhr-25/Nr5a2 and nfyb-1/NFYB to be required for AP-induced hyperphagia. Our study reveals that AP-induced hyperphagia can be selectively suppressed without affecting basal food intake allowing for novel drug discovery strategies to combat AP-induced metabolic side effects.
Conflict of interest statement
The authors declare no competing interests.
Figures

Similar articles
-
Nuclear receptor 5A2 regulation of Agrp underlies olanzapine-induced hyperphagia.Mol Psychiatry. 2023 May;28(5):1857-1867. doi: 10.1038/s41380-023-01981-9. Epub 2023 Feb 10. Mol Psychiatry. 2023. PMID: 36765131 Free PMC article. Review.
-
Metabolomic profiles associated with a mouse model of antipsychotic-induced food intake and weight gain.Sci Rep. 2020 Oct 29;10(1):18581. doi: 10.1038/s41598-020-75624-2. Sci Rep. 2020. PMID: 33122657 Free PMC article.
-
A role of neuropeptide CART in hyperphagia and weight gain induced by olanzapine treatment in rats.Brain Res. 2018 Sep 15;1695:45-52. doi: 10.1016/j.brainres.2018.05.014. Epub 2018 May 15. Brain Res. 2018. PMID: 29775565
-
The NF-Y complex negatively regulates Caenorhabditis elegans tbx-2 expression.Dev Biol. 2013 Oct 1;382(1):38-47. doi: 10.1016/j.ydbio.2013.08.001. Epub 2013 Aug 8. Dev Biol. 2013. PMID: 23933492 Free PMC article.
-
A passport to neurotransmitter identity.Genome Biol. 2009;10(7):229. doi: 10.1186/gb-2009-10-7-229. Epub 2009 Jul 1. Genome Biol. 2009. PMID: 19591649 Free PMC article. Review.
Cited by
-
Methylglyoxal-derived hydroimidazolone, MG-H1, increases food intake by altering tyramine signaling via the GATA transcription factor ELT-3 in Caenorhabditis elegans.Elife. 2023 Sep 20;12:e82446. doi: 10.7554/eLife.82446. Elife. 2023. PMID: 37728328 Free PMC article.
-
Amitriptyline increases food intake via prdx-2 without altering other physiological parameters in C. elegans under a modified bacterial diet.Sci Rep. 2025 Aug 11;15(1):29428. doi: 10.1038/s41598-025-14773-8. Sci Rep. 2025. PMID: 40790145 Free PMC article.
-
AI-Driven Identification of Exceptionally Efficacious Polypharmacological Compounds That Extend the Lifespan of Caenorhabditis elegans.Aging Cell. 2025 Jul;24(7):e70060. doi: 10.1111/acel.70060. Epub 2025 Apr 22. Aging Cell. 2025. PMID: 40260750 Free PMC article.
-
Towards High-Throughput Chemobehavioural Phenomics in Neuropsychiatric Drug Discovery.Mar Drugs. 2019 Jun 6;17(6):340. doi: 10.3390/md17060340. Mar Drugs. 2019. PMID: 31174272 Free PMC article. Review.
-
Nuclear receptor 5A2 regulation of Agrp underlies olanzapine-induced hyperphagia.Mol Psychiatry. 2023 May;28(5):1857-1867. doi: 10.1038/s41380-023-01981-9. Epub 2023 Feb 10. Mol Psychiatry. 2023. PMID: 36765131 Free PMC article. Review.
References
Publication types
MeSH terms
Substances
Grants and funding
LinkOut - more resources
Full Text Sources
Molecular Biology Databases
Research Materials
Miscellaneous
