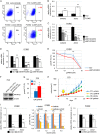
. 2019 Apr;38(14):2464-2481.
doi: 10.1038/s41388-018-0589-1. Epub 2018 Dec 7.

Cancer stem-like properties and gefitinib resistance are dependent on purine synthetic metabolism mediated by the mitochondrial enzyme MTHFD2

Affiliations

Cancer stem-like properties and gefitinib resistance are dependent on purine synthetic metabolism mediated by the mitochondrial enzyme MTHFD2

Tatsunori Nishimura et al. Oncogene. 2019 Apr.

Abstract

Tumor recurrence is attributable to cancer stem-like cells (CSCs), the metabolic mechanisms of which currently remain obscure. Here, we uncovered the critical role of folate-mediated one-carbon (1C) metabolism involving mitochondrial methylenetetrahydrofolate dehydrogenase 2 (MTHFD2) and its downstream purine synthesis pathway. MTHFD2 knockdown greatly reduced tumorigenesis and stem-like properties, which were associated with purine nucleotide deficiency, and caused marked accumulation of 5-aminoimidazole carboxamide ribonucleotide (AICAR)-the final intermediate of the purine synthesis pathway. Lung cancer cells with acquired resistance to the targeted drug gefitinib, caused by elevated expression of components of the β-catenin pathway, exhibited increased stem-like properties and enhanced expression of MTHFD2. MTHFD2 knockdown or treatment with AICAR reduced the stem-like properties and restored gefitinib sensitivity in these gefitinib-resistant cancer cells. Moreover, overexpression of MTHFD2 in gefitinib-sensitive lung cancer cells conferred resistance to gefitinib. Thus, MTHFD2-mediated mitochondrial 1C metabolism appears critical for cancer stem-like properties and resistance to drugs including gefitinib through consumption of AICAR, leading to depletion of the intracellular pool of AICAR. Because CSCs are dependent on MTHFD2, therapies targeting MTHFD2 may eradicate tumors and prevent recurrence.


Conflict of interest statement

AT and NG obtained research funding from Daiichi Sankyo Co. ltd.

Figures
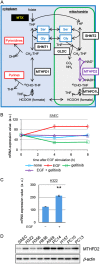
Fig. 1
Fig. 1
A map of folate-mediated 1C metabolism and expression of MTHFD2 in lung cancer tissues and EGF-stimulated cells. a Folate-mediated 1C metabolism. The reaction catalyzed by MTHFD2 is depicted with purple arrows. Major amino acids and enzymes involved in 1C metabolism are written in blue and black characters in boxes, respectively. MTX methotrexate. b Time-dependent MTHFD2 mRNA levels in SAECs stimulated with or without EGF (100 ng/ml) in the presence or absence of gefitinib (1 μM) were measured by quantitative RT-PCR. The data are represented as mean ± SD, N = 3. c MTHFD2 mRNA levels in H322 cells treated with or without EGF (100 ng/ml) for 8 h were measured by quantitative RT-PCR. Experiments were performed three times and the representative results were presented. The data are represented as mean ± SD, N = 3. Statistical significance is calculated with a two-tailed unpaired t-test; **p < 0.01. d Western blot for MTHFD2 in lung cancer cell lines and normal lung epithelial cells (SAECs). β-Actin was used as loading control
Fig. 2
Fig. 2
Reduced cellular growth and cancer stem-like properties following knockdown of MTHFD2. a Western blot for MTHFD2 in H322 cells in which MTHFD2 was knocked down with two different shRNAs. NCT negative control; shMTHFD2#50 and shMTHFD2#53, MTHFD2 knockdown. b Cell proliferation assay of H322 cells in vitro. Experiments were performed three times and the representative results were presented. The data are represented as mean ± SD, N = 3. c Tumor growth assay of H322 cells in vivo. The data are represented as mean ± SEM, N = 4. d Bright field images of tumor spheroids of MTHFD2 knockdown H322 cells. Scale bar, 100 µm. e Sphere formation efficiency of MTHFD2 knockdown H322 cells. Experiments were performed three times and the representative results were presented. The data are represented as mean ± SD, N = 4. f mRNA expression of SOX2 measured by quantitative RT-PCR and western blotting for SOX2 in MTHFD2 knockdown H322 cells. The data are represented as mean ± SD, N = 3. g Tumors at the end point of the limiting dilution assay (N = 6). Scale bar, 1 cm. h mRNA expression of MTHFD2 in MTHFD2 knockdown Adeno14-3 cells measured by quantitative RT-PCR. The data are represented as mean ± SD, N = 3. i Bright field images of tumor spheroids of MTHFD2 knockdown Adeno 14-3 cells. Scale bar, 50 µm. j Sphere formation efficiency of MTHFD2 knockdown Adeno 14-3 cells. The data are represented as mean ± SD, N = 3. Statistical significance is calculated with a two-tailed unpaired t-test; *p < 0.05, **p < 0.01
Fig. 3
Fig. 3
Reduction in folate-mediated 1C metabolism and purine synthesis following MTHFD2 knockdown. a Intercellular concentrations of glycine (Gly) and serine (Ser). NCT negative control; shMTHFD2#53, MTHFD2 knockdown. The data are represented as mean ± SD, N = 3. b Ratio of the amount of NADH to NAD+ (NADH/NAD+) normalized to the value in control cells. The data are represented as mean ± SD, N = 3. c Concentrations of metabolites involved in nucleotide synthesis pathway. Deep blue and red bars depict concentrations of metabolites in negative control and shMTHFD2#53 cells, respectively. Dashed lines indicate multiple reactions. Reactions transferring 1C are depicted by red lines. The data are represented as mean ± SD, N = 3. d Concentrations of purine and pyrimidine nucleotides with each base A, G, C, and U. The data are represented as mean ± SD, N = 3. e Cell proliferation assay in the presence of hypoxanthine or sodium formate. Experiments were performed three times and the representative results were presented. The data are represented as mean ± SD, N = 3. Statistical significance is calculated with a two-tailed unpaired t-test; N.S. not significant, *p < 0.05, **p < 0.01
Fig. 4
Fig. 4
Association of higher expression of MTHFD2 with worse prognosis and malignant status of lung cancer. a Kaplan–Meier survival curves of patients in the NCC cohort. Red and blue lines depict survival curves of patients with cancer tissues with high and low levels of MTHFD2 mRNA, respectively. The cutoff value was determined as the median value of the expression levels of MTHFD2 mRNA. The p-values were calculated with a log-rank test. b Box-whisker plot of MTHFD2 mRNA for patients in different stages (edges of boxes represent the 25th and 75th percentiles and bold lines in boxes represent the median value). Whiskers were elongated to the largest and smallest values, which are not outliers. c Immunohistochemistry for MTHFD2 in normal and lung cancer tissues. Scale bar, 100 µm. d Comparison of MTHFD2 expression levels among lung cancer tissues that show different differentiation grades on the tissue microarray. Blue circles indicate scores of each patient. Statistical significance is calculated with Steel–Dwass method. N.S. not significant; *p < 0.05; **p < 0.01
Fig. 5
Fig. 5
MTHFD2-dependent growth of drug-resistant PC9M2 cells. a Western blot for MTHFD2 in gefitinib-sensitive PC9 cells compared with A549 cells and SAECs. b Western blot for MTHFD2 in MTHFD2 knockdown PC9 cells (upper panel). β-Actin was used as loading control. Cell proliferation assay with MTHFD2 knockdown PC9 cells (lower panel). NCT negative control; shMTHFD2#53, MTHFD2 knockdown (lower panel). Experiments were performed three times and the representative results were presented. The data are represented as mean ± SD, N = 3. c MTHFD2 protein (upper panel) and MTHFD2 mRNA (lower panel) expression levels in PC9 and gefitinib-resistant PC9M2 cells. The data are represented as mean ± SD, N = 3. d Western blot for MTHFD2 in MTHFD2 knockdown PC9M2 cells (upper panel). β-Actin was used as loading control. Cell proliferation assay with MTHFD2 knockdown PC9M2 cells (lower panel). Experiments were performed three times and the representative results were presented. The data are represented as mean ± SD, N = 3. Statistical significance is calculated with a two-tailed unpaired t-test; N.S. not significant; **p < 0.01
Fig. 6
Fig. 6
Stem-like properties and drug resistance are dependent on MTHFD2. a ALDH activity in PC9 and PC9M2 cells was measured using the ALDEFLUOR® assay. Cells positive for ALDH are depicted with green dots as strong intensities of fluorescence measured by fluorescein isothiocyanate isomer-I (FITC) and their proportion to total cells are described in red (right panels). DEAB, an inhibitor of ALDH activity, was used for quenching and DEAB-treated cells were used as negative controls (left panels). Horizontal and vertical axes indicate intensities of ALDH activity (FITC) and complexity of cells (side scatter), respectively. b mRNA expression levels of stem cell markers in PC9 and PC9M2 cells were measured by quantitative RT-PCR and data are normalized by the value of PC9 cells. The data are represented as mean ± SD, N = 3. c mRNA expression levels of stem cell markers in PC9M2 cells were measured by quantitative RT-PCR and data are normalized by the value of the negative control (NCT). shMTHFD2#50, shMTHFD2#53, MTHFD2 knockdown. The data are represented as mean ± SD, N = 3. d mRNA expression levels of β-catenin and its downstream targets AXIN2 and CD44 were measured by quantitative RT-PCR and data are normalized with the value of NCT. The data are represented as mean ± SD, N = 3. e Gefitinib sensitivity was measured by cell growth with increased doses of gefitinib in PC9M2 cells. Experiments were performed three times and the representative results were presented. The data are represented as mean ± SD, N = 4. f Western blot for MTHFD2 in empty vector-transduced control PC9 cells (CTL) and MTHFD2-overexpressing PC9 cells (OE). g Cell growth activity was measured with or without gefitinib treatment (1 μM). Experiments were performed three times and the representative results were presented. The data are represented as mean ± SD, N = 3. h Growth curves of tumors of CTL or OE PC9 cells. Mice were administered orally with vehicle or gefitinib (10 mg/kg/day) every day from 6 days after the inoculation (yellow arrow). Horizontal axis and vertical axis depict days after inoculation of cells and volume of tumors, respectively. The data are represented as mean ± SEM, N = 4. i mRNA expression levels of stem cell markers in PC9M2 cells were measured by quantitative RT-PCR with or without AICAR treatment (1 mM) and data are normalized by the value of control (without AICAR treatment) (left panel). Cell growth activity was measured with increased doses of AICAR treatment with or without gefitinib (1 μM) (right panel). Experiments were performed three times and the representative results were presented. The data are represented as mean ± SD, N = 4. j mRNA expression levels of stem cell markers in PC9M2 cells were measured by quantitative RT-PCR with or without metformin treatment (4 mM) and data are normalized by the value of control (without AICAR treatment). The data are represented as mean ± SD, N = 3. Statistical significance is calculated with a two-tailed unpaired t-test; N.S. not significant, *p < 0.05, **p < 0.01

References

    1. Stewart BW, Wild C, International Agency for Research on Cancer, World Health Organization. World cancer report 2014. Lyon, France Geneva, Switzerland: International Agency for Research on Cancer WHO Press; 2014. xiv, p. 630.
    1. Lynch TJ, Bell DW, Sordella R, Gurubhagavatula S, Okimoto RA, Brannigan BW, et al. Activating mutations in the epidermal growth factor receptor underlying responsiveness of non-small-cell lung cancer to gefitinib. N Engl J Med. 2004;350:2129–39. doi: 10.1056/NEJMoa040938. - DOI - PubMed
    1. Paez JG, Janne PA, Lee JC, Tracy S, Greulich H, Gabriel S, et al. EGFR mutations in lung cancer: correlation with clinical response to gefitinib therapy. Science. 2004;304:1497–500. doi: 10.1126/science.1099314. - DOI - PubMed
    1. Russo A, Franchina T, Ricciardi GR, Picone A, Ferraro G, Zanghi M, et al. A decade of EGFR inhibition in EGFR-mutated non small cell lung cancer (NSCLC): old successes and future perspectives. Oncotarget. 2015;6:26814–25. doi: 10.18632/oncotarget.4254. - DOI - PMC - PubMed
    1. Camidge DR, Pao W, Sequist LV. Acquired resistance to TKIs in solid tumours: learning from lung cancer. Nat Rev Clin Oncol. 2014;11:473–81. doi: 10.1038/nrclinonc.2014.104. - DOI - PubMed

Publication types

MeSH terms